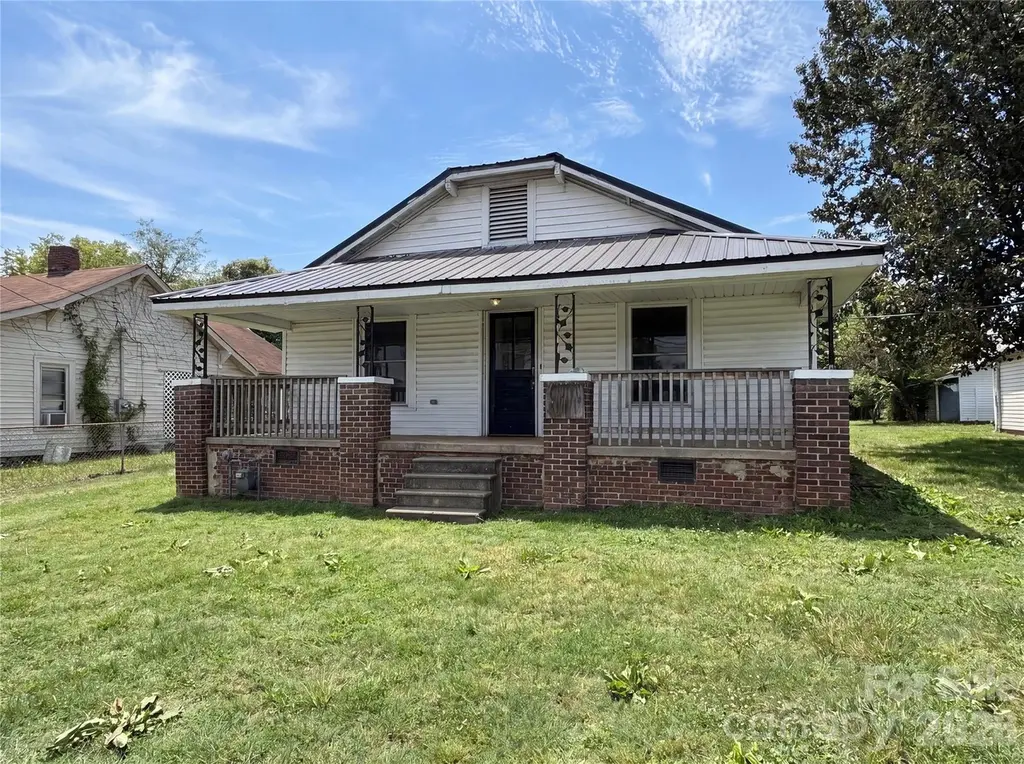
308 School St · Rockwell, NC
Flood risk 1/10 · Minimal
- FEMA flood zone
- X (unshaded)
- Chance of flooding over 30 yrs
- 0.0%
- Est. flood insurance / yr
- $507 – $1,088
Fire risk 4/10 · Minor
- Est. fire insurance / yr
- $906 – $1,684
Heat risk 6/10 · Moderate
- Hot days now (above 104°F)
- 7 days/yr
- Hot days in 30 yrs
- 17 days/yr
Wind risk 4/10 · Minor
- Chance of severe wind over 30 yrs
- 18.0%
Air-quality risk 3/10 · Minor
- Unhealthy air days now
- 2 days/yr
- Unhealthy air days in 30 yrs
- 3 days/yr
Risk factors via First Street. Map © Google.
Why this score? — see what drove the B grade
The composite is a weighted blend of 9 inputs, each scored 0–100. Each bar is that input's sub-score; the figure is the points it added to the 100-point composite (weight × sub-score).
- Cash flow +30.0/30.0
- ARV discount +15.0/15.0
- DSCR +10.0/10.0
- 1% rule +8.3/10.0
- Livability +3.8/5.0
- Schools +2.6/10.0
- Rent growth +2.5/5.0
- Condition / age +2.5/5.0
- Appreciation +0.0/10.0
$140,000
🖨 Deal sheet 📄 Offer letter ✓ Due diligence
Listing remarks
Calling all investors, renovators, and visionaries! This 3-bedroom home in the charming town of Rockwell offers a rare opportunity to bring your ideas to life. In need of significant repairs and updates, this property is a true fixer-upper with endless potential for those looking to renovate, restore, or rebuild value. Whether you're searching for your next investment project, flip opportunity, or a property to customize from the ground up, this one is worth a look. Conveniently located in Rockwell, a small Rowan County community known for its small-town charm and easy access to nearby amenities. Property is being sold as-is. Bring your tools, imagination, and make this diamond in the rough
Key facts
- 0.26 acre lot
- Built 1920
- Listed 6 days
Property features AI
Finance
- HOA & community: No HOA
Exterior
- Parking: Driveway; Other parking features (see remarks); No main-level garage
- Utilities: City water; Public sewer
- Home design: Single-family residential; One story (single level); Site-built
- Construction: Wood construction; Crawl space foundation
- Exterior features: Lot is approximately 0.26 acres; Road surfaces include dirt and paved; Publicly maintained road access
Interior
- Bedrooms: Three bedrooms, all on the main level
- Bathrooms: One full bathroom (main level)
- Interior features: Seven total rooms; Appliances: Other (see remarks); Heating: Other (see remarks); Cooling: Other (see remarks)
- Laundry & utility: Utility room for laundry
Neighborhood map
What this means for you Summary
Snapshot
- This is a 3-bed/1.0-bath single-family listed at $140k.
Deal economics
- At list price, monthly cash flow is $561 ($7k/yr) — positive.
- The deal already cash-flows at list — no discount required.
- Meets the 1% rule at list price ($2k rent vs $140k).
- Cap rate 11.1% vs local median 4.1% in Rockwell — top-decile yield for the area; either an underpriced asset or a hidden risk that comps aren't pricing in. Stress-test before assuming the spread holds.
Location & tenants
- Location reads 76/100 on livability (#37 in NC, #3,505 nationally) — a middle-class / working-renter tenant base. Strengths: cost of living A+, housing A+, health & safety A+; Watch: schools F, amenities F, commute F.
- Rowan-Salisbury Schools (rural): math 26% / reading 35% proficiency, ranked #142 of 178 in NC (top 80%) — families likely to look elsewhere, expect single-tenant / working-renter base with shorter leases.
- Market conditions: 39 active listings in the ZIP; 592 units permitted in Rowan County in 2024 (5 in 5+ unit buildings).
Forward outlook
- Local home prices are declining (-3.0%/yr); year-one equity from $968 of loan paydown is wiped out by about $4k of value loss. Plan a longer hold.
- Rowan County population projected to shrink 6% by 2050 — rents likely to lag national; underwrite the cash flow, not the appreciation.
- At projected returns (-3.0% appreciation + 3.0% rent growth), your $39k cash investment doubles in ~7 years — after that, you're playing with house money.
Negotiation context
- Only 6 days on market — expect competitive offers; lowballing is unlikely to land.
- Current owner paid $65k; list at $140k implies a 115% gain — meaningful room to come down on a strong offer.
Risks & watch-outs
- Watch-outs: built in 1920 — expect roof / HVAC / electrical / plumbing capex.
- Climate carrying-cost: extreme-heat days projected 7→17/yr by 2055 (HVAC capex compounding) — expect insurance premiums to compound above CPI over the hold.
Questions for the listing agent
- Built in 1920 — when were the roof, HVAC, electrical panel, plumbing, and water heater last replaced?
- Is there a deadline driving the sale (1031 exchange, divorce, estate, relocation)? That informs how much negotiation room exists.
- Schools are F-rated, which usually means shorter tenancies and higher turnover. Who's the typical renter profile here, and what's been the actual vacancy rate?
- What's the average days-on-market for RENTAL listings here right now (not sales)? A rising rental-DOM trend means longer vacancies and softer asking-rent achievability than the comps imply.
- What's the recent tenant-quality profile in this submarket — average credit score on applications, eviction rate, late-payment / NSF rate, and stable-employment percentage? A property-management company in the area should have these aggregated.
- How much new for-sale + rental construction is in the pipeline within 1–3 miles? Heavy new supply typically softens prices + rents 12–24 months out; constrained supply supports both.
Investment metrics
- 1% rule
- 1.33% ✓
- Cap rate
- 11.10%
- Cash-on-cash
- 17.16%
- DSCR
- 1.76
- GRM
- 6.2
CMA / ARV
- ARV (on-the-fly)
- $257,631
- Comps found
- 12
Show comp detail 12 sales within ~0.75 mi
| Address | Dist | Beds/Ba | Sqft | Sold | Price | $/sf | Match |
|---|---|---|---|---|---|---|---|
| 320 Carolina Ave | 0.19mi | 3/2.0 | 1,214 (-1%) | 6mo | $250,000 | $206 | 81 |
| 208 Pine St | 0.38mi | 3/2.0 | 1,200 (-2%) | 3mo | $272,500 | $227 | 73 |
| 219 Pine St | 0.43mi | 3/2.0 | 1,200 (-2%) | 10mo | $279,900 | $233 | 64 |
| 508 Carolina Ave | 0.30mi | 3/2.0 | 1,311 (+7%) | 9mo | $276,000 | $211 | 62 |
| 406 Cannon St | 0.30mi | 2/1.0 (-1) | 1,093 (-10%) | 3mo | $180,000 | $165 | 61 |
| 209 N Cherry St | 0.33mi | 3/2.0 | 1,310 (+7%) | 10mo | $275,000 | $210 | 60 |
| 522 Dogwood Cir | 0.27mi | 3/2.0 | 1,100 (-10%) | 9mo | $238,000 | $216 | 59 |
| 202 Market St | 0.28mi | 2/1.0 (-1) | 1,085 (-11%) | 13mo | $200,000 | $184 | 52 |
| 212 Pine St | 0.39mi | 3/2.0 | 1,106 (-9%) | 12mo | $280,000 | $253 | 52 |
| 625 Charles St | 0.30mi | 3/2.0 | 1,360 (+11%) | 14mo | $300,000 | $221 | 51 |
| 408 Sides St | 0.58mi | 3/1.5 | 1,368 (+12%) | 1mo | $289,000 | $211 | 50 |
| 706 Sides St | 0.59mi | 2/1.5 (-1) | 1,350 (+11%) | 9mo | $270,000 | $200 | 41 |
Match score weights: distance 35% · size 25% · config 20% · recency 20%. Top-matched comps best support the ARV.
Projected returns pro-forma
-3.0% appreciation · 3.0% rent growth · sell at horizon
- IRR
- 8.5%
- Equity multiple
- 1.33×
- Total profit
- $13,009
- Equity at exit
- $20,874
- IRR
- 17.7%
- Equity multiple
- 2.46×
- Total profit
- $57,279
- Equity at exit
- $12,105
Cash invested: $39,200 (down + closing). Projections, not guarantees.
Landlord ↔ Tenant lean methodology
- Overall (STATE)
- 85 Strongly Landlord-Friendly
- State North Carolina
- 85 Strongly Landlord-Friendly · R+3
- County
- — inherits STATE
- City
- — inherits STATE
ZIP-level market 28138
- Home prices YoY
- -14.7%
- Active inventory
- 39
- Price-to-rent
- 6.2×
Monthly cashflow live
- Estimated rent
- $1,867 medium interval (Pro) →
- Mortgage (P&I)
- −$734
- Tax from tax record
- −$122 /mo · $1,464/yr
- Insurance
- −$58
- HOA
- −$0
- Vacancy / Maint / Mgmt
- −$392
- Net cashflow
- $561
Break-even live
UW: 25.0% down · 7.5% · 30yr · 1.5% tax · 5.0% vac · 8.0% maint · 8.0% mgmt
Financing live
Cash to close
- Down payment
- $35,000
- Closing costs
- $4,200
- Reserves months
- —
- Total cash needed
- —
Loan-product check · same deal, 3 products live
Conventional
25% down · 7.5% · 30yr
- Down + closing
- —
- Monthly P&I
- —
- Monthly cashflow
- —
- DSCR
- —
- Eligible?
- —
Personal DTI + credit; lowest rate.
DSCR
20% down · 8.5% · 30yr
- Down + closing
- —
- Monthly P&I
- —
- Monthly cashflow
- —
- DSCR
- —
- Eligible?
- —
No personal income docs; deal must DSCR.
Hard money
10% down · 12.0% · 12mo
- Down + closing
- —
- Monthly P&I
- —
- Monthly cashflow
- —
- DSCR
- —
- Eligible?
- —
Short-term bridge; refi at stabilization.
Listing history 6 events
-
2026-06-18days on market $140,000 Active 6 DOM
-
2026-06-17days on market $140,000 Active 5 DOM
-
2026-06-16days on market $140,000 Active 4 DOM
-
2026-06-15days on market $140,000 Active 3 DOM
-
2026-06-13remarks 699-char remark
-
2026-06-13$140,000 Active 1 DOM
ⓘ Source: listings_history table (triggers on properties + properties_extension) + one-shot
backfill from property_details.listing_events for pre-trigger history.
Tax reassessment forecast NC · Resets to sale price
- Current annual tax
- $1,464 · $122/mo
- Projected year-2 tax
- $1,464 · $122/mo
- Expected delta
- $0/yr ($0/mo · 0.0%)
ⓘ Screening estimate from a state-policy table — verify with the county assessor before closing.
Climate risk First Street
- Flood 1/10 Low FEMA zone X (unshaded) · 0% chance over 30 yrs
- Wildfire 4/10 Moderate
- Heat 6/10 Major 7 d/yr ≥104°F today · 17 d/yr by 30 yrs out
- Wind 4/10 Moderate 18% chance of damaging wind over 30 yrs
- Air quality 3/10 Moderate 2 unhealthy d/yr today · 3 by 30 yrs out
Nearby sold comps map
Loading sold comps map…
Walkable amenities ~0.75 mi
Loading nearby amenities…
Taxation est. · year 1
- Rental income
- $22,405
- − Mortgage interest
- −$7,842
- − Property taxes
- −$1,464
- − Insurance
- −$700
- − Repairs & maintenance
- −$1,792
- − Management
- −$1,792
- − Depreciation
- −$4,073
- Taxable income
- $4,742
- Est. tax owed @ 24.0%
- −$1,138
- After-tax cash flow
- $5,588/yr
For passive investors: Depreciation is non-cash, so a rental often shows a tax loss while cash-flowing — sheltering income. Rental losses are passive: they offset passive income freely, and up to $25,000/yr can offset ordinary (W-2) income if you actively participate and your MAGI is under $100k (phasing out to $0 by $150k); unused losses carry forward. On sale, claimed depreciation is recaptured at up to 25%, and gains may owe capital-gains tax (a 1031 exchange can defer both). Figures are a year-1 estimate at your 24.0% rate — not tax advice; consult a CPA.
Schools (NCES district)
- District
- Rowan-Salisbury Schools
- NCES district ID
- 3704050
- Math proficiency
- 26% ▲ 2.00%
- Reading proficiency
- 35% ▲ 1.00%
- Median HH income
- $43,953
- Composite
- 26.01/100
- National rank
- #7317
- State rank
- #142 of 178 in NC
Livability — Rockwell
- Score
- 76/100
- State rank
- #37
- US rank
- #3505
Category grades
Schools grade is shown separately in the Schools card above.
Census & demographics
- Census place
- Rockwell, NC
- Population (ZIP)
- 9,795
Population outlook (Rowan County) Hauer SSP2
- Today (2025)
- 140,430 people
- By 2030
- 140,193 · -0.2%
- By 2040
- 137,617 · -2.0%
- By 2050
- 131,826 · -6.1%
- By 2075
- 115,123 · -18.0%
- By 2100
- 92,774 · -33.9%
Race, ethnicity, and origin ACS 2023
- Neighborhood character
- Predominantly White (93%)
- Race & ethnicity
- White 93% Two or more races 5% Hispanic / Latino 4%
- Common ancestry
- Serbian 3% Italian 2% Slovak 2%
- Foreign-born
- 1% · Canada
- Languages at home
- 96% English-only · Spanish 3%
Political lean MEDSL · Rowan
- 2024 margin
- Solid R (+35.9) · D 31.6% · R 67.5%
- 2008→2024 swing
- -13.1pp toward R · 2008: -22.8pp · 2024: -35.9pp
- All cycles
- 2024: R+35.9 2020: R+35.7 2016: R+36.8 2012: R+26.0 2008: R+22.8
Not yet ingested
- Civics
- —
Market trends
- HPI YoY
- ▼ -50.83%
- Current HPI
- 293.9512
- Rent YoY
- —
- Metro
- —
- State GDP YoY
- ▲ 3.28%
- F500 in state
- 26
Industry mix (Fortune 500 HQ in NC)
| Industry | F500 HQs | Revenue |
|---|---|---|
| Financial Services | 2 | $213B |
|
||
| Retail | 2 | $95B |
|
||
| Industrial Conglomerate | 1 | $38B |
|
||
| Metals / Steel | 1 | $35B |
|
||
| Utilities | 1 | $30B |
|
||
| Industrial Machinery | 1 | $19B |
|
||
Price history
+86.7% since first listed3 events — show timeline
- 2026-06-12 Listed $140,000 CANOPYMLS as Distributed by MLS Grid
- 2020-02-19 Sold (Public Records) $65,000 Public Records
- 2005-03-16 Sold (Public Records) $75,000 Public Records
Property tax history
+6.7%/yrLatest (2025): $1,464 · +0.0% YoY. Source: county tax records.
Cash-flow waterfall
monthlySold comps — $/sqft
last 12 mo · ≤1 miLoading sold comps…