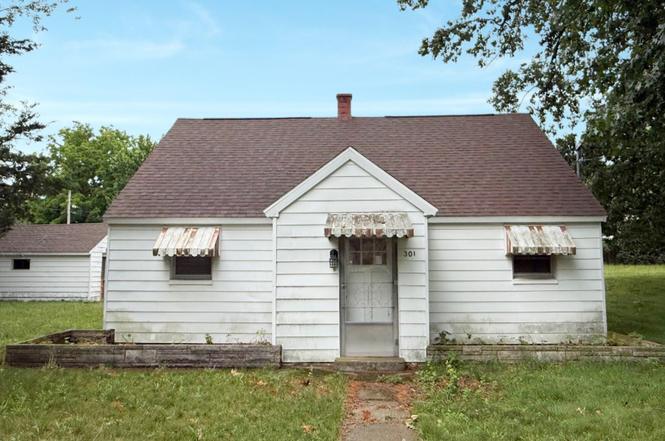
301 Mcmaster St · Dowagiac, MI
Flood risk 1/10 · Minimal
- FEMA flood zone
- X (unshaded)
- Chance of flooding over 30 yrs
- 0.0%
- Est. flood insurance / yr
- $473 – $860
Fire risk 1/10 · Minimal
- Est. fire insurance / yr
- $784 – $1,456
Heat risk 2/10 · Minimal
- Hot days now (above 99°F)
- 7 days/yr
- Hot days in 30 yrs
- 16 days/yr
Wind risk 2/10 · Minimal
- Chance of severe wind over 30 yrs
- —
Air-quality risk 2/10 · Minimal
- Unhealthy air days now
- 1 days/yr
- Unhealthy air days in 30 yrs
- 2 days/yr
Risk factors via First Street. Map © Google.
Why this score? — see what drove the B- grade
The composite is a weighted blend of 9 inputs, each scored 0–100. Each bar is that input's sub-score; the figure is the points it added to the 100-point composite (weight × sub-score).
- Cash flow +27.6/30.0
- ARV discount +15.0/15.0
- DSCR +9.7/10.0
- 1% rule +6.6/10.0
- Livability +3.6/5.0
- Rent growth +2.5/5.0
- Condition / age +2.5/5.0
- Schools +2.1/10.0
- Appreciation +0.0/10.0
$100,000
🖨 Deal sheet 📄 Offer letter ✓ Due diligence
Listing remarks MLS
Charming 2-bedroom, 1-bathroom ranch home on a generous corner lot, ready for your finishing touches. Features include central air and numerous updates, including a newer roof, drywall, flooring, plumbing, and electrical. The seller has completed much of the work, leaving an opportunity to add your own style and value. A one-car detached garage and plenty of yard space add to the property's appeal. Whether you're searching for a primary residence or an investment opportunity, this property is worth a look.
Key facts
- Newer roof
- Central air
- Numerous updates
Tags
Property features AI
Exterior
- Parking: Detached 1-car garage
- Utilities: Natural gas water heater; Public water
- Home design: Ranch-style single family residence; Living area approximately 944; Built in 1940; Composition roof; Public water
- Construction: Aluminum siding; Slab foundation
- Exterior features: Corner lot
Interior
- Kitchen: Oven; Refrigerator; Kitchen approximately 10 x 14
- Bedrooms: Primary bedroom (10 x 12); Bedroom 2 with laundry area (10 x 11)
- Bathrooms: 1 full bathroom
- Heating & cooling: Forced air heating; Has cooling
- Interior features: Storm windows and screens; Total of 5 rooms
- Laundry & utility: Laundry area located with second bedroom
Neighborhood map
What this means for you Summary
Snapshot
- This is a 2-bed/1.0-bath single-family listed at $100k.
Deal economics
- At list price, monthly cash flow is $299 ($4k/yr) — positive.
- The deal already cash-flows at list — no discount required.
- Meets the 1% rule at list price ($1k rent vs $100k).
- Cap rate 9.9% vs local median 4.8% in Dowagiac — top-decile yield for the area; either an underpriced asset or a hidden risk that comps aren't pricing in. Stress-test before assuming the spread holds.
Location & tenants
- Location reads 72/100 on livability (#243 in MI) — a middle-class / working-renter tenant base. Strengths: cost of living A+, housing A+, health & safety A+; Watch: commute D, schools F, crime F.
- Dowagiac Union School District (town): math 19% / reading 31% proficiency, ranked #430 of 540 in MI (top 80%) — low school quality limits family demand, transient renter base, plan for 1-2y turnover; 66% free/reduced lunch — lower-income household profile, screen leases tightly.
- Market conditions: 85 active listings in the ZIP; 1 comparable units currently listed for rent nearby; 128 units permitted in Cass County in 2024 (0 in 5+ unit buildings).
Forward outlook
- Local home prices are declining (-3.0%/yr); year-one equity from $691 of loan paydown is wiped out by about $3k of value loss. Plan a longer hold.
- Cass County population projected at -20% by 2050 — secular population decline; favor cash flow + early exit over multi-decade hold.
- At projected returns (-3.0% appreciation + 3.0% rent growth), your $28k cash investment doubles in ~9 years — after that, you're playing with house money.
Negotiation context
- Only 1 days on market — expect competitive offers; lowballing is unlikely to land.
- 5 sale attempts since 25y ago with the ask held roughly flat each time — persistent listings suggest the price (not the market) is what's stuck; bring a comps-based counter.
Risks & watch-outs
- Watch-outs: built in 1940 — expect roof / HVAC / electrical / plumbing capex.
Questions for the listing agent
- Built in 1940 — when were the roof, HVAC, electrical panel, plumbing, and water heater last replaced?
- Is there a deadline driving the sale (1031 exchange, divorce, estate, relocation)? That informs how much negotiation room exists.
- Schools are F-rated, which usually means shorter tenancies and higher turnover. Who's the typical renter profile here, and what's been the actual vacancy rate?
- Crime grade is F in this area — have there been break-ins, vandalism, or insurance claims at this property in the last 3 years? What carrier currently insures it and at what premium?
- What's the average days-on-market for RENTAL listings here right now (not sales)? A rising rental-DOM trend means longer vacancies and softer asking-rent achievability than the comps imply.
- What's the recent tenant-quality profile in this submarket — average credit score on applications, eviction rate, late-payment / NSF rate, and stable-employment percentage? A property-management company in the area should have these aggregated.
- How much new for-sale + rental construction is in the pipeline within 1–3 miles? Heavy new supply typically softens prices + rents 12–24 months out; constrained supply supports both.
Investment metrics
- 1% rule
- 1.16% ✓
- Cap rate
- 9.88%
- Cash-on-cash
- 12.82%
- DSCR
- 1.57
- GRM
- 7.2
CMA / ARV
- ARV (on-the-fly)
- $140,656
- Comps found
- 12
Show comp detail 12 sales within ~0.75 mi
| Address | Dist | Beds/Ba | Sqft | Sold | Price | $/sf | Match |
|---|---|---|---|---|---|---|---|
| 304 E Prairie Ronde St | 0.16mi | 2/1.0 | 972 (+3%) | 3mo | $65,500 | $67 | 85 |
| 303 Jones St | 0.15mi | 2/1.0 | 871 (-8%) | 5mo | $161,000 | $185 | 76 |
| 409 W Railroad St | 0.36mi | 2/1.0 | 987 (+5%) | 2mo | $147,000 | $149 | 74 |
| 27795 Burmax Park | 0.32mi | 2/1.0 | 910 (-4%) | 11mo | $122,500 | $135 | 70 |
| 107 Sherwood St | 0.44mi | 2/1.0 | 976 (+3%) | 7mo | $160,000 | $164 | 68 |
| 217 E Prairie Ronde St | 0.19mi | 2/1.0 | 1,056 (+12%) | 8mo | $60,000 | $57 | 65 |
| 205.5 W Railroad St | 0.57mi | 2/1.0 | 1,012 (+7%) | 2mo | $114,000 | $113 | 60 |
| 303 Orchard St | 0.64mi | 2/1.0 | 1,000 (+6%) | 4mo | $41,000 | $41 | 57 |
| 315 Mcomber St | 0.40mi | 2/1.0 | 1,072 (+14%) | 2mo | $42,000 | $39 | 57 |
| 208 Sherwood St | 0.52mi | 2/1.0 | 840 (-11%) | 3mo | $140,000 | $167 | 55 |
| 604 E Prairie Ronde St | 0.32mi | 3/1.0 (+1) | 1,036 (+10%) | 14mo | $215,000 | $208 | 52 |
| 116 Sherwood St | 0.47mi | 2/1.0 | 841 (-11%) | 15mo | $133,000 | $158 | 47 |
Match score weights: distance 35% · size 25% · config 20% · recency 20%. Top-matched comps best support the ARV.
Projected returns pro-forma
-3.0% appreciation · 3.0% rent growth · sell at horizon
- IRR
- 2.6%
- Equity multiple
- 1.10×
- Total profit
- $2,815
- Equity at exit
- $14,910
- IRR
- 12.2%
- Equity multiple
- 1.96×
- Total profit
- $26,868
- Equity at exit
- $8,646
Cash invested: $28,000 (down + closing). Projections, not guarantees.
Landlord ↔ Tenant lean methodology
- Overall (STATE)
- 62 Landlord-Friendly
- State Michigan
- 62 Landlord-Friendly · EVEN
- County
- — inherits STATE
- City
- — inherits STATE
ZIP-level market 49047
- Active inventory
- 85
- Price-to-rent
- 7.2×
Monthly cashflow live
- Estimated rent
- $1,162 medium interval (Pro) →
- Mortgage (P&I)
- −$524
- Tax from tax record
- −$53 /mo · $634/yr
- Insurance
- −$42
- HOA
- −$0
- Vacancy / Maint / Mgmt
- −$244
- Net cashflow
- $299
Break-even live
UW: 25.0% down · 7.5% · 30yr · 1.5% tax · 5.0% vac · 8.0% maint · 8.0% mgmt
Financing live
Cash to close
- Down payment
- $25,000
- Closing costs
- $3,000
- Reserves months
- —
- Total cash needed
- —
Loan-product check · same deal, 3 products live
Conventional
25% down · 7.5% · 30yr
- Down + closing
- —
- Monthly P&I
- —
- Monthly cashflow
- —
- DSCR
- —
- Eligible?
- —
Personal DTI + credit; lowest rate.
DSCR
20% down · 8.5% · 30yr
- Down + closing
- —
- Monthly P&I
- —
- Monthly cashflow
- —
- DSCR
- —
- Eligible?
- —
No personal income docs; deal must DSCR.
Hard money
10% down · 12.0% · 12mo
- Down + closing
- —
- Monthly P&I
- —
- Monthly cashflow
- —
- DSCR
- —
- Eligible?
- —
Short-term bridge; refi at stabilization.
Rent comps 1 comps
| Address | Beds | Baths | Sqft | Rent | $/sqft | DOM | Units | Dist |
|---|---|---|---|---|---|---|---|---|
| 550 Riverside Dr Unit Two Bedroom Dowagiac, MI | 2.0 | 1.0 | 808 | $1,162 | $1.44 | 43d | 1 | 1.32mi |
Listing history 2 events
-
2026-06-18remarks 511-char remark
Show marketing remark (511 chars)
Charming 2-bedroom, 1-bathroom ranch home on a generous corner lot, ready for your finishing touches. Features include central air and numerous updates, including a newer roof, drywall, flooring, plumbing, and electrical. The seller has completed much of the work, leaving an opportunity to add your own style and value. A one-car detached garage and plenty of yard space add to the property's appeal. Whether you're searching for a primary residence or an investment opportunity, this property is worth a look.
-
2026-06-18$100,000 Active 1 DOM
Show marketing remark (511 chars)
Charming 2-bedroom, 1-bathroom ranch home on a generous corner lot, ready for your finishing touches. Features include central air and numerous updates, including a newer roof, drywall, flooring, plumbing, and electrical. The seller has completed much of the work, leaving an opportunity to add your own style and value. A one-car detached garage and plenty of yard space add to the property's appeal. Whether you're searching for a primary residence or an investment opportunity, this property is worth a look.
ⓘ Source: listings_history table (triggers on properties + properties_extension) + one-shot
backfill from property_details.listing_events for pre-trigger history.
Tax reassessment forecast MI · Partial reset (capped growth)
- Current annual tax
- $634 · $53/mo
- Projected year-2 tax
- $1,087 · $91/mo
- Expected delta
- +$453/yr (+$38/mo · 71.4%)
ⓘ Screening estimate from a state-policy table — verify with the county assessor before closing.
Climate risk First Street
- Flood 1/10 Low FEMA zone X (unshaded) · 0% chance over 30 yrs
- Wildfire 1/10 Low
- Heat 2/10 Low 7 d/yr ≥99°F today · 16 d/yr by 30 yrs out
- Wind 2/10 Low
- Air quality 2/10 Low 1 unhealthy d/yr today · 2 by 30 yrs out
Nearby sold comps map
Loading sold comps map…
Walkable amenities ~0.75 mi
Loading nearby amenities…
Taxation est. · year 1
- Rental income
- $13,944
- − Mortgage interest
- −$5,602
- − Property taxes
- −$634
- − Insurance
- −$500
- − Repairs & maintenance
- −$1,116
- − Management
- −$1,116
- − Depreciation
- −$2,909
- Taxable income
- $2,068
- Est. tax owed @ 24.0%
- −$496
- After-tax cash flow
- $3,092/yr
For passive investors: Depreciation is non-cash, so a rental often shows a tax loss while cash-flowing — sheltering income. Rental losses are passive: they offset passive income freely, and up to $25,000/yr can offset ordinary (W-2) income if you actively participate and your MAGI is under $100k (phasing out to $0 by $150k); unused losses carry forward. On sale, claimed depreciation is recaptured at up to 25%, and gains may owe capital-gains tax (a 1031 exchange can defer both). Figures are a year-1 estimate at your 24.0% rate — not tax advice; consult a CPA.
Schools (NCES district)
- District
- Dowagiac Union School District
- NCES district ID
- 2612150
- Math proficiency
- 19% ▼ -2.00%
- Reading proficiency
- 31% ▼ -1.00%
- Median HH income
- $39,741
- Composite
- 21.03/100
- National rank
- #8452
- State rank
- #430 of 540 in MI
Livability — Dowagiac
- Score
- 72/100
- State rank
- #243
- US rank
- #6087
Category grades
Schools grade is shown separately in the Schools card above.
Census & demographics
- Census place
- Dowagiac, MI
- Population (ZIP)
- 14,506
Population outlook (Cass County) Hauer SSP2
- Today (2025)
- 49,919 people
- By 2030
- 48,320 · -3.2%
- By 2040
- 44,230 · -11.4%
- By 2050
- 39,852 · -20.2%
- By 2075
- 31,440 · -37.0%
- By 2100
- 23,914 · -52.1%
Race, ethnicity, and origin ACS 2023
- Neighborhood character
- Predominantly White (81%)
- Race & ethnicity
- White 81% Hispanic / Latino 7% Two or more races 6% Black 6% Native American 2%
- Hispanic origin (detail)
- Mexican 7%
- Common ancestry
- Romanian 5% Iranian 2% Italian 2%
- Foreign-born
- 3% · Canada
- Languages at home
- 94% English-only · Spanish 4% German/W. Germanic 1%
Political lean MEDSL · Cass
- 2024 margin
- Solid R (+33.9) · D 32.5% · R 66.4% · Other 1.1%
- 2008→2024 swing
- -38.0pp toward R · 2008: 4.1pp · 2024: -33.9pp
- All cycles
- 2024: R+33.9 2020: R+28.9 2016: R+29.9 2012: R+13.7 2008: D+4.1
Not yet ingested
- Civics
- —
Market trends
- HPI YoY
- ▼ -188.04%
- Current HPI
- 186.2757
- Rent YoY
- —
- Metro
- —
- State GDP YoY
- ▲ 1.37%
- F500 in state
- 28
Industry mix (Fortune 500 HQ in MI)
| Industry | F500 HQs | Revenue |
|---|---|---|
| Automotive Parts | 3 | $48B |
|
||
| Automotive | 2 | $372B |
|
||
| Chemicals | 1 | $45B |
|
||
| Automotive Retail | 1 | $29B |
|
||
| Healthcare / Medical Devices | 1 | $23B |
|
||
| Automotive Technology | 1 | $20B |
|
||
Price history
+82.1% since first listed7 events — show timeline
- 2026-06-18 Listed $100,000 REALCOMP
- 2026-06-18 Listed $100,000 MiRealSource-MiMLS
- 2026-06-18 Listed $100,000 SW Michigan MLS
- 2014-09-15 Listing Removed — SW Michigan MLS
- 2003-01-31 Listing Removed — REALCOMP
- 2001-12-02 Listed $54,900 REALCOMP
- 2001-12-02 Listed $54,900 SW Michigan MLS
Property tax history
-4.5%/yrLatest (2025): $634 · -50.8% YoY. Source: county tax records.
Cash-flow waterfall
monthlySold comps — $/sqft
last 12 mo · ≤1 miLoading sold comps…