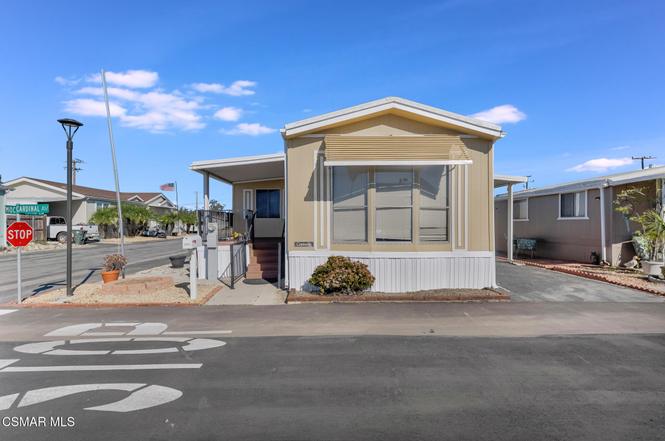
2117 Cardinal Ave Unit 2117h · Oxnard, CA
Flood risk 1/10 · Minimal
- FEMA flood zone
- X (unshaded)
- Chance of flooding over 30 yrs
- 0.0%
- Est. flood insurance / yr
- $507 – $1,088
Fire risk 3/10 · Minor
- Est. fire insurance / yr
- $659 – $1,223
Heat risk 3/10 · Minor
- Hot days now (above 85°F)
- 7 days/yr
- Hot days in 30 yrs
- 17 days/yr
Wind risk 1/10 · Minimal
- Chance of severe wind over 30 yrs
- —
Air-quality risk 4/10 · Minor
- Unhealthy air days now
- 4 days/yr
- Unhealthy air days in 30 yrs
- 5 days/yr
Risk factors via First Street. Map © Google.
Why this score? — see what drove the B+ grade
The composite is a weighted blend of 9 inputs, each scored 0–100. Each bar is that input's sub-score; the figure is the points it added to the 100-point composite (weight × sub-score).
- Cash flow +30.0/30.0
- ARV discount +15.0/15.0
- 1% rule +10.0/10.0
- DSCR +10.0/10.0
- Schools +3.6/10.0
- Livability +2.7/5.0
- Rent growth +2.5/5.0
- Condition / age +2.5/5.0
- Appreciation +0.0/10.0
$139,990
🖨 Deal sheet 📄 Offer letter ✓ Due diligence
Listing remarks
Located in the quiet 55+ senior community of Sunny Acres MHP, this 2 bedroom unit with enclosed patio offers you the flexible space you need at a price you can afford. There is a newer washer and dryer. The park features a nice pool area and rec room as well as RV/Boat parking. There is plenty of space in the storage /workshop in the carport. An ideal climate, a close to shopping and the beach, make this the perfect location. Move in ready with new carpet, this manufactured home is just waiting for it's new owner.
Key facts
- New carpet
- Move in ready
- Close to shopping
Tags
Property features AI
Finance
- Financial info: Listing available for cash buyers
Exterior
- Parking: 2-car carport
- Utilities: Property is on a lease lot (land lease)
- Home design: Manufactured home (Skyline), 14' x 56'
- Construction: Built in 1984
- Exterior features: Ground-level entry with steps; Private pool and spa; Located in a senior community; Model: Caravelle
Interior
- Bedrooms: 2 bedrooms
- Flooring: Carpet flooring
- Bathrooms: 1 full bathroom
- Interior features: Living area recorded as 728 (public records); No fireplace
Neighborhood map
What this means for you Summary
Snapshot
- This is a 2-bed/1.0-bath manufactured listed at $140k.
Deal economics
- At list price, monthly cash flow is $976 ($12k/yr) — positive.
- The deal already cash-flows at list — no discount required.
- Meets the 1% rule at list price ($2k rent vs $140k).
- Recommended offer: $127k (9.0% below list) — sets the bar for market timing.
- Cap rate 14.7% vs local median 2.5% in Oxnard — top-decile yield for the area; either an underpriced asset or a hidden risk that comps aren't pricing in. Stress-test before assuming the spread holds.
Location & tenants
- Location reads 54/100 on livability (#905 in CA) — a working-class tenant base; expect higher turnover. Strengths: employment A-, health & safety A-, housing B; Watch: schools F, crime F, amenities D-.
- Oxnard Union High (urban): math 28% / reading 51% proficiency, ranked #220 of 517 in CA (top 43%) — families likely to look elsewhere, expect single-tenant / working-renter base with shorter leases.
- Market conditions: Rents flat; 31 active listings in the ZIP; 1 comparable units currently listed for rent nearby; solid renter incomes; 1,759 units permitted in Ventura County in 2024 (1,196 in 5+ unit buildings).
- This rent runs 34% of the median local income ($87k/yr) — at the standard rent-burdened threshold; future hikes will face affordability resistance.
Forward outlook
- Local home prices are declining (-3.0%/yr); year-one equity from $968 of loan paydown is wiped out by about $4k of value loss. Plan a longer hold.
- Ventura County population projected at +4% by 2050 — modest demand growth; plan on rents tracking national, not racing it.
- At projected returns (-3.0% appreciation + 0.0% rent growth), your $39k cash investment doubles in ~5 years — after that, you're playing with house money.
Negotiation context
- It's been on market 119 days — a 9% lower offer ($127k) is reasonable based on typical stale-listing flexibility.
- 2 sale attempts since 21y ago; this cycle's ask has dropped $35k (20%) from the opening price — seller is motivated, your offer sets the floor, not the list.
Questions for the listing agent
- It's been on market 119 days. Have you received any prior offers? Is the seller open to a 9% concession, seller financing, or rate buy-down credit?
- Why hasn't it sold? Are there any deal-killer items the seller is aware of (foundation, flood, title, zoning, code violations)?
- Is there a deadline driving the sale (1031 exchange, divorce, estate, relocation)? That informs how much negotiation room exists.
- Schools are F-rated, which usually means shorter tenancies and higher turnover. Who's the typical renter profile here, and what's been the actual vacancy rate?
- Crime grade is F in this area — have there been break-ins, vandalism, or insurance claims at this property in the last 3 years? What carrier currently insures it and at what premium?
- What's the average days-on-market for RENTAL listings here right now (not sales)? A rising rental-DOM trend means longer vacancies and softer asking-rent achievability than the comps imply.
- What's the recent tenant-quality profile in this submarket — average credit score on applications, eviction rate, late-payment / NSF rate, and stable-employment percentage? A property-management company in the area should have these aggregated.
- How much new for-sale + rental construction is in the pipeline within 1–3 miles? Heavy new supply typically softens prices + rents 12–24 months out; constrained supply supports both.
Investment metrics
- 1% rule
- 1.76% ✓
- Cap rate
- 14.66%
- Cash-on-cash
- 29.87%
- DSCR
- 2.33
- GRM
- 4.7
CMA / ARV
- ARV (on-the-fly)
- $200,200
- Comps found
- 3
Show comp detail 3 sales within ~0.75 mi
| Address | Dist | Beds/Ba | Sqft | Sold | Price | $/sf | Match |
|---|---|---|---|---|---|---|---|
| 4032 Mockingbird Ln #4032 | 0.04mi | 2/1.5 | 790 (+8%) | 6mo | $150,000 | $190 | 77 |
| 2164 Thrush Ave Unit - | 0.08mi | 2/1.0 | 672 (-8%) | 20mo | $185,000 | $275 | 67 |
| 2168 Thrush Ave Unit 2168j | 0.08mi | 2/1.0 | 672 (-8%) | 20mo | $189,000 | $281 | 66 |
Match score weights: distance 35% · size 25% · config 20% · recency 20%. Top-matched comps best support the ARV.
Projected returns pro-forma
-3.0% appreciation · 0.01% rent growth · sell at horizon
- IRR
- 21.0%
- Equity multiple
- 1.82×
- Total profit
- $32,312
- Equity at exit
- $20,873
- IRR
- 27.1%
- Equity multiple
- 3.05×
- Total profit
- $80,535
- Equity at exit
- $12,104
Cash invested: $39,197 (down + closing). Projections, not guarantees.
Landlord ↔ Tenant lean methodology
- Overall (STATE)
- 18 Strongly Tenant-Friendly
- State California
- 18 Strongly Tenant-Friendly · D+13
- County
- — inherits STATE
- City
- — inherits STATE
ZIP-level market 93033
- Rents YoY
- 0.0%
- Active inventory
- 31
- Price-to-rent
- 4.7×
Monthly cashflow live
- Estimated rent
- $2,460 medium interval (Pro) →
- Mortgage (P&I)
- −$734
- Tax est. 1.5%
- −$175 /mo · $2,100/yr
- Insurance
- −$58
- HOA
- −$0
- Vacancy / Maint / Mgmt
- −$517
- Net cashflow
- $976
Break-even live
UW: 25.0% down · 7.5% · 30yr · 1.5% tax · 5.0% vac · 8.0% maint · 8.0% mgmt
Financing live
Cash to close
- Down payment
- $34,998
- Closing costs
- $4,200
- Reserves months
- —
- Total cash needed
- —
Loan-product check · same deal, 3 products live
Conventional
25% down · 7.5% · 30yr
- Down + closing
- —
- Monthly P&I
- —
- Monthly cashflow
- —
- DSCR
- —
- Eligible?
- —
Personal DTI + credit; lowest rate.
DSCR
20% down · 8.5% · 30yr
- Down + closing
- —
- Monthly P&I
- —
- Monthly cashflow
- —
- DSCR
- —
- Eligible?
- —
No personal income docs; deal must DSCR.
Hard money
10% down · 12.0% · 12mo
- Down + closing
- —
- Monthly P&I
- —
- Monthly cashflow
- —
- DSCR
- —
- Eligible?
- —
Short-term bridge; refi at stabilization.
Rent comps 1 comps
| Address | Beds | Baths | Sqft | Rent | $/sqft | DOM | Units | Dist |
|---|---|---|---|---|---|---|---|---|
| 2250 E Pleasant Valley Rd Oxnard, CA | 1.0–3.0 | 1.0–2.0 | 797 | $3,115 | $3.91 | 1d | 9 | 0.19mi |
Listing history 14 events
-
2026-06-08status $139,990 Pending 119 DOM
-
2026-06-08days on market $139,990 Active Under Contract 119 DOM
-
2026-06-07days on market $139,990 Active Under Contract 118 DOM
-
2026-06-05days on market $139,990 Active Under Contract 116 DOM
-
2026-06-03days on market $139,990 Active Under Contract 114 DOM
-
2026-06-02days on market $139,990 Active Under Contract 113 DOM
-
2026-06-01days on market $139,990 Active Under Contract 112 DOM
-
2026-05-31days on market $139,990 Active Under Contract 111 DOM
-
2026-04-10price $139,990
-
2026-03-12price $149,990
-
2026-02-27price $168,000
-
2026-02-09$175,000 Active
-
2005-09-13historical
-
2005-08-23
ⓘ Source: listings_history table (triggers on properties + properties_extension) + one-shot
backfill from property_details.listing_events for pre-trigger history.
Climate risk First Street
- Flood 1/10 Low FEMA zone X (unshaded) · 0% chance over 30 yrs
- Wildfire 3/10 Moderate
- Heat 3/10 Moderate 7 d/yr ≥85°F today · 17 d/yr by 30 yrs out
- Wind 1/10 Low
- Air quality 4/10 Moderate 4 unhealthy d/yr today · 5 by 30 yrs out
Nearby sold comps map
Loading sold comps map…
Walkable amenities ~0.75 mi
Loading nearby amenities…
Taxation est. · year 1
- Rental income
- $29,516
- − Mortgage interest
- −$7,842
- − Property taxes
- −$2,100
- − Insurance
- −$700
- − Repairs & maintenance
- −$2,361
- − Management
- −$2,361
- − Depreciation
- −$4,072
- Taxable income
- $10,080
- Est. tax owed @ 24.0%
- −$2,419
- After-tax cash flow
- $9,290/yr
For passive investors: Depreciation is non-cash, so a rental often shows a tax loss while cash-flowing — sheltering income. Rental losses are passive: they offset passive income freely, and up to $25,000/yr can offset ordinary (W-2) income if you actively participate and your MAGI is under $100k (phasing out to $0 by $150k); unused losses carry forward. On sale, claimed depreciation is recaptured at up to 25%, and gains may owe capital-gains tax (a 1031 exchange can defer both). Figures are a year-1 estimate at your 24.0% rate — not tax advice; consult a CPA.
Schools (NCES district)
- District
- Oxnard Union High
- NCES district ID
- 0629270
- Math proficiency
- 28% ▲ 7.00%
- Reading proficiency
- 51% ▲ 11.00%
- Median HH income
- $68,770
- Composite
- 35.79/100
- National rank
- #4835
- State rank
- #220 of 517 in CA
Livability — Oxnard
- Score
- 54/100
- State rank
- #905
- US rank
- #24028
Category grades
Schools grade is shown separately in the Schools card above.
Census & demographics
- Census place
- Oxnard, CA
- County
- Ventura County · 829,955 people
- City population
- 213,176
- Metro
- Oxnard-Thousand Oaks-Ventura, CA
- Population (ZIP)
- 78,737
- Household income
- $87,309
- Rent vs Own
- Severe rent burden
- 1968.0
Population outlook (Ventura County) Hauer SSP2
- Today (2025)
- 895,754 people
- By 2030
- 912,134 · +1.8%
- By 2040
- 931,454 · +4.0%
- By 2050
- 934,609 · +4.3%
- By 2075
- 924,899 · +3.3%
- By 2100
- 864,712 · -3.5%
Race, ethnicity, and origin ACS 2023
- Neighborhood character
- Predominantly Hispanic (86%)
- Race & ethnicity
- Hispanic / Latino 86% Two or more races 36% Asian 7% White 5% Native American 4%
- Hispanic origin (detail)
- Mexican 82%
- Foreign-born
- 41% · Canada, Vietnam
- Languages at home
- 20% English-only · Spanish 72% Tagalog/Filipino 4%
Political lean MEDSL · Ventura
- 2024 margin
- D (+15.1) · D 56.1% · R 41.0% · Other 2.9%
- 2008→2024 swing
- +2.8pp toward D · 2008: 12.3pp · 2024: 15.1pp
- All cycles
- 2024: D+15.1 2020: D+21.1 2016: D+16.8 2012: D+5.3 2008: D+12.3
Not yet ingested
- Civics
- —
Market trends
- HPI YoY
- ▼ -824.11%
- Current HPI
- 348.9793
- Rent YoY
- ▬ 0.01%
- Metro
- Oxnard-Thousand Oaks-Ventura, CA
- State GDP YoY
- ▲ 3.21%
- F500 in state
- 116
Industry mix (Fortune 500 HQ in CA)
| Industry | F500 HQs | Revenue |
|---|---|---|
| Technology | 27 | $1,492B |
|
||
| Financial Services | 3 | $174B |
|
||
| Retail | 3 | $44B |
|
||
| Insurance | 3 | $26B |
|
||
| Media / Entertainment | 2 | $115B |
|
||
| Pharmaceuticals / Biotech | 2 | $62B |
|
||
Price history
-20.0% since first listed6 events — show timeline
- 2026-04-10 Price Changed $139,990 CSMAR
- 2026-03-12 Price Changed $149,990 CSMAR
- 2026-02-27 Price Changed $168,000 CSMAR
- 2026-02-09 Listed $175,000 CSMAR
- 2005-09-13 Delisted — CRMLS
- 2005-08-23 Listed — CRMLS
Property tax history
+5.8%/yrLatest (2025): $197 · +4.1% YoY. Source: county tax records.
Cash-flow waterfall
monthlySold comps — $/sqft
last 12 mo · ≤1 miLoading sold comps…