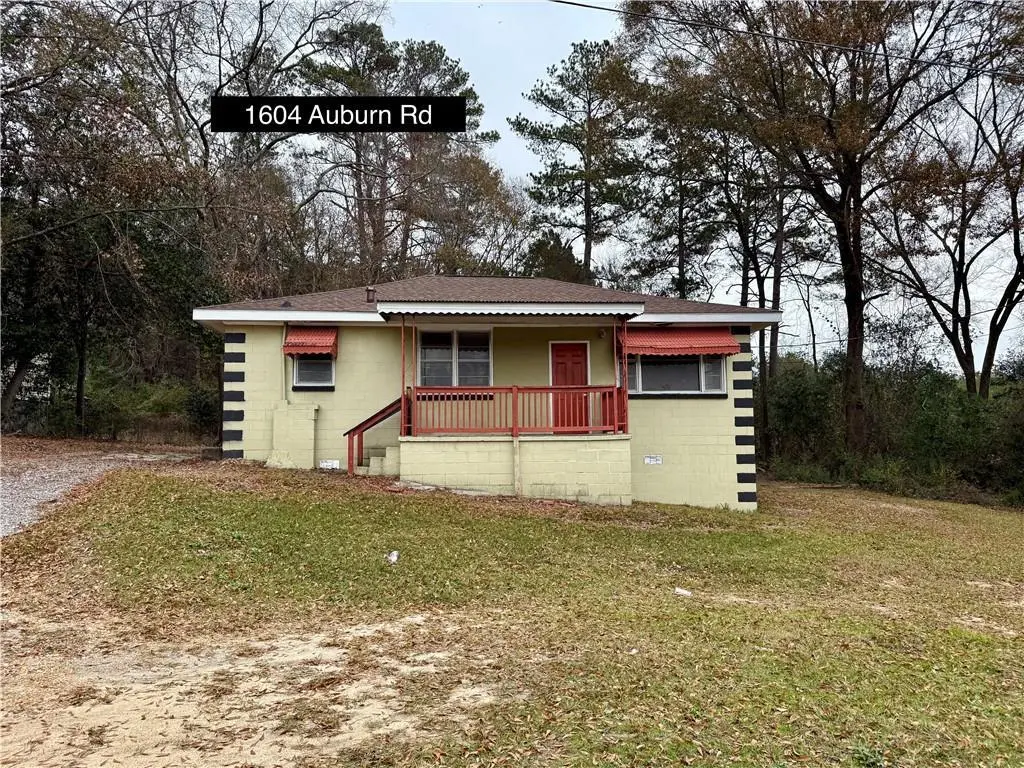
1604 Auburn Rd · Phenix City, AL
Flood risk 1/10 · Minimal
- FEMA flood zone
- X (unshaded)
- Chance of flooding over 30 yrs
- 0.0%
- Est. flood insurance / yr
- $507 – $1,088
Fire risk 4/10 · Minor
- Est. fire insurance / yr
- $916 – $1,700
Heat risk 7/10 · Major
- Hot days now (above 107°F)
- 7 days/yr
- Hot days in 30 yrs
- 19 days/yr
Wind risk 6/10 · Moderate
- Chance of severe wind over 30 yrs
- 69.0%
Air-quality risk 5/10 · Moderate
- Unhealthy air days now
- 7 days/yr
- Unhealthy air days in 30 yrs
- 8 days/yr
Risk factors via First Street. Map © Google.
Why this score? — see what drove the C grade
The composite is a weighted blend of 9 inputs, each scored 0–100. Each bar is that input's sub-score; the figure is the points it added to the 100-point composite (weight × sub-score).
- Cash flow +25.7/30.0
- DSCR +8.6/10.0
- ARV discount +7.5/15.0
- 1% rule +5.9/10.0
- Livability +3.0/5.0
- Schools +2.7/10.0
- Rent growth +2.5/5.0
- Condition / age +2.5/5.0
- Appreciation +0.0/10.0
$145,000
🖨 Deal sheet 📄 Offer letter ✓ Due diligence
Listing remarks
Welcome to 1604 Auburn Rd! This will make for a great rental property to add to your portfolio! Can be bought with several other properties or split off individually. The address are all in Phenix City and include 1705 Auburn Rd, 1604 Auburn Rd, 1015 11th Ave, 1005 11th St, & 1822 Sixth Ct. Most all have tenants in place and have been producing nearly $65,000 in rental income yearly! On top of that, 1705 Auburn Rd is already zoned commercial and is currently vacant but with a ton of interest. 1604 Auburn Rd is across the street and could pretty easily be converted to commercial as well; while being within eyesight of HWY 80. All of the HVACs are under 5 years old and most Water Heaters
Key facts
- 0.3 acre lot
- Built 1950
- Listed 79 days
Tags
Property features AI
Finance
- Other: Has a view; Paved road access; Lot dimensions approximately 186 x 70 (0.3 acres)
- Financial info: Annual tax amount provided (see listing for details)
- HOA & community: No community features
Exterior
- Parking: No on-site parking
- Utilities: Public water; Other sewer; Other utilities
- Home design: Single-family residential property; One story
- Construction: Other construction materials
- Exterior features: Other exterior features; No patio or porch; No fencing; Other roof
Interior
- Bedrooms: 2 bedrooms on the main level
- Flooring: Other flooring
- Bathrooms: 1 full bathroom (main level)
- Heating & cooling: Has heating (type: Other); Has cooling (type: Other)
- Interior features: Other interior features; No fireplace
- Laundry & utility: No laundry room/features listed; No basement
Neighborhood map
What this means for you Summary
Snapshot
- This is a 2-bed/1.0-bath single-family listed at $145k.
Deal economics
- At list price, monthly cash flow is $347 ($4k/yr) — positive.
- The deal already cash-flows at list — no discount required.
- Meets the 1% rule at list price ($2k rent vs $145k).
- Recommended offer: $136k (6.0% below list) — sets the bar for market timing.
- Cap rate 9.2% vs local median 5.0% in Phenix City — top-decile yield for the area; either an underpriced asset or a hidden risk that comps aren't pricing in. Stress-test before assuming the spread holds.
Location & tenants
- Location reads 60/100 on livability (#297 in AL) — a middle-class / working-renter tenant base. Strengths: cost of living A+, housing A+; Watch: schools D+, crime F, amenities F.
- Phenix City (suburban): math 22% / reading 44% proficiency, ranked #59 of 129 in AL (top 46%) — families likely to look elsewhere, expect single-tenant / working-renter base with shorter leases; 64% free/reduced lunch — lower-income household profile, screen leases tightly.
- Market conditions: 132 active listings in the ZIP; 2 comparable units currently listed for rent nearby; 183 units permitted in Russell County in 2024 (0 in 5+ unit buildings).
Forward outlook
- Local home prices are declining (-3.0%/yr); year-one equity from $1k of loan paydown is wiped out by about $4k of value loss. Plan a longer hold.
- Russell County population projected at +42% by 2050 — long-run rental-demand tailwind backs the buy-and-hold thesis.
Negotiation context
- It's been on market 79 days — a 6% lower offer ($136k) is reasonable based on typical stale-listing flexibility.
- 6 sale attempts since 4y ago with the ask held roughly flat each time — persistent listings suggest the price (not the market) is what's stuck; bring a comps-based counter.
- Current owner paid $31k; list at $145k implies a 369% gain — meaningful room to come down on a strong offer.
Risks & watch-outs
- Watch-outs: built in 1950 — expect roof / HVAC / electrical / plumbing capex.
- Climate carrying-cost: major wind risk, 69% chance of damaging wind over 30y; extreme-heat days projected 7→19/yr by 2055 (HVAC capex compounding) — expect insurance premiums to compound above CPI over the hold.
Questions for the listing agent
- It's been on market 79 days. Have you received any prior offers? Is the seller open to a 6% concession, seller financing, or rate buy-down credit?
- Built in 1950 — when were the roof, HVAC, electrical panel, plumbing, and water heater last replaced?
- Why hasn't it sold? Are there any deal-killer items the seller is aware of (foundation, flood, title, zoning, code violations)?
- Is there a deadline driving the sale (1031 exchange, divorce, estate, relocation)? That informs how much negotiation room exists.
- Schools are D-rated, which usually means shorter tenancies and higher turnover. Who's the typical renter profile here, and what's been the actual vacancy rate?
- Crime grade is F in this area — have there been break-ins, vandalism, or insurance claims at this property in the last 3 years? What carrier currently insures it and at what premium?
- What's the average days-on-market for RENTAL listings here right now (not sales)? A rising rental-DOM trend means longer vacancies and softer asking-rent achievability than the comps imply.
- What's the recent tenant-quality profile in this submarket — average credit score on applications, eviction rate, late-payment / NSF rate, and stable-employment percentage? A property-management company in the area should have these aggregated.
- How much new for-sale + rental construction is in the pipeline within 1–3 miles? Heavy new supply typically softens prices + rents 12–24 months out; constrained supply supports both.
Investment metrics
- 1% rule
- 1.09% ✓
- Cap rate
- 9.16%
- Cash-on-cash
- 10.26%
- DSCR
- 1.46
- GRM
- 7.7
CMA / ARV
- ARV (on-the-fly)
- $64,454
- Comps found
- 1
Show comp detail 1 sale within ~0.75 mi
| Address | Dist | Beds/Ba | Sqft | Sold | Price | $/sf | Match |
|---|---|---|---|---|---|---|---|
| 1303 Wright Rd | 0.34mi | 2/1.0 | 818 (-15%) | 10mo | $55,000 | $67 | 51 |
Match score weights: distance 35% · size 25% · config 20% · recency 20%. Top-matched comps best support the ARV.
Projected returns pro-forma
-3.0% appreciation · 3.0% rent growth · sell at horizon
- IRR
- -0.9%
- Equity multiple
- 0.96×
- Total profit
- $-1,436
- Equity at exit
- $21,620
- IRR
- 8.7%
- Equity multiple
- 1.67×
- Total profit
- $27,042
- Equity at exit
- $12,537
Cash invested: $40,600 (down + closing). Projections, not guarantees.
Landlord ↔ Tenant lean methodology
- Overall (STATE)
- 90 Strongly Landlord-Friendly
- State Alabama
- 90 Strongly Landlord-Friendly · R+15
- County
- — inherits STATE
- City
- — inherits STATE
ZIP-level market 36870
- Home prices YoY
- -10.5%
- Active inventory
- 132
- Price-to-rent
- 7.7×
Monthly cashflow live
- Estimated rent
- $1,574 medium interval (Pro) →
- Mortgage (P&I)
- −$760
- Tax from tax record
- −$76 /mo · $910/yr
- Insurance
- −$60
- HOA
- −$0
- Vacancy / Maint / Mgmt
- −$331
- Net cashflow
- $347
Break-even live
UW: 25.0% down · 7.5% · 30yr · 1.5% tax · 5.0% vac · 8.0% maint · 8.0% mgmt
Financing live
Cash to close
- Down payment
- $36,250
- Closing costs
- $4,350
- Reserves months
- —
- Total cash needed
- —
Loan-product check · same deal, 3 products live
Conventional
25% down · 7.5% · 30yr
- Down + closing
- —
- Monthly P&I
- —
- Monthly cashflow
- —
- DSCR
- —
- Eligible?
- —
Personal DTI + credit; lowest rate.
DSCR
20% down · 8.5% · 30yr
- Down + closing
- —
- Monthly P&I
- —
- Monthly cashflow
- —
- DSCR
- —
- Eligible?
- —
No personal income docs; deal must DSCR.
Hard money
10% down · 12.0% · 12mo
- Down + closing
- —
- Monthly P&I
- —
- Monthly cashflow
- —
- DSCR
- —
- Eligible?
- —
Short-term bridge; refi at stabilization.
Rent comps 2 comps
| Address | Beds | Baths | Sqft | Rent | $/sqft | DOM | Units | Dist |
|---|---|---|---|---|---|---|---|---|
| 2702 N Railroad St Phenix City, AL | 2.0 | 1.0 | 768 | $1,200 | $1.56 | 21d | 1 | 1.07mi |
| 3622 S Railroad St Phenix City, AL | 1.0–3.0 | 1.0–2.5 | 1141 | $1,536 | $1.35 | 13d | 10 | 1.49mi |
Listing history 23 events
-
2026-06-18days on market $145,000 Active 79 DOM
-
2026-06-17days on market $145,000 Active 78 DOM
-
2026-06-16days on market $145,000 Active 77 DOM
-
2026-06-15days on market $145,000 Active 76 DOM
-
2026-06-14days on market $145,000 Active 74 DOM
-
2026-06-13days on market $145,000 Active 73 DOM
-
2026-06-10days on market $145,000 Active 71 DOM
-
2026-06-09days on market $145,000 Active 70 DOM
-
2026-06-08days on market $145,000 Active 69 DOM
-
2026-06-07days on market $145,000 Active 68 DOM
-
2026-06-05days on market $145,000 Active 65 DOM
-
2026-06-02days on market $145,000 Active 63 DOM
-
2026-06-01days on market $145,000 Active 62 DOM
-
2026-05-31days on market $145,000 Active 61 DOM
-
2026-05-30days on market $145,000 Active 60 DOM
-
2026-03-31$145,000 Active
-
2025-07-09status Active
-
2025-02-19status Active
-
2025-02-12status Pending
-
2025-01-13$149,900 Active
-
2024-09-11$149,900 Active
-
2022-04-04$81,500
-
2005-07-25soldstatus $30,896
ⓘ Source: listings_history table (triggers on properties + properties_extension) + one-shot
backfill from property_details.listing_events for pre-trigger history.
Tax reassessment forecast AL · Resets to sale price
- Current annual tax
- $910 · $76/mo
- Projected year-2 tax
- $910 · $76/mo
- Expected delta
- $0/yr ($0/mo · 0.0%)
ⓘ Screening estimate from a state-policy table — verify with the county assessor before closing.
Climate risk First Street
- Flood 1/10 Low FEMA zone X (unshaded) · 0% chance over 30 yrs
- Wildfire 4/10 Moderate
- Heat 7/10 Severe 7 d/yr ≥107°F today · 19 d/yr by 30 yrs out
- Wind 6/10 Major 69% chance of damaging wind over 30 yrs
- Air quality 5/10 Major 7 unhealthy d/yr today · 8 by 30 yrs out
Nearby sold comps map
Loading sold comps map…
Walkable amenities ~0.75 mi
Loading nearby amenities…
Taxation est. · year 1
- Rental income
- $18,891
- − Mortgage interest
- −$8,122
- − Property taxes
- −$910
- − Insurance
- −$725
- − Repairs & maintenance
- −$1,511
- − Management
- −$1,511
- − Depreciation
- −$4,218
- Taxable income
- $1,893
- Est. tax owed @ 24.0%
- −$454
- After-tax cash flow
- $3,710/yr
For passive investors: Depreciation is non-cash, so a rental often shows a tax loss while cash-flowing — sheltering income. Rental losses are passive: they offset passive income freely, and up to $25,000/yr can offset ordinary (W-2) income if you actively participate and your MAGI is under $100k (phasing out to $0 by $150k); unused losses carry forward. On sale, claimed depreciation is recaptured at up to 25%, and gains may owe capital-gains tax (a 1031 exchange can defer both). Figures are a year-1 estimate at your 24.0% rate — not tax advice; consult a CPA.
Schools (NCES district)
- District
- Phenix City
- NCES district ID
- 0102700
- Math proficiency
- 22% ▼ -24.00%
- Reading proficiency
- 44% ▼ -1.00%
- Median HH income
- $36,228
- Composite
- 27.29/100
- National rank
- #7001
- State rank
- #59 of 129 in AL
Livability — Phenix City
- Score
- 60/100
- State rank
- #297
- US rank
- #19037
Category grades
Schools grade is shown separately in the Schools card above.
Census & demographics
- Census place
- Phenix City, AL
- County
- Lee County · 144,175 people
- City population
- 62,290
- Metro
- Auburn-Opelika, AL
- Population (ZIP)
- 17,951
- Household income
- $72,500
- Rent vs Own
- Severe rent burden
- 500.0
Population outlook (Russell County) Hauer SSP2
- Today (2025)
- 70,137 people
- By 2030
- 75,826 · +8.1%
- By 2040
- 87,858 · +25.3%
- By 2050
- 99,721 · +42.2%
- By 2075
- 128,009 · +82.5%
- By 2100
- 149,251 · +112.8%
Race, ethnicity, and origin ACS 2023
- Neighborhood character
- Predominantly White (72%)
- Race & ethnicity
- White 72% Black 18% Two or more races 4% Hispanic / Latino 4%
- Common ancestry
- Slovak 3% Romanian 2% Portuguese 2%
- Foreign-born
- 3% · Canada, South Korea, Jamaica
- Languages at home
- 95% English-only · Spanish 3% Korean 1%
Political lean MEDSL · Russell
- 2024 margin
- Toss-up / Even · D 50.4% · R 48.7%
- 2008→2024 swing
- -5.6pp toward R · 2008: 7.3pp · 2024: 1.7pp
- All cycles
- 2024: D+1.7 2020: D+6.4 2016: D+1.9 2012: D+11.8 2008: D+7.3
Not yet ingested
- Civics
- —
Market trends
- HPI YoY
- ▼ -28.19%
- Current HPI
- 241.1403
- Rent YoY
- —
- Metro
- Auburn-Opelika, AL
- State GDP YoY
- ▲ 2.94%
- F500 in state
- 4
Industry mix (Fortune 500 HQ in AL)
| Industry | F500 HQs | Revenue |
|---|---|---|
| Financial Services | 1 | $8B |
|
||
| Healthcare | 1 | $5B |
|
||
Price history
+369.3% since first listed8 events — show timeline
- 2026-03-31 Listed $145,000 EABOR
- 2025-07-09 Relisted — EABOR
- 2025-02-19 Relisted — EABOR
- 2025-02-12 Pending — EABOR
- 2025-01-13 Listed $149,900 EABOR
- 2024-09-11 Listed $149,900 EABOR
- 2022-04-04 Listed $81,500 EABOR
- 2005-07-25 Sold (Public Records) $30,896 Public Records
Property tax history
+7.6%/yrLatest (2025): $910 · +5.8% YoY. Source: county tax records.
Cash-flow waterfall
monthlySold comps — $/sqft
last 12 mo · ≤1 miLoading sold comps…