 Multi-family
156 S Johnson St · Newborn, GA
Flood risk 1/10 · Minimal
- FEMA flood zone
- X (unshaded)
- Chance of flooding over 30 yrs
- 0.0%
- Est. flood insurance / yr
- $507 – $1,088
Fire risk 4/10 · Minor
- Est. fire insurance / yr
- $963 – $1,789
Heat risk 6/10 · Moderate
- Hot days now (above 106°F)
- 7 days/yr
- Hot days in 30 yrs
- 17 days/yr
Wind risk 6/10 · Moderate
- Chance of severe wind over 30 yrs
- 27.0%
Air-quality risk 3/10 · Minor
- Unhealthy air days now
- 3 days/yr
- Unhealthy air days in 30 yrs
- 5 days/yr
Risk factors via First Street. Map © Google.
Why this score? — see what drove the D+ grade
The composite is a weighted blend of 9 inputs, each scored 0–100. Each bar is that input's sub-score; the figure is the points it added to the 100-point composite (weight × sub-score).
- Cash flow +18.5/30.0
- ARV discount +7.5/15.0
- DSCR +5.8/10.0
- 1% rule +4.1/10.0
- Appreciation +3.9/10.0
- Livability +3.0/5.0
- Rent growth +2.5/5.0
- Condition / age +2.5/5.0
- Schools +1.9/10.0
$1,149,000
🖨 Deal sheet 📄 Offer letter ✓ Due diligence
Multi-family units
County records classify this as Multi-Family (2-4 Unit). Listing-text estimate: 1 unit. estimate disagrees with records
Listing remarks
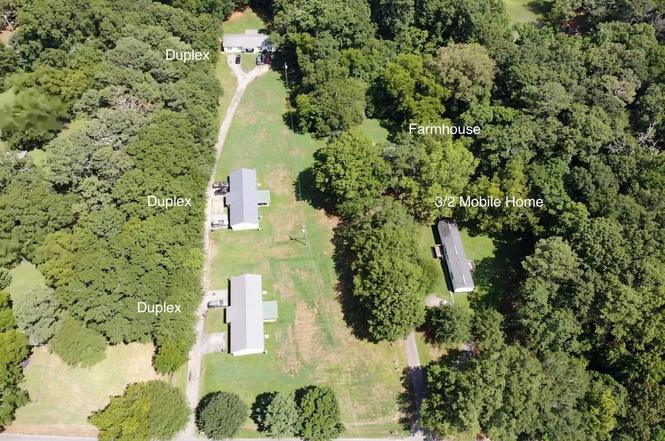
Investors Multi-family Dream with instant income potential!! 8 units total on 5 acres in downtown Newborn. 3 Duplexes (2 bedroom/1 bath), 1 Mobile Home (3 bedroom/2 bath) and 1 Farmhouse (2 bedroom/1 bath) - 17 Bedrooms & 9 Baths total. A perfect opportunity to grow your real estate portfolio! Upgrades to multiple units include new A/C, paint, LVP - call for details. ALL ARE TENANT OCCUPIED - PLEASE DO NOT DISTURB. Specific rent roll and property information is available upon request. All showings will be scheduled after accepted offer during due diligence.
Key facts
- Income potential
- Multi family
- Lvp
Tags
Property features AI
Finance
- Other: Property condition: resale; Total of 8 units
- Financial info: Listed for cash or conventional offers
- HOA & community: No HOA
Exterior
- Parking: Parking pad; Open parking available
- Utilities: Public water; Septic sewer; Electricity with individual meters
- Home design: Residential income property (multi-family); Multi-family structure; Built in 1999
- Construction: Vinyl siding and other exterior materials; Slab foundation; Built in 1999
- Exterior features: Vinyl siding; Other construction materials; Slab foundation; Approximately 4.93-acre lot; Near shopping
Interior
- Heating & cooling: Central heating; Central air conditioning (electric)
- Interior features: One level; No basement; No fireplaces
Neighborhood map
What this means for you Summary
Snapshot
- This is a 17-bed/2.0-bath multifamily listed at $1.15M.
Deal economics
- At list price, monthly cash flow is $1k ($13k/yr) — positive.
- The deal already cash-flows at list — no discount required.
- To meet the 1% rule (rent ≥ 1% of price), the offer needs to be $1.04M (9.5% below list).
- Recommended offer: $1.04M (9.5% below list) — sets the bar for 1% rule.
Location & tenants
- Location reads 59/100 on livability (#399 in GA) — a working-class tenant base; expect higher turnover. Strengths: cost of living A+, housing A+; Watch: crime C-, amenities F, commute F.
- Newton County (suburban): math 17% / reading 26% proficiency, ranked #137 of 174 in GA (top 79%) — low school quality limits family demand, transient renter base, plan for 1-2y turnover.
- Zoned schools: Mansfield Elementary School (math 47% / reading 42%, grade F, #336 of 1,228 statewide, top 29%, 391 students, 38% FRL); Indian Creek Middle School (math 18% / reading 30%, grade F, #311 of 470 statewide, top 68%, 814 students, 85% FRL); Eastside High School (math 7% / reading 17%, grade F, #342 of 424 statewide, top 81%, 1,621 students, 46% FRL) — zoned schools at 56% FRL track the district average.
- Market conditions: 16 active listings in the ZIP; 1,480 units permitted in Newton County in 2024 (702 in 5+ unit buildings).
Forward outlook
- Local home prices are declining (-2.2%/yr); year-one equity from $8k of loan paydown is wiped out by about $26k of value loss. Plan a longer hold.
- Newton County population projected at +23% by 2050 — long-run rental-demand tailwind backs the buy-and-hold thesis.
Negotiation context
- It's been on market 19 days — a 2% lower offer ($1.13M) is reasonable based on typical stale-listing flexibility.
- 6 sale attempts since 2y ago with the ask held roughly flat each time — persistent listings suggest the price (not the market) is what's stuck; bring a comps-based counter.
- Current owner paid $460k; list at $1.15M implies a 150% gain — meaningful room to come down on a strong offer.
Risks & watch-outs
- Climate carrying-cost: major wind risk, 27% chance of damaging wind over 30y; extreme-heat days projected 7→17/yr by 2055 (HVAC capex compounding) — expect insurance premiums to compound above CPI over the hold.
Questions for the listing agent
- Is there a deadline driving the sale (1031 exchange, divorce, estate, relocation)? That informs how much negotiation room exists.
- Schools are F-rated, which usually means shorter tenancies and higher turnover. Who's the typical renter profile here, and what's been the actual vacancy rate?
- The area grade is low — what's the realistic commute time and amenity access for the typical tenant pool here? Any planned neighborhood developments (good or bad) we should know about?
- What's the average days-on-market for RENTAL listings here right now (not sales)? A rising rental-DOM trend means longer vacancies and softer asking-rent achievability than the comps imply.
- What's the recent tenant-quality profile in this submarket — average credit score on applications, eviction rate, late-payment / NSF rate, and stable-employment percentage? A property-management company in the area should have these aggregated.
- How much new apartment / multifamily construction is in the pipeline within 1–3 miles? Heavy new supply (>2% of stock underway) typically softens rents 12–24 months out; light construction supports rent growth.
Investment metrics
- 1% rule
- 0.91% ✗
- Cap rate
- 7.45%
- Cash-on-cash
- 4.12%
- DSCR
- 1.18
- GRM
- 9.2
CMA / ARV
No comps found within radius.
Projected returns pro-forma
-2.25% appreciation · 3.0% rent growth · sell at horizon
- IRR
- -6.3%
- Equity multiple
- 0.75×
- Total profit
- $-79,959
- Equity at exit
- $209,949
- IRR
- 2.0%
- Equity multiple
- 1.16×
- Total profit
- $51,391
- Equity at exit
- $166,988
Cash invested: $321,720 (down + closing). Projections, not guarantees.
Landlord ↔ Tenant lean methodology
- Overall (STATE)
- 90 Strongly Landlord-Friendly
- State Georgia
- 90 Strongly Landlord-Friendly · R+3
- County
- — inherits STATE
- City
- — inherits STATE
ZIP-level market 30056
- Home prices YoY
- -0.8%
- Active inventory
- 16
- Price-to-rent
- 73.7×
Monthly cashflow live
- Estimated rent
- $10,400 medium interval (Pro) →
- Mortgage (P&I)
- −$6,025
- Tax from tax record
- −$608 /mo · $7,302/yr
- Insurance
- −$479
- HOA
- −$0
- Vacancy / Maint / Mgmt
- −$2,184
- Net cashflow
- $1,103
Break-even live
8-unit breakdown (identical units grouped — click to expand)
| Units | Beds | Baths | Est. rent |
|---|---|---|---|
| 7× units | 2 | 1 | $9,100 |
| #1 | 2 | 1 | $1,300 |
| #2 | 2 | 1 | $1,300 |
| #3 | 2 | 1 | $1,300 |
| #5 | 2 | 1 | $1,300 |
| #6 | 2 | 1 | $1,300 |
| #7 | 2 | 1 | $1,300 |
| #8 | 2 | 1 | $1,300 |
| 1× unit | 3 | 2 | $1,300 |
| Total (8 units) | $10,400 | ||
UW: 25.0% down · 7.5% · 30yr · 1.5% tax · 5.0% vac · 8.0% maint · 8.0% mgmt
Financing live
Cash to close
- Down payment
- $287,250
- Closing costs
- $34,470
- Reserves months
- —
- Total cash needed
- —
Loan-product check · same deal, 3 products live
Conventional
25% down · 7.5% · 30yr
- Down + closing
- —
- Monthly P&I
- —
- Monthly cashflow
- —
- DSCR
- —
- Eligible?
- —
Personal DTI + credit; lowest rate.
DSCR
20% down · 8.5% · 30yr
- Down + closing
- —
- Monthly P&I
- —
- Monthly cashflow
- —
- DSCR
- —
- Eligible?
- —
No personal income docs; deal must DSCR.
Hard money
10% down · 12.0% · 12mo
- Down + closing
- —
- Monthly P&I
- —
- Monthly cashflow
- —
- DSCR
- —
- Eligible?
- —
Short-term bridge; refi at stabilization.
Listing history 15 events
-
2026-06-18days on market $1,149,000 Active 19 DOM
-
2026-06-17days on market $1,149,000 Active 18 DOM
-
2026-06-16days on market $1,149,000 Active 17 DOM
-
2026-06-15statusdays on market $1,149,000 Active 16 DOM
-
2026-06-13days on market $1,149,000 New 14 DOM
-
2026-06-13days on market $1,149,000 New 13 DOM
-
2026-06-09days on market $1,149,000 New 10 DOM
-
2026-06-08days on market $1,149,000 New 9 DOM
-
2026-06-07days on market $1,149,000 New 8 DOM
-
2026-06-04days on market $1,149,000 New 5 DOM
-
2026-06-03days on market $1,149,000 New 4 DOM
-
2026-06-02days on market $1,149,000 New 3 DOM
-
2026-06-01days on market $1,149,000 New 2 DOM
-
2026-05-31remarks 565-char remark
-
2026-05-31$1,149,000 New 1 DOM
ⓘ Source: listings_history table (triggers on properties + properties_extension) + one-shot
backfill from property_details.listing_events for pre-trigger history.
Tax reassessment forecast GA · Resets to sale price
- Current annual tax
- $7,302 · $608/mo
- Projected year-2 tax
- $10,571 · $881/mo
- Expected delta
- +$3,269/yr (+$272/mo · 44.8%)
ⓘ Screening estimate from a state-policy table — verify with the county assessor before closing.
Climate risk First Street
- Flood 1/10 Low FEMA zone X (unshaded) · 0% chance over 30 yrs
- Wildfire 4/10 Moderate
- Heat 6/10 Major 7 d/yr ≥106°F today · 17 d/yr by 30 yrs out
- Wind 6/10 Major 27% chance of damaging wind over 30 yrs
- Air quality 3/10 Moderate 3 unhealthy d/yr today · 5 by 30 yrs out
Nearby sold comps map
Loading sold comps map…
Walkable amenities ~0.75 mi
Loading nearby amenities…
Taxation est. · year 1
- Rental income
- $124,800
- − Mortgage interest
- −$64,362
- − Property taxes
- −$7,302
- − Insurance
- −$5,745
- − Repairs & maintenance
- −$9,984
- − Management
- −$9,984
- − Depreciation
- −$33,425
- Taxable loss
- −$6,002
- Est. tax savings @ 24.0%
- +$1,441
- After-tax cash flow
- $14,680/yr
For passive investors: Depreciation is non-cash, so a rental often shows a tax loss while cash-flowing — sheltering income. Rental losses are passive: they offset passive income freely, and up to $25,000/yr can offset ordinary (W-2) income if you actively participate and your MAGI is under $100k (phasing out to $0 by $150k); unused losses carry forward. On sale, claimed depreciation is recaptured at up to 25%, and gains may owe capital-gains tax (a 1031 exchange can defer both). Figures are a year-1 estimate at your 24.0% rate — not tax advice; consult a CPA.
Schools (NCES district)
- District
- Newton County
- NCES district ID
- 1303930
- Math proficiency
- 17% ▼ -13.00%
- Reading proficiency
- 26% ▼ -8.00%
- Median HH income
- $50,768
- Composite
- 19.2/100
- National rank
- #8816
- State rank
- #137 of 174 in GA
Livability — Newborn
- Score
- 59/100
- State rank
- #399
- US rank
- #19747
Category grades
Schools grade is shown separately in the Schools card above.
Census & demographics
- Census place
- Newborn, GA
- Population (ZIP)
- 2,379
Population outlook (Newton County) Hauer SSP2
- Today (2025)
- 118,372 people
- By 2030
- 124,234 · +5.0%
- By 2040
- 135,550 · +14.5%
- By 2050
- 145,309 · +22.8%
- By 2075
- 166,843 · +40.9%
- By 2100
- 175,800 · +48.5%
Race, ethnicity, and origin ACS 2023
- Neighborhood character
- Predominantly White (86%)
- Race & ethnicity
- White 86% Black 8% Two or more races 4% Hispanic / Latino 2%
- Common ancestry
- Serbian 6% Slovak 1% Iranian 1%
- Foreign-born
- 2% · Canada
- Languages at home
- 98% English-only · Spanish 1%
Political lean MEDSL · Newton
- 2024 margin
- D (+15.1) · D 57.3% · R 42.2%
- 2008→2024 swing
- +14.0pp toward D · 2008: 1.2pp · 2024: 15.1pp
- All cycles
- 2024: D+15.1 2020: D+10.9 2016: D+2.4 2012: D+2.0 2008: D+1.2
Not yet ingested
- Civics
- —
Market trends
- HPI YoY
- ▼ -2.25%
- Current HPI
- 290.582
- Rent YoY
- —
- Metro
- —
- State GDP YoY
- ▲ 2.66%
- F500 in state
- 28
Industry mix (Fortune 500 HQ in GA)
| Industry | F500 HQs | Revenue |
|---|---|---|
| Paper / Packaging | 2 | $29B |
|
||
| Retail | 1 | $160B |
|
||
| Transportation / Logistics | 1 | $91B |
|
||
| Airlines | 1 | $62B |
|
||
| Consumer Goods | 1 | $47B |
|
||
| Utilities | 1 | $25B |
|
||
Price history
+274.7% since first listed13 events — show timeline
- 2025-02-28 Listing Removed — GAMLS
- 2025-01-05 Listing Removed — GAMLS
- 2024-12-16 Relisted — GAMLS
- 2024-12-15 Listing Removed — GAMLS
- 2024-11-01 Relisted — GAMLS
- 2024-10-31 Listing Removed — GAMLS
- 2024-09-03 Relisted — GAMLS
- 2024-08-31 Listing Removed — GAMLS
- 2024-07-08 Listed $1,199,000 GAMLS
- 2024-07-08 Listed $1,199,000 GAMLS
- 2024-05-31 Listed $1,149,000 GAMLS
- 2006-08-03 Sold (Public Records) $460,000 Public Records
- 2006-01-20 Sold (Public Records) $320,000 Public Records
Property tax history
+3.2%/yrLatest (2025): $7,302 · +55.3% YoY. Source: county tax records.
Cash-flow waterfall
monthlySold comps — $/sqft
last 12 mo · ≤1 miLoading sold comps…