 Duplex
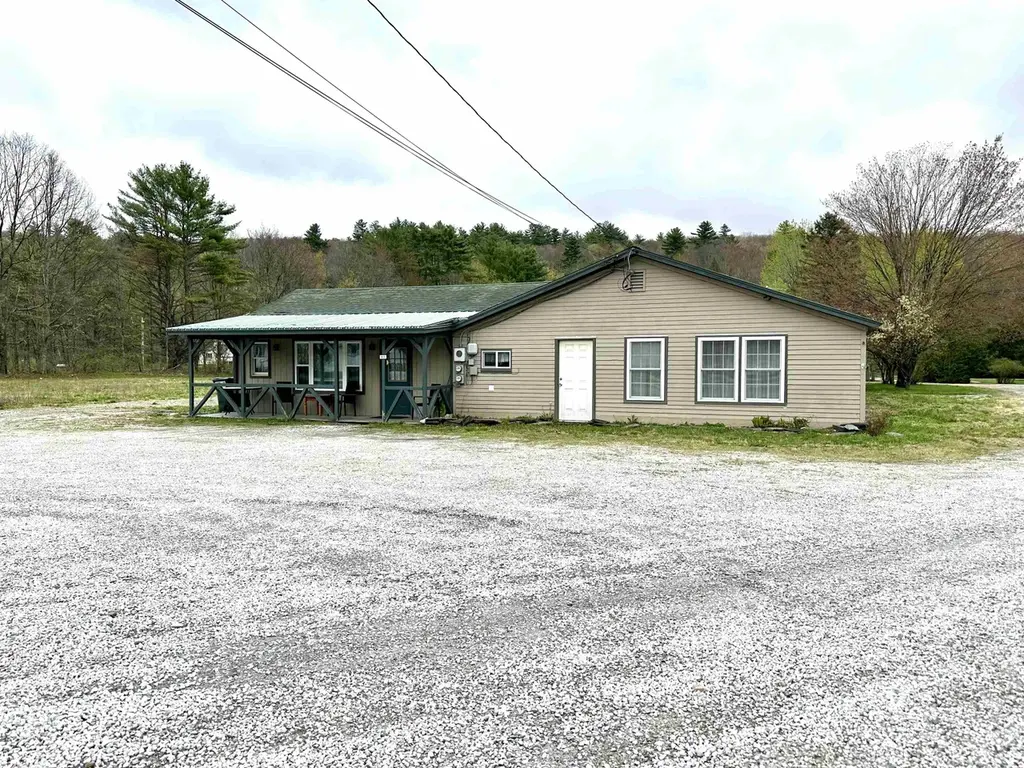
855 North St · Brandon, VT
Flood risk No data
- FEMA flood zone
- —
- Chance of flooding over 30 yrs
- —
- Est. flood insurance / yr
- —
Fire risk No data
- Est. fire insurance / yr
- —
Heat risk 2/10 · Minimal
- Hot days now (above threshold)
- 7 days/yr
- Hot days in 30 yrs
- 16 days/yr
Wind risk No data
- Chance of severe wind over 30 yrs
- —
Air-quality risk 2/10 · Minimal
- Unhealthy air days now
- 0 days/yr
- Unhealthy air days in 30 yrs
- 1 days/yr
Risk factors via First Street. Map © Google.
Why this score? — see what drove the C grade
The composite is a weighted blend of 9 inputs, each scored 0–100. Each bar is that input's sub-score; the figure is the points it added to the 100-point composite (weight × sub-score).
- Cash flow +19.0/30.0
- Appreciation +8.3/10.0
- ARV discount +7.5/15.0
- DSCR +6.0/10.0
- 1% rule +5.1/10.0
- Schools +5.0/10.0
- Livability +3.5/5.0
- Rent growth +2.5/5.0
- Condition / age +2.2/5.0
$295,000
🖨 Deal sheet (PDF) 📄 Offer letter ✓ Due diligence
Multi-family units
County records classify this as Multi-Family (2-4 Unit). Listing-text estimate: 2 units. confirmed
Listing remarks
Don’t miss this incredible investment opportunity! This property offers strong potential and room for customization or renovation. Whether you're looking to expand your portfolio or create a space to live and have a tenant help pay the mortgage, this is a rare chance to add value in the desirable town of Brandon. This former slate roof factory has been turned into two apartments with a gigantic storage area in between the two units. The front apartment has a bedroom, den, and a large open kitchen/living/dining area. Mini split helps keep the temperature just right! Washer, dryer, walk in shower all add to the ease of this one level living unit. The second apartment has a big open kitc
Key facts
- 2.29 acre lot
- 2 garage spots
- Built 1950
Property features AI
Finance
- Other: Property contains 2 total units; Approximate total finished area 2320
Exterior
- Parking: Detached 2-car garage
- Security: Smoke detector(s)
- Utilities: Public water; Septic sewer; Circuit breaker electrical service; Cable internet and phone available
- Home design: Duplex; Existing building; Grey exterior color
- Construction: Built in 1950; Wood frame construction; Corrugated metal roof
- Exterior features: Level lot with major road frontage; Gravel driveway; Public road frontage
Interior
- Kitchen: Unit 1: Dishwasher, Gas range, Refrigerator; Unit 2: Dishwasher, Electric range, Refrigerator
- Bedrooms: One 1-bedroom unit; Two 2-bedroom units
- Flooring: Vinyl flooring
- Bathrooms: Each unit has one full bathroom
- Heating & cooling: Heating options include propane, oil, hot water and wall furnace; Mini-split cooling
- Interior features: Smoke detector(s)
- Laundry & utility: Unit 1: Washer and dryer included; Unit 2: Laundry hookup; Water heater
Neighborhood map
What this means for you Summary
Snapshot
- This is a 2 × 3-bed/1.0-bath units multifamily listed at $295k. Condition is rated fair.
Deal economics
- At list price, monthly cash flow is $308 ($4k/yr) — positive. Per door: $154/mo.
- The deal already cash-flows at list — no discount required.
- Meets the 1% rule at list price ($3k rent vs $295k).
- Recommended offer: $286k (3.0% below list) — sets the bar for market timing.
Location & tenants
- Location reads 69/100 on livability (#32 in VT) — a middle-class / working-renter tenant base. Strengths: cost of living A, health & safety A, crime B+; Watch: employment D, amenities F, commute F.
- Zoned schools: Neshobe School (math 12% / reading 17%, grade F, #188 of 192 statewide, top 99%, 440 students, 34% FRL); Otter Valley Union High School (math 15% / reading 22%, grade F, #46 of 48 statewide, top 96%, 526 students, 47% FRL).
- Market conditions: 36 active listings in the ZIP; 90 units permitted in Rutland County in 2024 (0 in 5+ unit buildings).
Forward outlook
- In year one you build about $22k of equity ($2k loan paydown + $19k appreciation (6.6% local appreciation)).
- Rutland County population projected at -28% by 2050 — secular population decline; favor cash flow + early exit over multi-decade hold.
- At projected returns (6.6% appreciation + 3.0% rent growth), your $83k cash investment doubles in ~4 years — after that, you're playing with house money.
- By year 2, paydown + projected appreciation supports a ~$34k cash-out refi (75% LTV) — recoverable capital for the next deal without selling this one.
Negotiation context
- It's been on market 46 days — a 3% lower offer ($286k) is reasonable based on typical stale-listing flexibility.
Risks & watch-outs
- Watch-outs: built in 1950 — expect roof / HVAC / electrical / plumbing capex.
Questions for the listing agent
- It's been on market 46 days. Have you received any prior offers? Is the seller open to a 3% concession, seller financing, or rate buy-down credit?
- Can we see the unit-by-unit rent roll, current vacancy, and any below-market leases? What's the average tenancy length?
- What capital expenditures (roof, boiler, parking lot, exteriors) have been made in the last 5 years, and what's planned in the next 2?
- Have any recent inspections been done? Can we get a copy of the seller's disclosures and any deferred-maintenance estimates?
- Built in 1950 — when were the roof, HVAC, electrical panel, plumbing, and water heater last replaced?
- Is there a deadline driving the sale (1031 exchange, divorce, estate, relocation)? That informs how much negotiation room exists.
- Schools are F-rated, which usually means shorter tenancies and higher turnover. Who's the typical renter profile here, and what's been the actual vacancy rate?
- What's the average days-on-market for RENTAL listings here right now (not sales)? A rising rental-DOM trend means longer vacancies and softer asking-rent achievability than the comps imply.
- What's the recent tenant-quality profile in this submarket — average credit score on applications, eviction rate, late-payment / NSF rate, and stable-employment percentage? A property-management company in the area should have these aggregated.
- How much new apartment / multifamily construction is in the pipeline within 1–3 miles? Heavy new supply (>2% of stock underway) typically softens rents 12–24 months out; light construction supports rent growth.
Investment metrics
- 1% rule
- 1.01% ✓
- Cap rate
- 7.54%
- Cash-on-cash
- 4.47%
- DSCR
- 1.20
- GRM
- 8.3
CMA / ARV
No comps found within radius.
Projected returns pro-forma
6.61% appreciation · 3.0% rent growth · sell at horizon
- IRR
- 20.4%
- Equity multiple
- 2.40×
- Total profit
- $115,554
- Equity at exit
- $196,878
- IRR
- 19.4%
- Equity multiple
- 4.90×
- Total profit
- $322,205
- Equity at exit
- $367,337
Cash invested: $82,600 (down + closing). Projections, not guarantees.
Landlord ↔ Tenant lean methodology
- Overall (STATE)
- 41 Moderately Tenant-Leaning
- State Vermont
- 41 Moderately Tenant-Leaning · D+15
- County
- — inherits STATE
- City
- — inherits STATE
ZIP-level market 05733
- Home prices YoY
- 2.1%
- Active inventory
- 36
- Price-to-rent
- 16.6×
Monthly cashflow live
- Estimated rent
- $2,970 medium interval (Pro) →
- Mortgage (P&I)
- −$1,547
- Tax est. 1.5%
- −$369 /mo · $4,425/yr
- Insurance
- −$123
- HOA
- −$0
- Vacancy / Maint / Mgmt
- −$624
- Net cashflow
- $308
Break-even live
Sensitivity live
| Price | -10% $511 | -5% $410 | +0% $308 | +5% $206 | +10% $104 |
|---|---|---|---|---|---|
| Rent | -10% $73 | -5% $190 | +0% $308 | +5% $425 | +10% $542 |
| Rate | -1.0pp $456 | -0.5pp $383 | base $308 | +0.5pp $231 | +1.0pp $153 |
2-unit breakdown (identical units grouped — click to expand)
| Units | Beds | Baths | Est. rent |
|---|---|---|---|
| 2× units | 3 | 1 | $2,970 |
| #1 | 3 | 1 | $1,485 |
| #2 | 3 | 1 | $1,485 |
| Total (2 units) | $2,970 | ||
UW: 25.0% down · 7.5% · 30yr · 1.5% tax · 5.0% vac · 8.0% maint · 8.0% mgmt
Financing live
Cash to close
- Down payment
- $73,750
- Closing costs
- $8,850
- Reserves months
- —
- Total cash needed
- —
Loan-product check · same deal, 3 products live
Conventional
25% down · 7.5% · 30yr
- Down + closing
- —
- Monthly P&I
- —
- Monthly cashflow
- —
- DSCR
- —
- Eligible?
- —
Personal DTI + credit; lowest rate.
DSCR
20% down · 8.5% · 30yr
- Down + closing
- —
- Monthly P&I
- —
- Monthly cashflow
- —
- DSCR
- —
- Eligible?
- —
No personal income docs; deal must DSCR.
Hard money
10% down · 12.0% · 12mo
- Down + closing
- —
- Monthly P&I
- —
- Monthly cashflow
- —
- DSCR
- —
- Eligible?
- —
Short-term bridge; refi at stabilization.
Listing history 18 events
-
2026-06-21days on market $295,000 Active 46 DOM
-
2026-06-21days on market $295,000 Active 45 DOM
-
2026-06-18days on market $295,000 Active 43 DOM
-
2026-06-17days on market $295,000 Active 42 DOM
-
2026-06-16days on market $295,000 Active 41 DOM
-
2026-06-15days on market $295,000 Active 40 DOM
-
2026-06-15days on market $295,000 Active 39 DOM
-
2026-06-13days on market $295,000 Active 38 DOM
-
2026-06-12days on market $295,000 Active 37 DOM
-
2026-06-09days on market $295,000 Active 34 DOM
-
2026-06-08days on market $295,000 Active 33 DOM
-
2026-06-08days on market $295,000 Active 32 DOM
-
2026-06-07days on market $295,000 Active 31 DOM
-
2026-06-03days on market $295,000 Active 28 DOM
-
2026-06-02days on market $295,000 Active 27 DOM
-
2026-06-01days on market $295,000 Active 26 DOM
-
2026-05-31days on market $295,000 Active 25 DOM
-
2026-05-05$295,000 Active
ⓘ Source: listings_history table (triggers on properties + properties_extension) + one-shot
backfill from property_details.listing_events for pre-trigger history.
Climate risk First Street
- Heat 2/10 Low
- Air quality 2/10 Low 0 unhealthy d/yr today · 1 by 30 yrs out
Nearby sold comps map
Loading sold comps map…
Walkable amenities ~0.75 mi
Loading nearby amenities…
Taxation est. · year 1
- Rental income
- $35,640
- − Mortgage interest
- −$16,525
- − Property taxes
- −$4,425
- − Insurance
- −$1,475
- − Repairs & maintenance
- −$2,851
- − Management
- −$2,851
- − Depreciation
- −$8,582
- Taxable loss
- −$1,069
- Est. tax savings @ 24.0%
- +$257
- After-tax cash flow
- $3,948/yr
For passive investors: Depreciation is non-cash, so a rental often shows a tax loss while cash-flowing — sheltering income. Rental losses are passive: they offset passive income freely, and up to $25,000/yr can offset ordinary (W-2) income if you actively participate and your MAGI is under $100k (phasing out to $0 by $150k); unused losses carry forward. On sale, claimed depreciation is recaptured at up to 25%, and gains may owe capital-gains tax (a 1031 exchange can defer both). Figures are a year-1 estimate at your 24.0% rate — not tax advice; consult a CPA.
Condition & rehab AI · 14 photos
This multi-family property requires significant repairs to the roof and exterior siding, but has potential for increased value through these improvements.
Repairs flagged
- Major roof — The roof appears to be in poor condition, with visible wear and tear.
- Major exterior siding — The exterior siding appears to be in poor condition, with visible wear and tear.
Value-add opportunities
- Both New roof — A new roof would significantly improve the home's appearance and increase its value for both resale and rental.
- Both New exterior siding — New siding would improve the home's appearance and increase its value for both resale and rental.
Renovation cost estimate screening
| Repair item | Severity | Est. cost |
|---|---|---|
| roof · The roof appears to be in poor condition, with visible wear and tear. | Major | $15,000–50,000 |
| exterior siding · The exterior siding appears to be in poor condition, with visible wear and tear. | Major | $15,000–50,000 |
| Total estimated repair cost · 2 items | $30,000–100,000 |
Value-add ROI direction
- Both New roof — A new roof would significantly improve the home's appearance and increase its value for both resale and rental. ↑
- Both New exterior siding — New siding would improve the home's appearance and increase its value for both resale and rental. ↑
ⓘ Cost ranges are severity-bucket heuristics (US national rule-of-thumb). Get contractor quotes + a written scope before underwriting a rehab budget.
Schools (NCES district)
No district data.
Livability — Brandon
- Score
- 69/100
- State rank
- #32
- US rank
- #8474
Category grades
Schools grade is shown separately in the Schools card above.
Census & demographics
- City population
- 5,970
- Population (ZIP)
- 5,970
Population outlook (Rutland County) Hauer SSP2
- Today (2025)
- 55,307 people
- By 2030
- 52,364 · -5.3%
- By 2040
- 45,751 · -17.3%
- By 2050
- 39,627 · -28.4%
- By 2075
- 29,080 · -47.4%
- By 2100
- 20,673 · -62.6%
Race, ethnicity, and origin ACS 2023
- Neighborhood character
- Predominantly White (92%)
- Race & ethnicity
- White 92% Two or more races 5% Hispanic / Latino 2%
- Common ancestry
- Slovak 8% Lithuanian 8% Romanian 2%
- Foreign-born
- 3% · China, Canada
- Languages at home
- 96% English-only · Tagalog/Filipino 1% Other Indo-European 1% Spanish 1%
Political lean MEDSL · Rutland
- 2024 margin
- Lean D (+5.3) · D 51.3% · R 46.0% · Other 2.7%
- 2008→2024 swing
- -19.3pp toward R · 2008: 24.6pp · 2024: 5.3pp
- All cycles
- 2024: D+5.3 2020: D+10.5 2016: D+4.2 2012: D+22.0 2008: D+24.6
Not yet ingested
- Civics
- —
Market trends
- HPI YoY
- ▲ 6.61%
- Current HPI
- 325.517
- Rent YoY
- —
- Metro
- —
- State GDP YoY
- —
- F500 in state
- 0
Price history
1 event — show timeline
- 2026-05-05 Listed $295,000 PrimeMLS
Cash-flow waterfall
monthlySold comps — $/sqft
last 12 mo · ≤1 miLoading sold comps…