 🏷️ Likely Rental
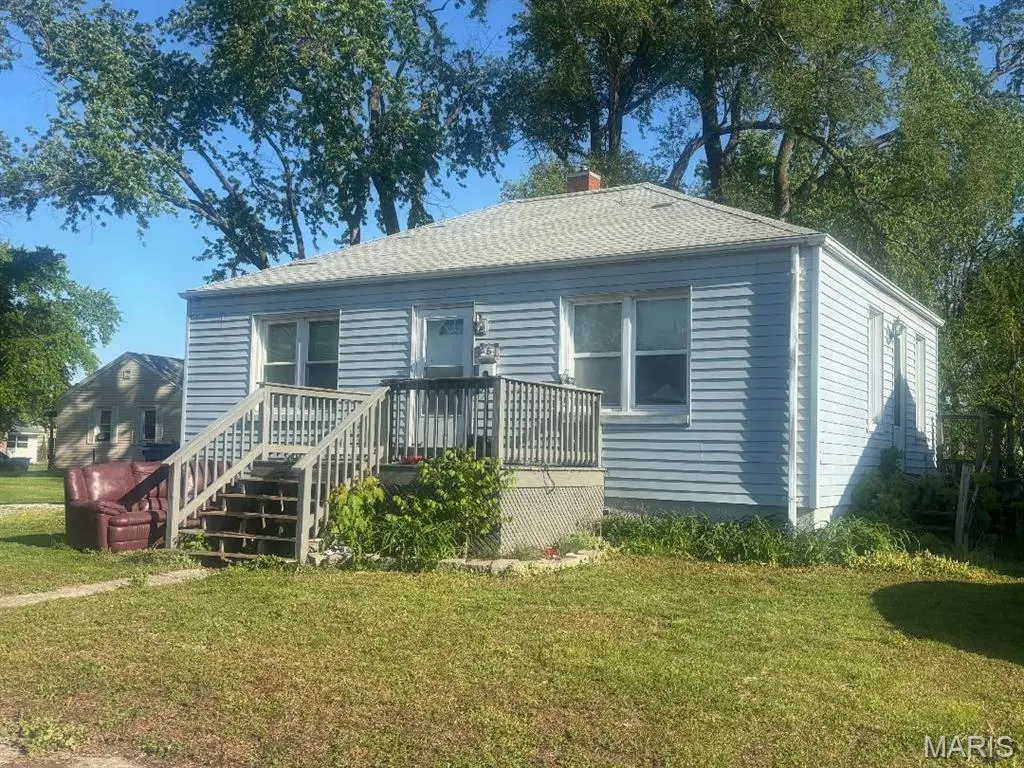
261 Victory Dr · East Alton, IL
Flood risk 1/10 · Minimal
- FEMA flood zone
- X
- Chance of flooding over 30 yrs
- 0.0%
- Est. flood insurance / yr
- $473 – $860
Fire risk 1/10 · Minimal
- Est. fire insurance / yr
- $804 – $1,492
Heat risk 5/10 · Moderate
- Hot days now (above 106°F)
- 7 days/yr
- Hot days in 30 yrs
- 20 days/yr
Wind risk 2/10 · Minimal
- Chance of severe wind over 30 yrs
- 1.0%
Air-quality risk 3/10 · Minor
- Unhealthy air days now
- 2 days/yr
- Unhealthy air days in 30 yrs
- 4 days/yr
Risk factors via First Street. Map © Google.
Why this score? — see what drove the B+ grade
The composite is a weighted blend of 9 inputs, each scored 0–100. Each bar is that input's sub-score; the figure is the points it added to the 100-point composite (weight × sub-score).
- Cash flow +30.0/30.0
- ARV discount +15.0/15.0
- 1% rule +10.0/10.0
- DSCR +10.0/10.0
- Livability +3.5/5.0
- Rent growth +2.5/5.0
- Condition / age +2.5/5.0
- Schools +1.6/10.0
- Appreciation +0.0/10.0
$49,900
🖨 Deal sheet 📄 Offer letter ✓ Due diligence
Listing remarks
2-bedroom, 1-bath home with a spacious extra lot offering plenty of room for expansion, gardening, or outdoor activities. The property needs some TLC, making it a great opportunity for buyers looking to downsize and customize their next home—or for investors seeking their next project. Solid bones, flexible layout, and tons of potential Being sold as-is seller to make no repairs nor provide occupancy (parcel ID# 19-2-08-21-05-104-014 included) Tenant Occupied- 24 Hour Notice Required
Key facts
- 0.34 acre lot
- Built 1945
- Listed 58 days
Property features AI
Finance
- Other: Living area reported as 768 (source: public records); Lot size about 0.3361 acres
- Financial info: Lease not considered
- HOA & community: No HOA details provided
Exterior
- Parking: No parking details provided
- Security: No security details provided
- Utilities: Public water; Public sewer; Electricity connected
- Home design: Single-family residence; One story; Residential property
- Construction: Vinyl siding; Unfinished basement; Basement present; Built details not provided
- Exterior features: Level lot
Interior
- Kitchen: No kitchen appliance details provided
- Bedrooms: 2 bedrooms on the main level
- Flooring: No flooring details provided
- Bathrooms: 1 full bath on the main level
- Heating & cooling: Forced air heating; Central air conditioning; Ceiling fan(s)
- Interior features: Fireplace (1)
- Laundry & utility: No laundry or utility appliance details provided
Neighborhood map
What this means for you Summary
Snapshot
- This is a 2-bed/1.0-bath single-family listed at $50k.
Deal economics
- At list price, monthly cash flow is $425 ($5k/yr) — positive.
- The deal already cash-flows at list — no discount required.
- Meets the 1% rule at list price ($1k rent vs $50k).
- Recommended offer: $48k (3.0% below list) — sets the bar for market timing.
Location & tenants
- Location reads 69/100 on livability (#418 in IL) — a middle-class / working-renter tenant base. Strengths: cost of living A+, housing A+; Watch: commute D+, crime D, amenities F.
- East Alton-Wood River Chsd 14 (suburban): math 10% / reading 20% proficiency, ranked #793 of 919 in IL (top 86%) — low school quality limits family demand, transient renter base, plan for 1-2y turnover.
- Zoned schools: East Alton-Wood River High Sch (math 8% / reading 12%, grade F, #567 of 693 statewide, top 83%, 537 students, 0% FRL).
- Market conditions: 38 active listings in the ZIP; 9 comparable units currently listed for rent nearby; rentals leasing fast (median 5d on market — plan ~1-2 weeks tenant-placement turnaround); 336 units permitted in Madison County in 2024 (0 in 5+ unit buildings).
Forward outlook
- Local home prices are declining (-3.0%/yr); year-one equity from $345 of loan paydown is wiped out by about $1k of value loss. Plan a longer hold.
- Madison County population projected at -18% by 2050 — secular population decline; favor cash flow + early exit over multi-decade hold.
- At projected returns (-3.0% appreciation + 3.0% rent growth), your $14k cash investment doubles in ~4 years — after that, you're playing with house money.
Negotiation context
- It's been on market 59 days — a 3% lower offer ($48k) is reasonable based on typical stale-listing flexibility.
Risks & watch-outs
- Watch-outs: built in 1945 — expect roof / HVAC / electrical / plumbing capex.
- Climate carrying-cost: extreme-heat days projected 7→20/yr by 2055 (HVAC capex compounding) — expect insurance premiums to compound above CPI over the hold.
Questions for the listing agent
- It's been on market 59 days. Have you received any prior offers? Is the seller open to a 3% concession, seller financing, or rate buy-down credit?
- Built in 1945 — when were the roof, HVAC, electrical panel, plumbing, and water heater last replaced?
- Is there a deadline driving the sale (1031 exchange, divorce, estate, relocation)? That informs how much negotiation room exists.
- Schools are F-rated, which usually means shorter tenancies and higher turnover. Who's the typical renter profile here, and what's been the actual vacancy rate?
- Crime grade is D in this area — have there been break-ins, vandalism, or insurance claims at this property in the last 3 years? What carrier currently insures it and at what premium?
- What's the average days-on-market for RENTAL listings here right now (not sales)? A rising rental-DOM trend means longer vacancies and softer asking-rent achievability than the comps imply.
- What's the recent tenant-quality profile in this submarket — average credit score on applications, eviction rate, late-payment / NSF rate, and stable-employment percentage? A property-management company in the area should have these aggregated.
- How much new for-sale + rental construction is in the pipeline within 1–3 miles? Heavy new supply typically softens prices + rents 12–24 months out; constrained supply supports both.
Investment metrics
- 1% rule
- 2.05% ✓
- Cap rate
- 16.51%
- Cash-on-cash
- 36.50%
- DSCR
- 2.62
- GRM
- 4.1
CMA / ARV
- ARV (on-the-fly)
- $82,176
- Comps found
- 12
Show comp detail 12 sales within ~0.75 mi
| Address | Dist | Beds/Ba | Sqft | Sold | Price | $/sf | Match |
|---|---|---|---|---|---|---|---|
| 100 Bonds Ave | 0.18mi | 2/1.0 | 768 (0%) | 11mo | $79,000 | $103 | 82 |
| 109 S Shamrock St | 0.27mi | 2/1.0 | 820 (+7%) | 4mo | $55,000 | $67 | 73 |
| 111 Irwin St | 0.24mi | 2/1.0 | 816 (+6%) | 8mo | $109,900 | $135 | 72 |
| 144 Victory Dr | 0.13mi | 2/1.0 | 696 (-9%) | 12mo | $44,900 | $65 | 68 |
| 104 Irwin St | 0.16mi | 2/1.0 | 864 (+12%) | 8mo | $92,500 | $107 | 65 |
| 835 Rice St | 0.68mi | 2/1.0 | 748 (-3%) | 4mo | $52,000 | $70 | 60 |
| 108 Charlene St | 0.27mi | 3/1.0 (+1) | 864 (+12%) | 2mo | $94,900 | $110 | 60 |
| 116 Charlene St | 0.29mi | 2/1.0 | 864 (+12%) | 11mo | $95,000 | $110 | 57 |
| 405 Niagara St | 0.55mi | 2/1.0 | 700 (-9%) | 4mo | $59,000 | $84 | 56 |
| 833 State St | 0.62mi | 2/1.0 | 720 (-6%) | 6mo | $107,000 | $149 | 56 |
| 148 Park Ave | 0.60mi | 2/1.0 | 728 (-5%) | 10mo | $121,400 | $167 | 55 |
| 223 Kingshighway | 0.37mi | 2/1.0 | 660 (-14%) | 12mo | $50,000 | $76 | 49 |
Match score weights: distance 35% · size 25% · config 20% · recency 20%. Top-matched comps best support the ARV.
Projected returns pro-forma
-3.0% appreciation · 3.0% rent growth · sell at horizon
- IRR
- 32.3%
- Equity multiple
- 2.36×
- Total profit
- $19,017
- Equity at exit
- $7,440
- IRR
- 39.4%
- Equity multiple
- 4.69×
- Total profit
- $51,565
- Equity at exit
- $4,314
Cash invested: $13,972 (down + closing). Projections, not guarantees.
Landlord ↔ Tenant lean methodology
- Overall (STATE)
- 43 Moderately Tenant-Leaning
- State Illinois
- 43 Moderately Tenant-Leaning · D+7
- County
- — inherits STATE
- City
- — inherits STATE
ZIP-level market 62024
- Home prices YoY
- -18.8%
- Active inventory
- 38
- Price-to-rent
- 4.1×
Monthly cashflow live
- Estimated rent
- $1,020 high interval (Pro) →
- Mortgage (P&I)
- −$262
- Tax from tax record
- −$99 /mo · $1,185/yr
- Insurance
- −$21
- HOA
- −$0
- Vacancy / Maint / Mgmt
- −$214
- Net cashflow
- $425
Break-even live
UW: 25.0% down · 7.5% · 30yr · 1.5% tax · 5.0% vac · 8.0% maint · 8.0% mgmt
Financing live
Cash to close
- Down payment
- $12,475
- Closing costs
- $1,497
- Reserves months
- —
- Total cash needed
- —
Loan-product check · same deal, 3 products live
Conventional
25% down · 7.5% · 30yr
- Down + closing
- —
- Monthly P&I
- —
- Monthly cashflow
- —
- DSCR
- —
- Eligible?
- —
Personal DTI + credit; lowest rate.
DSCR
20% down · 8.5% · 30yr
- Down + closing
- —
- Monthly P&I
- —
- Monthly cashflow
- —
- DSCR
- —
- Eligible?
- —
No personal income docs; deal must DSCR.
Hard money
10% down · 12.0% · 12mo
- Down + closing
- —
- Monthly P&I
- —
- Monthly cashflow
- —
- DSCR
- —
- Eligible?
- —
Short-term bridge; refi at stabilization.
Rent comps 9 comps
| Address | Beds | Baths | Sqft | Rent | $/sqft | DOM | Units | Dist |
|---|---|---|---|---|---|---|---|---|
| 176 S Pence St East Alton, IL | 2.0 | 1.0 | 1000 | $1,100 | $1.10 | 2d | 1 | 0.28mi |
| 123 Irwin St East Alton, IL | 2.0 | 1.0 | 792 | $1,225 | $1.55 | 4d | 1 | 0.31mi |
| 806 Center St East Alton, IL | 1.0 | 1.0 | 620 | $675 | $1.09 | 2d | 1 | 0.59mi |
| 140 Illinois St East Alton, IL | 2.0 | 1.0 | 960 | $695 | $0.72 | 2d | 1 | 0.79mi |
| 120 Lakeside Ave East Alton, IL | 2.0 | 1.0 | 700 | $850 | $1.21 | 11d | 1 | 0.90mi |
| 134 Lakeside Ave East Alton, IL | 2.0 | 1.0 | 800 | $775 | $0.97 | 11d | 1 | 0.91mi |
| 121 Cardot St East Alton, IL | 3.0 | 1.0 | 937 | $1,200 | $1.28 | 22d | 1 | 1.12mi |
| 226 E Lorena Ave Wood River, IL | 1.0 | 1.0 | 615 | $1,150 | $1.87 | 2d | 1 | 1.42mi |
| 3400 Milton Dr Alton, IL | 2.0 | 1.5 | 972 | $1,350 | $1.39 | 4d | 1 | 1.48mi |
Listing history 19 events
-
2026-06-18days on market $49,900 Active 59 DOM
-
2026-06-17days on market $49,900 Active 58 DOM
-
2026-06-16days on market $49,900 Active 57 DOM
-
2026-06-15days on market $49,900 Active 56 DOM
-
2026-06-13days on market $49,900 Active 54 DOM
-
2026-06-12days on market $49,900 Active 53 DOM
-
2026-06-09days on market $49,900 Active 50 DOM
-
2026-06-08days on market $49,900 Active 49 DOM
-
2026-06-07days on market $49,900 Active 48 DOM
-
2026-06-05days on market $49,900 Active 46 DOM
-
2026-06-03days on market $49,900 Active 44 DOM
-
2026-06-02days on market $49,900 Active 43 DOM
-
2026-06-01days on market $49,900 Active 42 DOM
-
2026-05-31days on market $49,900 Active 41 DOM
-
2026-05-07price $49,900
-
2026-04-21$58,900 Active
-
2026-04-20historical $58,900
-
2004-02-02soldstatus $58,000
-
2004-02-02soldstatus $58,000
ⓘ Source: listings_history table (triggers on properties + properties_extension) + one-shot
backfill from property_details.listing_events for pre-trigger history.
Tax reassessment forecast IL · Partial reset (capped growth)
- Current annual tax
- $1,185 · $99/mo
- Projected year-2 tax
- $1,185 · $99/mo
- Expected delta
- $0/yr ($0/mo · 0.0%)
ⓘ Screening estimate from a state-policy table — verify with the county assessor before closing.
Climate risk First Street
- Flood 1/10 Low FEMA zone X · 0% chance over 30 yrs
- Wildfire 1/10 Low
- Heat 5/10 Major 7 d/yr ≥106°F today · 20 d/yr by 30 yrs out
- Wind 2/10 Low 100% chance of damaging wind over 30 yrs
- Air quality 3/10 Moderate 2 unhealthy d/yr today · 4 by 30 yrs out
Nearby sold comps map
Loading sold comps map…
Walkable amenities ~0.75 mi
Loading nearby amenities…
Taxation est. · year 1
- Rental income
- $12,246
- − Mortgage interest
- −$2,795
- − Property taxes
- −$1,185
- − Insurance
- −$250
- − Repairs & maintenance
- −$980
- − Management
- −$980
- − Depreciation
- −$1,452
- Taxable income
- $4,605
- Est. tax owed @ 24.0%
- −$1,105
- After-tax cash flow
- $3,994/yr
For passive investors: Depreciation is non-cash, so a rental often shows a tax loss while cash-flowing — sheltering income. Rental losses are passive: they offset passive income freely, and up to $25,000/yr can offset ordinary (W-2) income if you actively participate and your MAGI is under $100k (phasing out to $0 by $150k); unused losses carry forward. On sale, claimed depreciation is recaptured at up to 25%, and gains may owe capital-gains tax (a 1031 exchange can defer both). Figures are a year-1 estimate at your 24.0% rate — not tax advice; consult a CPA.
Schools (NCES district)
- District
- East Alton-Wood River Chsd 14
- NCES district ID
- 1712990
- Math proficiency
- 10% ▬ 0.00%
- Reading proficiency
- 20% ▬ 0.00%
- Median HH income
- $35,977
- Composite
- 15.86/100
- National rank
- #14315
- State rank
- #793 of 919 in IL
Livability — East Alton
- Score
- 69/100
- State rank
- #418
- US rank
- #8569
Category grades
Schools grade is shown separately in the Schools card above.
Census & demographics
- Census place
- East Alton, IL
- City population
- 9,465
- Population (ZIP)
- 9,465
Population outlook (Madison County) Hauer SSP2
- Today (2025)
- 258,371 people
- By 2030
- 251,523 · -2.7%
- By 2040
- 233,640 · -9.6%
- By 2050
- 213,042 · -17.5%
- By 2075
- 165,255 · -36.0%
- By 2100
- 123,953 · -52.0%
Race, ethnicity, and origin ACS 2023
- Neighborhood character
- Predominantly White (93%)
- Race & ethnicity
- White 93% Two or more races 5% Hispanic / Latino 2% Black 1%
- Common ancestry
- Lithuanian 4% Iranian 2% Italian 1%
- Foreign-born
- 0%
Political lean MEDSL · Madison
- 2024 margin
- R (+13.3) · D 42.5% · R 55.8% · Other 1.8%
- 2008→2024 swing
- -22.5pp toward R · 2008: 9.2pp · 2024: -13.3pp
- All cycles
- 2024: R+13.3 2020: R+13.2 2016: R+15.6 2012: R+1.4 2008: D+9.2
Not yet ingested
- Civics
- —
Market trends
- HPI YoY
- ▼ -50.18%
- Current HPI
- 216.1273
- Rent YoY
- —
- Metro
- —
- State GDP YoY
- ▲ 1.59%
- F500 in state
- 60
Industry mix (Fortune 500 HQ in IL)
| Industry | F500 HQs | Revenue |
|---|---|---|
| Insurance | 4 | $201B |
|
||
| Consumer Goods | 4 | $87B |
|
||
| Industrial Machinery | 3 | $64B |
|
||
| Healthcare | 2 | $55B |
|
||
| Retail / Pharmacy | 1 | $148B |
|
||
| Agriculture / Food | 1 | $86B |
|
||
Price history
-14.0% since first listed5 events — show timeline
- 2026-05-07 Price Changed $49,900 MARIS as Distributed by MLS Grid
- 2026-04-21 Listed $58,900 MARIS as Distributed by MLS Grid
- 2026-04-20 Coming Soon $58,900 MARIS as Distributed by MLS Grid
- 2004-02-02 Sold (Public Records) $58,000 Public Records
- 2004-02-02 Sold (Public Records) $58,000 Public Records
Property tax history
+4.7%/yrLatest (2024): $1,185 · +9.4% YoY. Source: county tax records.
Cash-flow waterfall
monthlySold comps — $/sqft
last 12 mo · ≤1 miLoading sold comps…