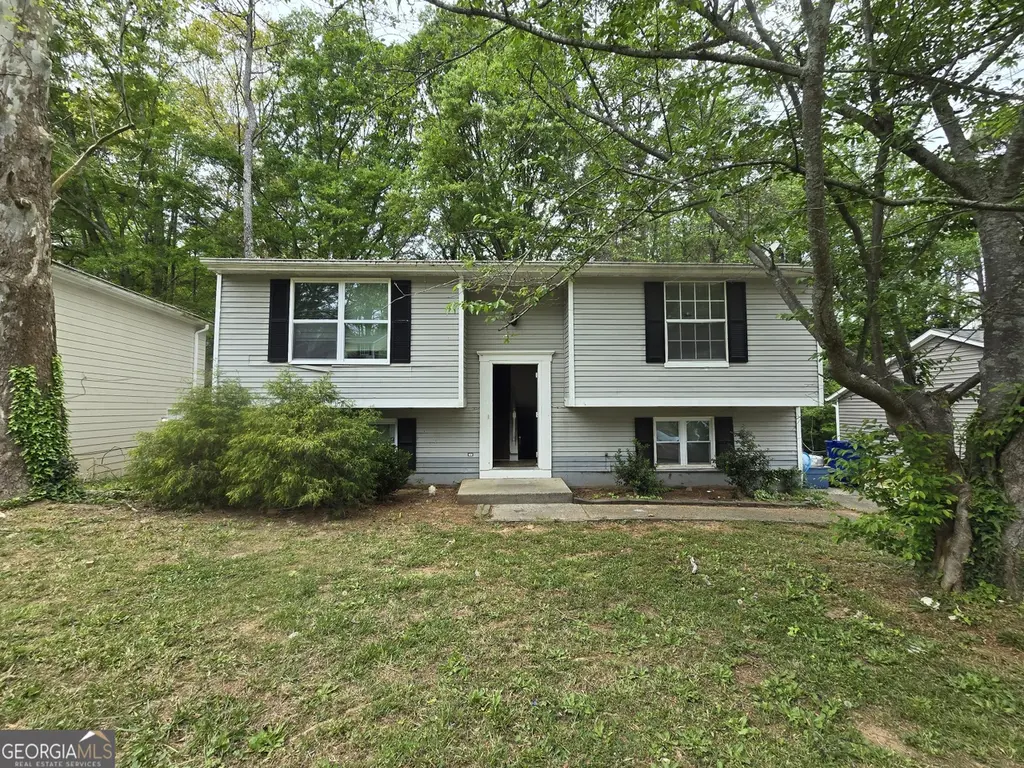
2075 Countydown Ln · Redan, GA
Flood risk 1/10 · Minimal
- FEMA flood zone
- X (unshaded)
- Chance of flooding over 30 yrs
- 0.0%
- Est. flood insurance / yr
- $507 – $1,088
Fire risk 1/10 · Minimal
- Est. fire insurance / yr
- $963 – $1,789
Heat risk 5/10 · Moderate
- Hot days now (above 105°F)
- 7 days/yr
- Hot days in 30 yrs
- 18 days/yr
Wind risk 5/10 · Moderate
- Chance of severe wind over 30 yrs
- 26.0%
Air-quality risk 5/10 · Moderate
- Unhealthy air days now
- 7 days/yr
- Unhealthy air days in 30 yrs
- 10 days/yr
Risk factors via First Street. Map © Google.
Why this score? — see what drove the C grade
The composite is a weighted blend of 9 inputs, each scored 0–100. Each bar is that input's sub-score; the figure is the points it added to the 100-point composite (weight × sub-score).
- Cash flow +19.8/30.0
- ARV discount +15.0/15.0
- DSCR +6.3/10.0
- 1% rule +6.2/10.0
- Rent growth +3.4/5.0
- Livability +3.2/5.0
- Condition / age +2.5/5.0
- Schools +2.1/10.0
- Appreciation +0.0/10.0
$184,900
🖨 Deal sheet 📄 Offer letter ✓ Due diligence
Listing remarks MLS
COMPLETE RENOVATION,PLENTY OF SPACE! KITCHEN W/NEW CABINETS,TILE BKSPLASH, CTRS & NEW APPL. FRESH PAINT INSIDE/OUT. NEW FLOORING/CARPET,CERAMIC TILE & HDWDS. SPLIT BDRM PLAN. LR/DR OPEN TO KIT ON MAIN LEVEL,GREAT RM & LG LAUNDRY RM ON LOWER LEVEL. WOODED BKYD W/DECK
Key facts
- 6,969 sq ft lot
- Built 1980
- Listed 47 days
Property features AI
Finance
- Other: Lot size approximately 0.16 acres; Listing accepts Cash, Conventional, FHA, and VA financing
- HOA & community: Homeowners association with $200 monthly fee (fee covers other community items)
Exterior
- Parking: Off-street parking
- Utilities: Public water; Public sewer; Cable available; Electricity available; High-speed internet available; Natural gas available
- Home design: Single-family residential house; Resale property; Built in 1980
- Construction: Block and brick construction; Composition roof; Slab foundation
- Exterior features: Level lot
Interior
- Kitchen: Dishwasher; Refrigerator
- Bedrooms: 4 bedrooms total (1 bedroom on lower level)
- Flooring: Carpet; Laminate; Vinyl
- Bathrooms: 2 full bathrooms
- Heating & cooling: Heat pump heating; Ceiling fan(s) for cooling
- Interior features: Multi/split levels; Wood-burning fireplace (1)
- Laundry & utility: Laundry located in basement
Neighborhood map
What this means for you Summary
Snapshot
- This is a 4-bed/1.0-bath single-family listed at $185k.
Deal economics
- At list price, monthly cash flow is $219 ($3k/yr) — positive.
- The deal already cash-flows at list — no discount required.
- Meets the 1% rule at list price ($2k rent vs $185k).
- Recommended offer: $179k (3.0% below list) — sets the bar for market timing.
- Cap rate 7.7% vs local median 5.4% in Redan — top-decile yield for the area; either an underpriced asset or a hidden risk that comps aren't pricing in. Stress-test before assuming the spread holds.
Location & tenants
- Location reads 64/100 on livability (#274 in GA) — a middle-class / working-renter tenant base. Strengths: cost of living A+, housing A+; Watch: crime D, amenities F, commute F.
- Dekalb County (suburban): math 19% / reading 28% proficiency, ranked #125 of 174 in GA (top 72%) — low school quality limits family demand, transient renter base, plan for 1-2y turnover; 68% free/reduced lunch — lower-income household profile, screen leases tightly.
- Zoned schools: Panola Way Elementary School (math 8% / reading 12%, grade F, #1,092 of 1,228 statewide, top 91%, 653 students, 100% FRL); Miller Grove Middle School (math 8% / reading 18%, grade F, #410 of 470 statewide, top 87%, 722 students, 100% FRL); Miller Grove High School (math 5% / reading 5%, grade F, #394 of 424 statewide, top 97%, 1,188 students, 100% FRL) — zoned schools average 100% FRL vs 68% district-wide (32 pts higher); higher-poverty schools than district average — tighter screening recommended.
- Zoned-school proficiency averages 9% at this address vs 24% district-wide (-14 pts) — the specific schools serving this property underperform the Dekalb County average; the district grade overstates school quality for this exact location.
- Market conditions: Rents rising (+3.7%/yr); 215 active listings in the ZIP; 40 comparable units currently listed for rent nearby; rentals at typical pace (median 21d on market — plan ~3-4 weeks tenant-placement turnaround); 1,240 units permitted in DeKalb County in 2024 (385 in 5+ unit buildings).
- This rent runs 35% of the median local income ($70k/yr) — at the standard rent-burdened threshold; future hikes will face affordability resistance.
Forward outlook
- Local home prices are declining (-3.0%/yr); year-one equity from $1k of loan paydown is wiped out by about $6k of value loss. Plan a longer hold.
- DeKalb County population projected at +28% by 2050 — long-run rental-demand tailwind backs the buy-and-hold thesis.
Negotiation context
- It's been on market 48 days — a 3% lower offer ($179k) is reasonable based on typical stale-listing flexibility.
- 2 sale attempts since 19y ago; this cycle's ask has dropped $10k (5%) from the opening price — seller is motivated, your offer sets the floor, not the list.
Risks & watch-outs
- Climate carrying-cost: moderate wind risk, 26% chance of damaging wind over 30y; extreme-heat days projected 7→18/yr by 2055 (HVAC capex compounding) — expect insurance premiums to compound above CPI over the hold.
Questions for the listing agent
- It's been on market 48 days. Have you received any prior offers? Is the seller open to a 3% concession, seller financing, or rate buy-down credit?
- What does the HOA fee cover, when was the last increase, and are there any pending special assessments or reserve-fund shortfalls?
- Is there a deadline driving the sale (1031 exchange, divorce, estate, relocation)? That informs how much negotiation room exists.
- Schools are B-rated — typically a magnet for longer-tenancy family renters. What's the average tenant stay here, and is there a school-zone premium baked into asking?
- Crime grade is D in this area — have there been break-ins, vandalism, or insurance claims at this property in the last 3 years? What carrier currently insures it and at what premium?
- What's the average days-on-market for RENTAL listings here right now (not sales)? A rising rental-DOM trend means longer vacancies and softer asking-rent achievability than the comps imply.
- What's the recent tenant-quality profile in this submarket — average credit score on applications, eviction rate, late-payment / NSF rate, and stable-employment percentage? A property-management company in the area should have these aggregated.
- How much new for-sale + rental construction is in the pipeline within 1–3 miles? Heavy new supply typically softens prices + rents 12–24 months out; constrained supply supports both.
Investment metrics
- 1% rule
- 1.12% ✓
- Cap rate
- 7.72%
- Cash-on-cash
- 5.09%
- DSCR
- 1.23
- GRM
- 7.4
CMA / ARV
- ARV (median comp)
- $236,856
- List price
- $184,900
- Delta
- -21.94%
- Verdict
- UNDERPRICED
- Comps
- 20 within 1.0 mi
Show comp detail 12 sales within ~0.75 mi
| Address | Dist | Beds/Ba | Sqft | Sold | Price | $/sf | Match |
|---|---|---|---|---|---|---|---|
| 5350 Olde St | 0.12mi | 3/2.0 (-1) | 1,788 (+0%) | 0mo | $169,900 | $95 | 85 |
| 1983 Northerly Way | 0.18mi | 4/2.0 | 1,776 (-1%) | 3mo | $228,660 | $129 | 84 |
| 5323 Scarbrough Round | 0.19mi | 3/2.0 (-1) | 1,642 (-8%) | 0mo | $179,000 | $109 | 68 |
| 2058 Scarbrough Dr | 0.11mi | 3/2.0 (-1) | 1,610 (-10%) | 2mo | $178,000 | $111 | 68 |
| 5333 Olde St | 0.13mi | 5/3.0 (+1) | 1,610 (-10%) | 1mo | $268,000 | $166 | 64 |
| 1949 Greensbrooke Close | 0.38mi | 4/3.0 | 1,824 (+2%) | 12mo | $265,000 | $145 | 61 |
| 2076 Scarbrough Dr | 0.08mi | 3/2.0 (-1) | 1,610 (-10%) | 12mo | $208,000 | $129 | 61 |
| 2071 Scarbrough Trl E | 0.19mi | 4/3.0 | 1,588 (-11%) | 6mo | $285,000 | $179 | 59 |
| 2235 Scarbrough Dr | 0.20mi | 3/2.5 (-1) | 1,588 (-11%) | 3mo | $196,000 | $123 | 59 |
| 5477 Forest Pines Dr | 0.50mi | 3/2.0 (-1) | 1,887 (+6%) | 2mo | $135,000 | $72 | 57 |
| 5207 Shawn Ln | 0.30mi | 4/3.0 | 1,608 (-10%) | 7mo | $213,000 | $132 | 56 |
| 5455 Wood Duck Ln | 0.46mi | 3/3.0 (-1) | 1,956 (+10%) | 5mo | $237,000 | $121 | 46 |
Match score weights: distance 35% · size 25% · config 20% · recency 20%. Top-matched comps best support the ARV.
Projected returns pro-forma
-3.0% appreciation · 3.72% rent growth · sell at horizon
- IRR
- -7.4%
- Equity multiple
- 0.72×
- Total profit
- $-14,355
- Equity at exit
- $27,569
- IRR
- 3.2%
- Equity multiple
- 1.24×
- Total profit
- $12,284
- Equity at exit
- $15,987
Cash invested: $51,772 (down + closing). Projections, not guarantees.
Landlord ↔ Tenant lean methodology
- Overall (STATE)
- 90 Strongly Landlord-Friendly
- State Georgia
- 90 Strongly Landlord-Friendly · R+3
- County
- — inherits STATE
- City
- — inherits STATE
ZIP-level market 30088
- Rents YoY
- 3.7%
- Active inventory
- 215
- Price-to-rent
- 7.4×
Monthly cashflow live
- Estimated rent
- $2,076 high interval (Pro) →
- Mortgage (P&I)
- −$970
- Tax from tax record
- −$357 /mo · $4,282/yr
- Insurance
- −$77
- HOA
- −$17
- Vacancy / Maint / Mgmt
- −$436
- Net cashflow
- $219
Break-even live
UW: 25.0% down · 7.5% · 30yr · 1.5% tax · 5.0% vac · 8.0% maint · 8.0% mgmt
Financing live
Cash to close
- Down payment
- $46,225
- Closing costs
- $5,547
- Reserves months
- —
- Total cash needed
- —
Loan-product check · same deal, 3 products live
Conventional
25% down · 7.5% · 30yr
- Down + closing
- —
- Monthly P&I
- —
- Monthly cashflow
- —
- DSCR
- —
- Eligible?
- —
Personal DTI + credit; lowest rate.
DSCR
20% down · 8.5% · 30yr
- Down + closing
- —
- Monthly P&I
- —
- Monthly cashflow
- —
- DSCR
- —
- Eligible?
- —
No personal income docs; deal must DSCR.
Hard money
10% down · 12.0% · 12mo
- Down + closing
- —
- Monthly P&I
- —
- Monthly cashflow
- —
- DSCR
- —
- Eligible?
- —
Short-term bridge; refi at stabilization.
Rent comps 40 comps
| Address | Beds | Baths | Sqft | Rent | $/sqft | DOM | Units | Dist |
|---|---|---|---|---|---|---|---|---|
| 5356 Olde St Stone Mountain, GA | 3.0 | 2.5 | 1560 | $1,745 | $1.12 | 20d | 1 | 0.10mi |
| 5368 Olde St Stone Mountain, GA | 5.0 | 3.0 | 1988 | $2,195 | $1.10 | 22d | 1 | 0.12mi |
| 2079 Panola Way Ct Lithonia, GA | 4.0 | 3.0 | 1971 | $1,850 | $0.94 | 24d | 1 | 0.23mi |
| 2244 Mulsanne Dr Lithonia, GA | 3.0 | 2.5 | 1750 | $2,250 | $1.29 | 5d | 1 | 0.25mi |
| 2248 Mulsanne Dr Lithonia, GA | 3.0 | 2.5 | 1750 | $2,250 | $1.29 | 43d | 1 | 0.25mi |
| 5179 Scarbrough Trl W Stone Mountain, GA | 4.0 | 3.0 | 1700 | $1,575 | $0.93 | 4d | 1 | 0.28mi |
| 5452 Perching Pl Lithonia, GA | 3.0 | 2.5 | 2036 | $1,900 | $0.93 | 24d | 1 | 0.39mi |
| 2005 Marbut Forest Dr Lithonia, GA | 3.0 | 2.0 | 1556 | $1,900 | $1.22 | 5d | 1 | 0.55mi |
| 1874 Vauxhall Dr Lithonia, GA | 3.0 | 2.0 | 1367 | $1,595 | $1.17 | 3d | 1 | 0.57mi |
| 5536 Downs Way Lithonia, GA | 3.0 | 2.0 | 1400 | $1,600 | $1.14 | 43d | 1 | 0.58mi |
| 2188 Justify LN #40 Lithonia, GA | 3.0 | 2.5 | 2085 | $2,400 | $1.15 | 43d | 1 | 0.63mi |
| 5579 Marbut Rd Lithonia, GA | 3.0 | 2.5 | 1280 | $1,850 | $1.45 | 43d | 1 | 0.72mi |
| 5622 Glen Ridge Bnd Lithonia, GA | 3.0 | 2.5 | 1967 | $2,110 | $1.07 | 24d | 1 | 0.72mi |
| 1964 Taffeta Trl Lithonia, GA | 3.0 | 2.0 | 1508 | $1,870 | $1.24 | 19d | 1 | 0.74mi |
| 2233 Glen Briar Way Lithonia, GA | 3.0 | 2.5 | 2036 | $2,500 | $1.23 | 11d | 1 | 0.74mi |
| 5047 Chadwick Ct Decatur, GA | 3.0 | 2.5 | 1488 | $1,645 | $1.11 | 3d | 1 | 0.81mi |
| 1000 Hidden Chase Stone Mountain, GA | 1.0–3.0 | 1.0–2.0 | 1185 | $1,510 | $1.27 | 5d | 1 | 0.84mi |
| 5049 Donnell Way Decatur, GA | 3.0 | 2.0 | 1566 | $1,923 | $1.23 | 43d | 1 | 0.86mi |
| 2314 Hampton Dr Decatur, GA | 3.0 | 3.0 | 1600 | $2,030 | $1.27 | 43d | 1 | 0.87mi |
| 5625 Strathmoor Manor Cir Lithonia, GA | 3.0 | 2.5 | 1336 | $1,550 | $1.16 | 3d | 1 | 0.88mi |
| 5550 Wellborn Creek Dr Lithonia, GA | 3.0 | 2.5 | 1850 | $2,085 | $1.13 | 1d | 1 | 0.92mi |
| 5663 Saint Thomas Dr Lithonia, GA | 4.0 | 2.0 | 1230 | $1,595 | $1.30 | 12d | 1 | 0.93mi |
| 5477 Wellborn Creek Dr Lithonia, GA | 3.0 | 3.0 | 2084 | $2,400 | $1.15 | 3d | 1 | 0.94mi |
| 1717 Panola Rd Stone Mountain, GA | 3.0–4.0 | 2.5 | 2107 | $3,360 | $1.59 | 1d | 97 | 0.94mi |
| 1724 Laurel Creek Cir Lithonia, GA | 3.0 | 2.5 | 1558 | $1,935 | $1.24 | 12d | 1 | 0.98mi |
| 5863 Strathmoor Manor Cir Lithonia, GA | 3.0 | 2.5 | 1347 | $1,650 | $1.22 | 3d | 1 | 1.00mi |
| 5876 Strathmoor Manor Cir Unit 1 Lithonia, GA | 3.0 | 2.5 | 1400 | $1,295 | $0.93 | 24d | 1 | 1.04mi |
| 5823 Strathmoor Manor Cir Lithonia, GA | 3.0 | 2.5 | 1348 | $1,925 | $1.43 | 24d | 1 | 1.04mi |
| 2286 Strathmoor Manor Dr Lithonia, GA | 3.0 | 2.5 | 1348 | $1,675 | $1.24 | 1d | 1 | 1.04mi |
| 5798 Strathmoor Manor Cir Lithonia, GA | 3.0 | 2.5 | 1347 | $1,575 | $1.17 | 43d | 1 | 1.05mi |
| 2450 Northmill Ln Decatur, GA | 4.0 | 2.5 | 2046 | $2,135 | $1.04 | 43d | 1 | 1.11mi |
| 4919 Wilkins Station Dr Decatur, GA | 3.0 | 2.0 | 1770 | $2,161 | $1.22 | 20d | 1 | 1.12mi |
| 4939 Clubgreen Smt Stone Mountain, GA | 4.0 | 2.5 | 2156 | $2,139 | $0.99 | 43d | 1 | 1.14mi |
| 2272 Ramblewood Cir Decatur, GA | 4.0 | 2.5 | 2198 | $2,111 | $0.96 | 5d | 1 | 1.15mi |
| 1652 Downs Xing Stone Mountain, GA | 3.0 | 2.5 | 1376 | $1,675 | $1.22 | 5d | 1 | 1.16mi |
| 5663 Windfall Ln Lithonia, GA | 3.0 | 2.5 | 1272 | $1,650 | $1.30 | 24d | 1 | 1.17mi |
| 5663 Windfall Ln Lithonia, GA | 3.0 | 2.5 | 1272 | $1,650 | $1.30 | 43d | 1 | 1.17mi |
| 4909 Truitt Ln Decatur, GA | 3.0 | 2.0 | 1697 | $2,500 | $1.47 | 43d | 1 | 1.18mi |
| 4955 Windsor Downs Ln Decatur, GA | 4.0 | 2.0 | 1888 | $2,050 | $1.09 | 5d | 1 | 1.20mi |
| 5788 Calle Vista Dr Lithonia, GA | 3.0 | 2.5 | 1593 | $2,300 | $1.44 | 18d | 1 | 1.20mi |
HOA detail
- Monthly dues
- $17 · $204/yr
Listing history 23 events
-
2026-06-18days on market $184,900 Active 48 DOM
-
2026-06-17days on market $184,900 Active 47 DOM
-
2026-06-16days on market $184,900 Active 46 DOM
-
2026-06-15days on market $184,900 Active 45 DOM
-
2026-06-13statusdays on market $184,900 Active 43 DOM
-
2026-06-09days on market $184,900 Price Change 39 DOM
-
2026-06-08days on market $184,900 Price Change 38 DOM
-
2026-06-08pricestatus $184,900 Price Change 37 DOM
-
2026-06-07days on market $194,900 Active 37 DOM
-
2026-06-04days on market $194,900 Active 34 DOM
-
2026-06-03days on market $194,900 Active 33 DOM
-
2026-06-02days on market $194,900 Active 32 DOM
-
2026-06-01days on market $194,900 Active 31 DOM
-
2026-05-31days on market $194,900 Active 30 DOM
-
2026-05-01$194,900 New 439-char remark
-
2017-06-01soldstatus $11,569,148
-
2007-07-09soldstatus $120,000 278-char remark
Show marketing remark (278 chars)
COMPLETE RENOVATION,PLENTY OF SPACE! KITCHEN W/NEW CABINETS,TILE BKSPLASH, CTRS & NEW APPL. FRESH PAINT INSIDE/OUT. NEW FLOORING/CARPET,CERAMIC TILE & HDWDS. SPLIT BDRM PLAN. LR/DR OPEN TO KIT ON MAIN LEVEL,GREAT RM & LG LAUNDRY RM ON LOWER LEVEL. WOODED BKYD W/DECK
-
2007-03-29$114,900 278-char remark
Show marketing remark (278 chars)
COMPLETE RENOVATION,PLENTY OF SPACE! KITCHEN W/NEW CABINETS,TILE BKSPLASH, CTRS & NEW APPL. FRESH PAINT INSIDE/OUT. NEW FLOORING/CARPET,CERAMIC TILE & HDWDS. SPLIT BDRM PLAN. LR/DR OPEN TO KIT ON MAIN LEVEL,GREAT RM & LG LAUNDRY RM ON LOWER LEVEL. WOODED BKYD W/DECK
-
1998-05-05soldstatus $89,836
-
1995-05-24soldstatus $75,900
-
1988-10-14soldstatus $69,000
-
1985-12-09soldstatus $56,700
-
1980-10-17soldstatus $38,400
ⓘ Source: listings_history table (triggers on properties + properties_extension) + one-shot
backfill from property_details.listing_events for pre-trigger history.
Tax reassessment forecast GA · Resets to sale price
- Current annual tax
- $4,282 · $357/mo
- Projected year-2 tax
- $4,282 · $357/mo
- Expected delta
- $0/yr ($0/mo · 0.0%)
ⓘ Screening estimate from a state-policy table — verify with the county assessor before closing.
Climate risk First Street
- Flood 1/10 Low FEMA zone X (unshaded) · 0% chance over 30 yrs
- Wildfire 1/10 Low
- Heat 5/10 Major 7 d/yr ≥105°F today · 18 d/yr by 30 yrs out
- Wind 5/10 Major 26% chance of damaging wind over 30 yrs
- Air quality 5/10 Major 7 unhealthy d/yr today · 10 by 30 yrs out
Nearby sold comps map
Loading sold comps map…
Walkable amenities ~0.75 mi
Loading nearby amenities…
Taxation est. · year 1
- Rental income
- $24,911
- − Mortgage interest
- −$10,357
- − Property taxes
- −$4,282
- − Insurance
- −$924
- − Repairs & maintenance
- −$1,993
- − Management
- −$1,993
- − HOA
- −$204
- − Depreciation
- −$5,379
- Taxable loss
- −$222
- Est. tax savings @ 24.0%
- +$53
- After-tax cash flow
- $2,686/yr
For passive investors: Depreciation is non-cash, so a rental often shows a tax loss while cash-flowing — sheltering income. Rental losses are passive: they offset passive income freely, and up to $25,000/yr can offset ordinary (W-2) income if you actively participate and your MAGI is under $100k (phasing out to $0 by $150k); unused losses carry forward. On sale, claimed depreciation is recaptured at up to 25%, and gains may owe capital-gains tax (a 1031 exchange can defer both). Figures are a year-1 estimate at your 24.0% rate — not tax advice; consult a CPA.
Schools (NCES district)
- District
- Dekalb County
- NCES district ID
- 1301740
- Math proficiency
- 19% ▼ -12.00%
- Reading proficiency
- 28% ▼ -7.00%
- Median HH income
- $51,448
- Composite
- 20.92/100
- National rank
- #8482
- State rank
- #125 of 174 in GA
Livability — Redan
- Score
- 64/100
- State rank
- #274
- US rank
- #14766
Category grades
Schools grade is shown separately in the Schools card above.
Census & demographics
- Census place
- Redan, GA
- County
- Dekalb County · 782,738 people
- City population
- 29,279
- Metro
- Atlanta-Sandy Springs-Alpharetta, GA
- Population (ZIP)
- 29,240
- Household income
- $70,325
- Rent vs Own
- Severe rent burden
- 1106.0
Population outlook (DeKalb County) Hauer SSP2
- Today (2025)
- 839,977 people
- By 2030
- 891,768 · +6.2%
- By 2040
- 988,894 · +17.7%
- By 2050
- 1,074,583 · +27.9%
- By 2075
- 1,245,026 · +48.2%
- By 2100
- 1,303,135 · +55.1%
Race, ethnicity, and origin ACS 2023
- Neighborhood character
- Predominantly Black (84%)
- Race & ethnicity
- Black 84% White 5% Hispanic / Latino 5% Two or more races 5%
- Common ancestry
- Swedish 1% Russian 1%
- Foreign-born
- 11% · Canada
- Languages at home
- 90% English-only · Spanish 4% French/Haitian/Cajun 1% Other Indo-European 1%
Political lean MEDSL · DeKalb
- 2024 margin
- Solid D (+64.8) · D 81.9% · R 17.1% · Other 1.0%
- 2008→2024 swing
- +6.1pp toward D · 2008: 58.6pp · 2024: 64.8pp
- All cycles
- 2024: D+64.8 2020: D+67.4 2016: D+64.8 2012: D+56.8 2008: D+58.6
Not yet ingested
- Civics
- —
Market trends
- HPI YoY
- ▼ -169.92%
- Current HPI
- 206.5421
- Rent YoY
- ▲ 3.72%
- Metro
- Atlanta-Sandy Springs-Alpharetta, GA
- State GDP YoY
- ▲ 2.66%
- F500 in state
- 28
Industry mix (Fortune 500 HQ in GA)
| Industry | F500 HQs | Revenue |
|---|---|---|
| Paper / Packaging | 2 | $29B |
|
||
| Retail | 1 | $160B |
|
||
| Transportation / Logistics | 1 | $91B |
|
||
| Airlines | 1 | $62B |
|
||
| Consumer Goods | 1 | $47B |
|
||
| Utilities | 1 | $25B |
|
||
Price history
+381.5% since first listed10 events — show timeline
- 2026-06-08 Price Changed $184,900 GAMLS
- 2026-05-01 Listed $194,900 GAMLS
- 2017-06-01 Sold (Public Records) $11,569,148 Public Records
- 2007-07-09 Sold (MLS) $120,000 FMLS
- 2007-03-29 Listed $114,900 FMLS
- 1998-05-05 Sold (Public Records) $89,836 Public Records
- 1995-05-24 Sold (Public Records) $75,900 Public Records
- 1988-10-14 Sold (Public Records) $69,000 Public Records
- 1985-12-09 Sold (Public Records) $56,700 Public Records
- 1980-10-17 Sold (Public Records) $38,400 Public Records
Property tax history
+4.1%/yrLatest (2025): $4,282 · +0.1% YoY. Source: county tax records.
Cash-flow waterfall
monthlySold comps — $/sqft
last 12 mo · ≤1 miLoading sold comps…