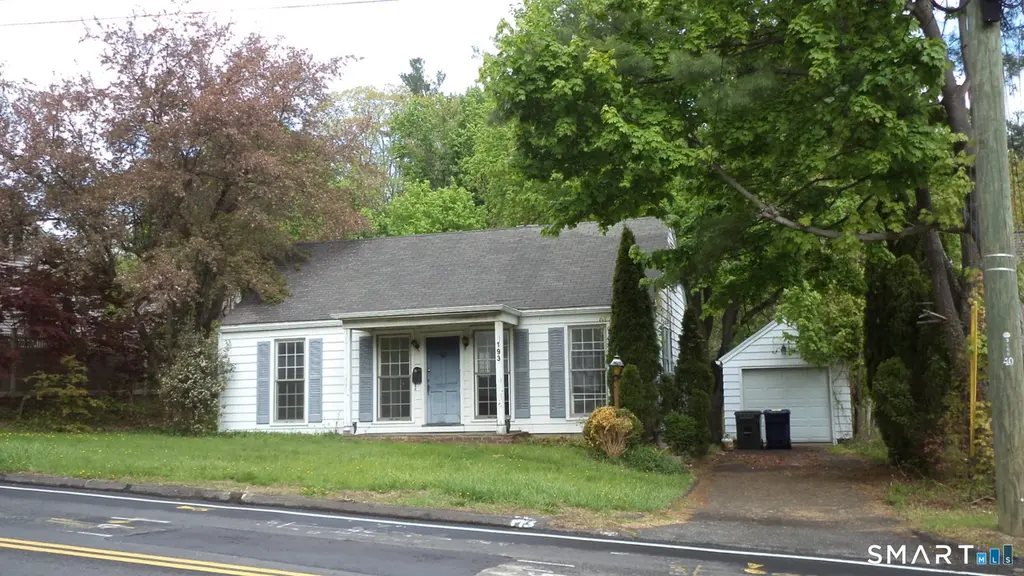
193 Southern Blvd · Danbury, CT
Flood risk 1/10 · Minimal
- FEMA flood zone
- X (unshaded)
- Chance of flooding over 30 yrs
- 0.0%
- Est. flood insurance / yr
- $473 – $860
Fire risk 1/10 · Minimal
- Est. fire insurance / yr
- $829 – $1,539
Heat risk 4/10 · Minor
- Hot days now (above 99°F)
- 7 days/yr
- Hot days in 30 yrs
- 15 days/yr
Wind risk 5/10 · Moderate
- Chance of severe wind over 30 yrs
- 26.0%
Air-quality risk 3/10 · Minor
- Unhealthy air days now
- 3 days/yr
- Unhealthy air days in 30 yrs
- 4 days/yr
Risk factors via First Street. Map © Google.
Why this score? — see what drove the D grade
The composite is a weighted blend of 9 inputs, each scored 0–100. Each bar is that input's sub-score; the figure is the points it added to the 100-point composite (weight × sub-score).
- ARV discount +15.0/15.0
- Cash flow +9.7/30.0
- Livability +3.8/5.0
- Rent growth +3.3/5.0
- 1% rule +3.2/10.0
- DSCR +2.7/10.0
- Condition / age +2.5/5.0
- Schools +2.4/10.0
- Appreciation +0.0/10.0
$299,000
🖨 Deal sheet (PDF) 📄 Offer letter ✓ Due diligence
Listing remarks MLS
Good Condition. Features Include Hardwood Floors, Fireplace, Oil/Hot Water Heat, Eat-In-Kitchen, Private Back Yard W/Patio And Detached Garage.
Key facts
- 9,583 sq ft lot
- Garage
- Built 1947
Property features AI
Exterior
- Parking: Detached garage (1-car); Driveway parking; total 2 parking spaces
- Utilities: Public water connected; Public sewer connected; Electric service (standard); Oil fuel for heating
- Home design: Single-family home; Frame construction; White exterior siding (aluminum)
- Construction: Asphalt shingle roof; Concrete foundation
- Exterior features: Lightly wooded, level to sloping lot; Private driveway; Paved driveway
Interior
- Kitchen: Electric range; Refrigerator
- Bedrooms: 2 bedrooms
- Bathrooms: 1 full bathroom
- Heating & cooling: Hot water heat (oil-fired); Central air conditioning; Fuel tank located in basement; Domestic hot water
- Interior features: Cable pre-wired; Full basement; Attic with hatch access; One fireplace; Total of 4 rooms
- Laundry & utility: Laundry in lower level
Neighborhood map
What this means for you Summary
Snapshot
- This is a 2-bed/1.0-bath single-family listed at $299k.
Deal economics
- At list price, monthly cash flow is $-200 ($-2k/yr) — negative.
- To cash-flow at today's rent, offer at most $264k (11.8% below list).
- To meet the 1% rule (rent ≥ 1% of price), the offer needs to be $245k (18.2% below list).
- Recommended offer: $245k (18.2% below list) — sets the bar for 1% rule.
- Cap rate 5.5% vs local median 3.6% in Danbury — top-decile yield for the area; either an underpriced asset or a hidden risk that comps aren't pricing in. Stress-test before assuming the spread holds.
Location & tenants
- Location reads 76/100 on livability (#51 in CT, #3,379 nationally) — a middle-class / working-renter tenant base. Strengths: commute A+, housing A+, health & safety A+; Watch: amenities F, cost of living F.
- Danbury School District (urban): math 19% / reading 32% proficiency, ranked #131 of 153 in CT (top 86%) — low school quality limits family demand, transient renter base, plan for 1-2y turnover.
- Zoned schools: Park Avenue School (math 16% / reading 17%, grade F, #466 of 553 statewide, top 84%, 608 students, 53% FRL); Danbury High School (math 19% / reading 41%, grade F, #137 of 194 statewide, top 70%, 3,590 students, 48% FRL).
- Market conditions: Rents rising (+3.1%/yr); 200 active listings in the ZIP; 25 comparable units currently listed for rent nearby; rentals lingering (median 46d on market — plan ~5-8 weeks vacancy on turnover, expect pricing pressure); 52% of comp listings sitting > 30 days — soft ceiling on asking rent; solid renter incomes; 1,151 units permitted in Western Connecticut Planning Region in 2024 (714 in 5+ unit buildings).
- This rent runs 38% of the median local income ($77k/yr) — at the standard rent-burdened threshold; future hikes will face affordability resistance.
Forward outlook
- Local home prices are declining (-3.0%/yr); year-one equity from $2k of loan paydown is wiped out by about $9k of value loss. Plan a longer hold.
Negotiation context
- Only 2 days on market — expect competitive offers; lowballing is unlikely to land.
- 3 sale attempts since 22y ago with the ask held roughly flat each time — persistent listings suggest the price (not the market) is what's stuck; bring a comps-based counter.
Risks & watch-outs
- Watch-outs: built in 1947 — expect roof / HVAC / electrical / plumbing capex.
- Climate carrying-cost: moderate wind risk, 26% chance of damaging wind over 30y — expect insurance premiums to compound above CPI over the hold.
Questions for the listing agent
- What do current leases actually rent for vs. the listed asking? Can we see a recent rent roll and the last 12 months of T-12 income?
- Built in 1947 — when were the roof, HVAC, electrical panel, plumbing, and water heater last replaced?
- Is there a deadline driving the sale (1031 exchange, divorce, estate, relocation)? That informs how much negotiation room exists.
- Schools are D-rated, which usually means shorter tenancies and higher turnover. Who's the typical renter profile here, and what's been the actual vacancy rate?
- The area grade is low — what's the realistic commute time and amenity access for the typical tenant pool here? Any planned neighborhood developments (good or bad) we should know about?
- What's the average days-on-market for RENTAL listings here right now (not sales)? A rising rental-DOM trend means longer vacancies and softer asking-rent achievability than the comps imply.
- What's the recent tenant-quality profile in this submarket — average credit score on applications, eviction rate, late-payment / NSF rate, and stable-employment percentage? A property-management company in the area should have these aggregated.
- How much new for-sale + rental construction is in the pipeline within 1–3 miles? Heavy new supply typically softens prices + rents 12–24 months out; constrained supply supports both.
Investment metrics
- 1% rule
- 0.82% ✗
- Cap rate
- 5.49%
- Cash-on-cash
- -2.86%
- DSCR
- 0.87
- GRM
- 10.2
CMA / ARV
- ARV (median comp)
- $429,500
- List price
- $299,000
- Delta
- -30.38%
- Verdict
- UNDERPRICED
- Comps
- 20 within 1.0 mi
Show comp detail 5 sales within ~0.75 mi
| Address | Dist | Beds/Ba | Sqft | Sold | Price | $/sf | Match |
|---|---|---|---|---|---|---|---|
| 26 Dartmouth Ln | 0.40mi | 3/1.0 (+1) | 1,106 (+0%) | 8mo | $417,000 | $377 | 70 |
| 18 S Cornell Rd | 0.34mi | 3/1.5 (+1) | 1,092 (-1%) | 21mo | $429,000 | $393 | 58 |
| 43 Jefferson Ave | 0.37mi | 3/1.0 (+1) | 1,072 (-3%) | 23mo | $380,000 | $354 | 53 |
| 12 Mountainville Rd | 0.75mi | 3/2.0 (+1) | 1,156 (+5%) | 6mo | $375,000 | $324 | 43 |
| 26 Crescent Dr | 0.62mi | 2/1.0 | 960 (-13%) | 15mo | $340,000 | $354 | 36 |
Match score weights: distance 35% · size 25% · config 20% · recency 20%. Top-matched comps best support the ARV.
Projected returns pro-forma
-3.0% appreciation · 3.08% rent growth · sell at horizon
- IRR
- -20.9%
- Equity multiple
- 0.27×
- Total profit
- $-60,887
- Equity at exit
- $44,582
- IRR
- -14.1%
- Equity multiple
- 0.18×
- Total profit
- $-68,262
- Equity at exit
- $25,852
Cash invested: $83,720 (down + closing). Projections, not guarantees.
Landlord ↔ Tenant lean methodology
- Overall (STATE)
- 27 Tenant-Leaning
- State Connecticut
- 27 Tenant-Leaning · D+7
- County
- — inherits STATE
- City
- — inherits STATE
ZIP-level market 06810
- Rents YoY
- 3.1%
- Active inventory
- 200
- Price-to-rent
- 10.2×
Monthly cashflow live
- Estimated rent
- $2,446 high interval (Pro) →
- Mortgage (P&I)
- −$1,568
- Tax from tax record
- −$439 /mo · $5,272/yr
- Insurance
- −$125
- HOA
- −$0
- Vacancy / Maint / Mgmt
- −$514
- Net cashflow
- $-200
Break-even live
Sensitivity live
| Price | -10% $-30 | -5% $-115 | +0% $-200 | +5% $-284 | +10% $-369 |
|---|---|---|---|---|---|
| Rent | -10% $-393 | -5% $-296 | +0% $-200 | +5% $-103 | +10% $-6 |
| Rate | -1.0pp $-49 | -0.5pp $-124 | base $-200 | +0.5pp $-277 | +1.0pp $-356 |
UW: 25.0% down · 7.5% · 30yr · 1.5% tax · 5.0% vac · 8.0% maint · 8.0% mgmt
Financing live
Cash to close
- Down payment
- $74,750
- Closing costs
- $8,970
- Reserves months
- —
- Total cash needed
- —
Loan-product check · same deal, 3 products live
Conventional
25% down · 7.5% · 30yr
- Down + closing
- —
- Monthly P&I
- —
- Monthly cashflow
- —
- DSCR
- —
- Eligible?
- —
Personal DTI + credit; lowest rate.
DSCR
20% down · 8.5% · 30yr
- Down + closing
- —
- Monthly P&I
- —
- Monthly cashflow
- —
- DSCR
- —
- Eligible?
- —
No personal income docs; deal must DSCR.
Hard money
10% down · 12.0% · 12mo
- Down + closing
- —
- Monthly P&I
- —
- Monthly cashflow
- —
- DSCR
- —
- Eligible?
- —
Short-term bridge; refi at stabilization.
Rent comps 25 comps
| Address | Beds | Baths | Sqft | Rent | $/sqft | DOM | Units | Dist |
|---|---|---|---|---|---|---|---|---|
| 113 Park Ave Unit 7 Danbury, CT | 3.0 | 1.5 | 1205 | $3,000 | $2.49 | 25d | 1 | 0.47mi |
| 1 Fairview Dr #4 Danbury, CT | 2.0 | 1.0 | 910 | $2,050 | $2.25 | 21d | 1 | 0.47mi |
| 95 Park Ave #20 Danbury, CT | 2.0 | 2.5 | 1176 | $2,700 | $2.30 | 13d | 1 | 0.50mi |
| 50 Lincoln Ave Unit 1 R Danbury, CT | 2.0 | 1.0 | 825 | $2,300 | $2.79 | 5d | 1 | 0.55mi |
| 9 Concord St Unit 3 Danbury, CT | 3.0 | 1.0 | 1160 | $2,600 | $2.24 | 46d | 1 | 0.59mi |
| 4 Division St Danbury, CT | 2.0 | 1.0 | 1000 | $2,500 | $2.50 | 25d | 1 | 0.60mi |
| 4 Division St Apt 4 Danbury, CT | 2.0 | 1.0 | 850 | $2,500 | $2.94 | 46d | 1 | 0.61mi |
| 47 Merrimac St Danbury, CT | 2.0 | 1.5 | 1000 | $2,400 | $2.40 | 46d | 1 | 0.69mi |
| 32 Park Ave Danbury, CT | 1.0 | 1.0 | 800 | $2,000 | $2.50 | 25d | 1 | 0.75mi |
| 136 Deer Hill Ave Unit A6 Danbury, CT | 1.0 | 1.0 | 800 | $2,200 | $2.75 | 46d | 1 | 0.86mi |
| 68 Grand St Danbury, CT | 3.0 | 1.0 | 1480 | $1,900 | $1.28 | 5d | 1 | 0.88mi |
| 17 Lake Ave #2 Danbury, CT | 2.0 | 1.0 | 1000 | $1,995 | $2.00 | 46d | 1 | 0.99mi |
| 30 Foster St Danbury, CT | 1.0 | 1.0 | 700 | $1,980 | $2.83 | 25d | 1 | 1.02mi |
| 6 Westville Ave Unit 6A Danbury, CT | 2.0 | 1.0 | 1000 | $1,900 | $1.90 | 46d | 1 | 1.04mi |
| 7 New St Unit 202 Danbury, CT | 2.0 | 1.0 | 750 | $2,300 | $3.07 | 46d | 1 | 1.06mi |
| 13 Morris St Unit B Danbury, CT | 2.0 | 1.5 | 1132 | $2,250 | $1.99 | 46d | 1 | 1.12mi |
| 76 Town Hill Ave Unit D Danbury, CT | 2.0 | 1.0 | 870 | $2,450 | $2.82 | 46d | 1 | 1.23mi |
| 1 Kennedy Ave Danbury, CT | 2.0 | 1.0–2.0 | 874 | $2,720 | $3.11 | 4d | 31 | 1.30mi |
| 333 Main St Danbury, CT | 1.0–2.0 | 1.0–2.0 | 869 | $2,650 | $3.05 | 5d | 2 | 1.37mi |
| 8 Rose St Unit 26-14 Danbury, CT | 3.0 | 1.5 | 1370 | $3,000 | $2.19 | 5d | 1 | 1.39mi |
| 8 Rose St Unit 24-6 Danbury, CT | 2.0 | 1.5 | 1285 | $2,300 | $1.79 | 21d | 1 | 1.39mi |
| 8 Rose St Unit 20-1 Danbury, CT | 1.0 | 1.0 | 828 | $2,000 | $2.42 | 46d | 1 | 1.39mi |
| 16 Scuppo Rd Unit D4 Danbury, CT | 2.0 | 1.0 | 918 | $2,400 | $2.61 | 46d | 1 | 1.43mi |
| 8 Wixted Ave Danbury, CT | 3.0 | 2.0 | 1207 | $3,300 | $2.73 | 46d | 1 | 1.48mi |
| 10 Balmforth Ave Unit 11 Danbury, CT | 3.0 | 2.0 | 980 | $2,700 | $2.76 | 46d | 1 | 1.48mi |
Listing history 9 events
-
2026-05-04status Under Contract 197-char remark
-
2026-05-02$299,000 Active 197-char remark
-
2005-08-08soldstatus $373,000
-
2005-08-08soldstatus $373,000
-
2005-04-07$379,000
-
2004-10-22soldstatus $260,000
Show marketing remark (148 chars)
Good Condition. Features Include Hardwood Floors, Fireplace, Oil/Hot Water Heat, Eat-In-Kitchen, Private Back Yard W/Patio And Detached Garage.
-
2004-10-22soldstatus $260,000
Show marketing remark (148 chars)
Good Condition. Features Include Hardwood Floors, Fireplace, Oil/Hot Water Heat, Eat-In-Kitchen, Private Back Yard W/Patio And Detached Garage.
-
2004-09-16$269,900
Show marketing remark (148 chars)
Good Condition. Features Include Hardwood Floors, Fireplace, Oil/Hot Water Heat, Eat-In-Kitchen, Private Back Yard W/Patio And Detached Garage.
-
1980-03-24soldstatus $64,000
ⓘ Source: listings_history table (triggers on properties + properties_extension) + one-shot
backfill from property_details.listing_events for pre-trigger history.
Tax reassessment forecast CT · Partial reset (capped growth)
- Current annual tax
- $5,272 · $439/mo
- Projected year-2 tax
- $5,835 · $486/mo
- Expected delta
- +$563/yr (+$47/mo · 10.7%)
ⓘ Screening estimate from a state-policy table — verify with the county assessor before closing.
Climate risk First Street
- Flood 1/10 Low FEMA zone X (unshaded) · 0% chance over 30 yrs
- Wildfire 1/10 Low
- Heat 4/10 Moderate 7 d/yr ≥99°F today · 15 d/yr by 30 yrs out
- Wind 5/10 Major 26% chance of damaging wind over 30 yrs
- Air quality 3/10 Moderate 3 unhealthy d/yr today · 4 by 30 yrs out
Nearby sold comps map
Loading sold comps map…
Walkable amenities ~0.75 mi
Loading nearby amenities…
Taxation est. · year 1
- Rental income
- $29,352
- − Mortgage interest
- −$16,749
- − Property taxes
- −$5,272
- − Insurance
- −$1,495
- − Repairs & maintenance
- −$2,348
- − Management
- −$2,348
- − Depreciation
- −$8,698
- Taxable loss
- −$7,558
- Est. tax savings @ 24.0%
- +$1,814
- After-tax cash flow
- $-581/yr
For passive investors: Depreciation is non-cash, so a rental often shows a tax loss while cash-flowing — sheltering income. Rental losses are passive: they offset passive income freely, and up to $25,000/yr can offset ordinary (W-2) income if you actively participate and your MAGI is under $100k (phasing out to $0 by $150k); unused losses carry forward. On sale, claimed depreciation is recaptured at up to 25%, and gains may owe capital-gains tax (a 1031 exchange can defer both). Figures are a year-1 estimate at your 24.0% rate — not tax advice; consult a CPA.
Schools (NCES district)
- District
- Danbury School District
- NCES district ID
- 0901020
- Math proficiency
- 19% ▼ -17.00%
- Reading proficiency
- 32% ▼ -16.00%
- Median HH income
- $65,793
- Composite
- 23.93/100
- National rank
- #7784
- State rank
- #131 of 153 in CT
Livability — Danbury
- Score
- 76/100
- State rank
- #51
- US rank
- #3379
Category grades
Schools grade is shown separately in the Schools card above.
Census & demographics
- Census place
- Danbury, CT
- County
- Fairfield County · 765,532 people
- City population
- 87,061
- Metro
- Bridgeport-Stamford-Norwalk, CT
- Population (ZIP)
- 55,833
- Household income
- $76,933
- Rent vs Own
- Severe rent burden
- 3255.0
Population outlook (Western Connecticut County) Hauer SSP2
- By 2040
- 685,031
Race, ethnicity, and origin ACS 2023
- Neighborhood character
- Highly diverse neighborhood (Simpson 0.72)
- Race & ethnicity
- Hispanic / Latino 37% White 35% Two or more races 19% Black 12% Asian 5%
- Hispanic origin (detail)
- Mexican 4% Puerto Rican 3% Dominican 6%
- Common ancestry
- Estonian 8% Russian 4% Romanian 3%
- Foreign-born
- 41% · Canada, Jamaica, Dominican Republic
- Languages at home
- 48% English-only · Spanish 32% Other Indo-European 16% Other Asian/Pacific 1%
Political lean MEDSL · Western Connecticut
- 2024 margin
- D (+19.1) · D 58.8% · R 39.7% · Other 1.6%
- All cycles
- 2024: D+19.1
Not yet ingested
- Civics
- —
Market trends
- HPI YoY
- ▼ -309.71%
- Current HPI
- 286.5484
- Rent YoY
- ▲ 3.08%
- Metro
- Bridgeport-Stamford-Norwalk, CT
- State GDP YoY
- ▲ 1.06%
- F500 in state
- 38
Industry mix (Fortune 500 HQ in CT)
| Industry | F500 HQs | Revenue |
|---|---|---|
| Industrial Machinery | 4 | $38B |
|
||
| Insurance | 3 | $71B |
|
||
| Financial Services | 2 | $25B |
|
||
| Transportation / Logistics | 2 | $18B |
|
||
| Healthcare | 1 | $247B |
|
||
| Telecommunications | 1 | $55B |
|
||
Price history
+367.2% since first listed9 events — show timeline
- 2026-05-04 Pending — Smart MLS
- 2026-05-02 Listed $299,000 Smart MLS
- 2005-08-08 Sold (Public Records) $373,000 Public Records
- 2005-08-08 Sold (MLS) $373,000 Smart MLS
- 2005-04-07 Listed $379,000 Smart MLS
- 2004-10-22 Sold (Public Records) $260,000 Public Records
- 2004-10-22 Sold (MLS) $260,000 Smart MLS
- 2004-09-16 Listed $269,900 Smart MLS
- 1980-03-24 Sold (Public Records) $64,000 Public Records
Property tax history
+3.5%/yrLatest (2023): $5,272 · +20.2% YoY. Source: county tax records.
Cash-flow waterfall
monthlySold comps — $/sqft
last 12 mo · ≤1 miLoading sold comps…