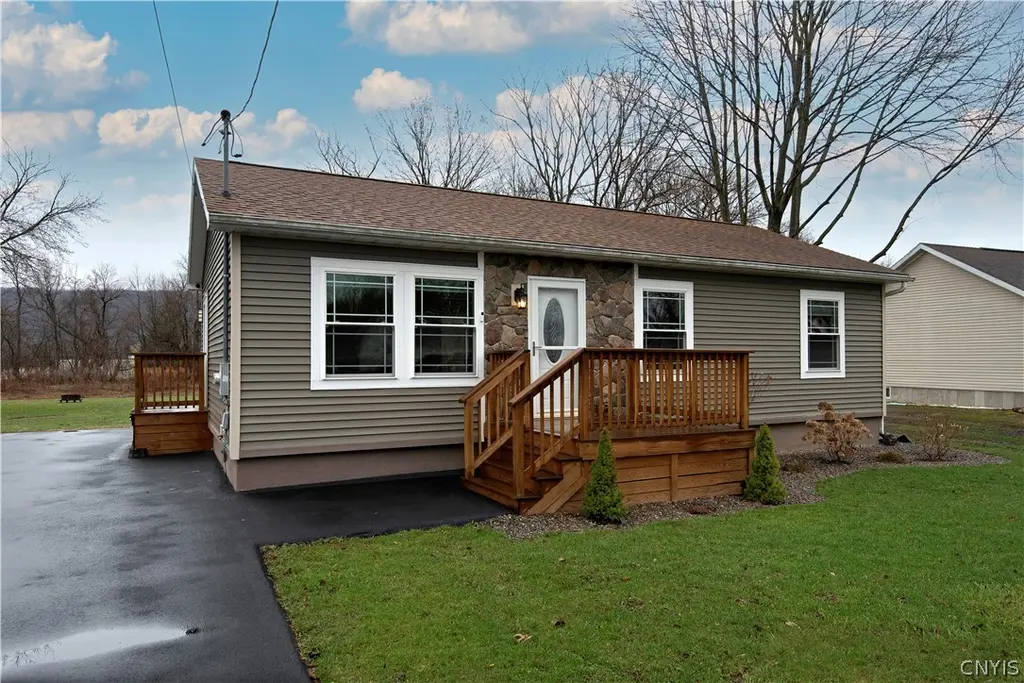
507 1st Avenue Ext · East Frankfort, NY
Flood risk 1/10 · Minimal
- FEMA flood zone
- X
- Chance of flooding over 30 yrs
- 0.0%
- Est. flood insurance / yr
- $473 – $860
Fire risk 1/10 · Minimal
- Est. fire insurance / yr
- $691 – $1,283
Heat risk 3/10 · Minor
- Hot days now (above 96°F)
- 7 days/yr
- Hot days in 30 yrs
- 17 days/yr
Wind risk 2/10 · Minimal
- Chance of severe wind over 30 yrs
- 1.0%
Air-quality risk 2/10 · Minimal
- Unhealthy air days now
- 0 days/yr
- Unhealthy air days in 30 yrs
- 1 days/yr
Risk factors via First Street. Map © Google.
Why this score? — see what drove the D grade
The composite is a weighted blend of 9 inputs, each scored 0–100. Each bar is that input's sub-score; the figure is the points it added to the 100-point composite (weight × sub-score).
- ARV discount +10.9/15.0
- Appreciation +10.0/10.0
- Cash flow +7.7/30.0
- Schools +3.3/10.0
- 1% rule +2.5/10.0
- Rent growth +2.5/5.0
- Livability +2.5/5.0
- Condition / age +2.5/5.0
- DSCR +1.8/10.0
$198,900
🖨 Deal sheet 📄 Offer letter ✓ Due diligence
Listing remarks MLS
Start packing! This home is ready to move in! Totally redone-new roof, new kitchen, new bath, new flooring, sliders to deck, great yard, and low cost. Municipal electric heat.
Key facts
- 6,240 sq ft lot
- Parking
- Built 1995
Property features AI
Exterior
- Parking: Driveway parking (no garage)
- Security: Radon mitigation system
- Utilities: Public water (connected); Sewer connected
- Home design: Single-story property; Existing/resale condition; Architectural shingle roof; Facing city street
- Construction: Stone and vinyl siding exterior; Insulated attic/crawl hatchway(s); Block foundation
- Exterior features: Blacktop driveway; Open porch; Deck; Shed/storage
Interior
- Kitchen: Electric oven and range; Microwave; Refrigerator; Eat-in kitchen
- Bedrooms: 3 bedrooms on the main level
- Flooring: Hardwood; Vinyl; Varied flooring
- Bathrooms: 1 full bathroom on the main level
- Heating & cooling: Electric baseboard heating
- Interior features: Ceiling fans; Eat-in kitchen; Bedroom on main level; Full basement
- Laundry & utility: Washer; Dryer; Electric water heater
Neighborhood map
What this means for you Summary
Snapshot
- This is a 3-bed/1.0-bath single-family listed at $199k.
Deal economics
- At list price, monthly cash flow is $-227 ($-3k/yr) — negative.
- To cash-flow at today's rent, offer at most $159k (20.1% below list).
- To meet the 1% rule (rent ≥ 1% of price), the offer needs to be $150k (24.6% below list).
- Recommended offer: $150k (24.6% below list) — sets the bar for 1% rule.
Location & tenants
- Location reads: area grade D — affects rentability + tenant quality, not the cash-flow math above.
- Frankfort-Schuyler Central School District (town): math 32% / reading 45% proficiency, ranked #538 of 590 in NY (top 91%) — families likely to look elsewhere, expect single-tenant / working-renter base with shorter leases.
- Market conditions: 40 active listings in the ZIP; 1 comparable units currently listed for rent nearby; 54 units permitted in Herkimer County in 2024 (0 in 5+ unit buildings).
Forward outlook
- In year one you build about $21k of equity ($1k loan paydown + $20k appreciation (10.0% local appreciation)).
- Herkimer County population projected at -24% by 2050 — secular population decline; favor cash flow + early exit over multi-decade hold.
- By year 2, paydown + projected appreciation supports a ~$34k cash-out refi (75% LTV) — recoverable capital for the next deal without selling this one.
Negotiation context
- It's been on market 47 days — a 3% lower offer ($193k) is reasonable based on typical stale-listing flexibility.
- 3 sale attempts since 8y ago with the ask held roughly flat each time — persistent listings suggest the price (not the market) is what's stuck; bring a comps-based counter.
- Current owner paid $121k; list at $199k implies a 65% gain — meaningful room to come down on a strong offer.
Questions for the listing agent
- What do current leases actually rent for vs. the listed asking? Can we see a recent rent roll and the last 12 months of T-12 income?
- It's been on market 47 days. Have you received any prior offers? Is the seller open to a 25% concession, seller financing, or rate buy-down credit?
- Is there a deadline driving the sale (1031 exchange, divorce, estate, relocation)? That informs how much negotiation room exists.
- The area grade is low — what's the realistic commute time and amenity access for the typical tenant pool here? Any planned neighborhood developments (good or bad) we should know about?
- What's the average days-on-market for RENTAL listings here right now (not sales)? A rising rental-DOM trend means longer vacancies and softer asking-rent achievability than the comps imply.
- What's the recent tenant-quality profile in this submarket — average credit score on applications, eviction rate, late-payment / NSF rate, and stable-employment percentage? A property-management company in the area should have these aggregated.
- How much new for-sale + rental construction is in the pipeline within 1–3 miles? Heavy new supply typically softens prices + rents 12–24 months out; constrained supply supports both.
Investment metrics
- 1% rule
- 0.75% ✗
- Cap rate
- 4.93%
- Cash-on-cash
- -4.88%
- DSCR
- 0.78
- GRM
- 11.1
CMA / ARV
- ARV (on-the-fly)
- $215,040
- Comps found
- 1
Show comp detail 1 sale within ~0.75 mi
| Address | Dist | Beds/Ba | Sqft | Sold | Price | $/sf | Match |
|---|---|---|---|---|---|---|---|
| 507 1st Avenue Ext | 0.00mi | 3/1.0 | 960 (0%) | 1mo | $215,100 | $224 | 100 |
Match score weights: distance 35% · size 25% · config 20% · recency 20%. Top-matched comps best support the ARV.
Projected returns pro-forma
10.0% appreciation · 3.0% rent growth · sell at horizon
- IRR
- 20.8%
- Equity multiple
- 2.69×
- Total profit
- $93,942
- Equity at exit
- $179,185
- IRR
- 18.9%
- Equity multiple
- 6.17×
- Total profit
- $288,080
- Equity at exit
- $386,419
Cash invested: $55,692 (down + closing). Projections, not guarantees.
Landlord ↔ Tenant lean methodology
- Overall (STATE)
- 15 Strongly Tenant-Friendly
- State New York
- 15 Strongly Tenant-Friendly · D+10
- County
- — inherits STATE
- City
- — inherits STATE
ZIP-level market 13340
- Home prices YoY
- 8.1%
- Active inventory
- 40
- Price-to-rent
- 11.1×
Monthly cashflow live
- Estimated rent
- $1,500 medium interval (Pro) →
- Mortgage (P&I)
- −$1,043
- Tax from tax record
- −$286 /mo · $3,428/yr
- Insurance
- −$83
- HOA
- −$0
- Vacancy / Maint / Mgmt
- −$315
- Net cashflow
- $-227
Break-even live
UW: 25.0% down · 7.5% · 30yr · 1.5% tax · 5.0% vac · 8.0% maint · 8.0% mgmt
Financing live
Cash to close
- Down payment
- $49,725
- Closing costs
- $5,967
- Reserves months
- —
- Total cash needed
- —
Loan-product check · same deal, 3 products live
Conventional
25% down · 7.5% · 30yr
- Down + closing
- —
- Monthly P&I
- —
- Monthly cashflow
- —
- DSCR
- —
- Eligible?
- —
Personal DTI + credit; lowest rate.
DSCR
20% down · 8.5% · 30yr
- Down + closing
- —
- Monthly P&I
- —
- Monthly cashflow
- —
- DSCR
- —
- Eligible?
- —
No personal income docs; deal must DSCR.
Hard money
10% down · 12.0% · 12mo
- Down + closing
- —
- Monthly P&I
- —
- Monthly cashflow
- —
- DSCR
- —
- Eligible?
- —
Short-term bridge; refi at stabilization.
Rent comps 1 comps
| Address | Beds | Baths | Sqft | Rent | $/sqft | DOM | Units | Dist |
|---|---|---|---|---|---|---|---|---|
| 149 W North St Ilion, NY | 3.0 | 1.0 | 1056 | $1,500 | $1.42 | 43d | 1 | 1.27mi |
Listing history 7 events
-
2026-05-24status Pending
-
2026-04-11historical Active Under Contract
-
2026-04-07$198,900 Active
-
2019-09-26soldstatus $120,840 175-char remark
Show marketing remark (175 chars)
Start packing! This home is ready to move in! Totally redone-new roof, new kitchen, new bath, new flooring, sliders to deck, great yard, and low cost. Municipal electric heat.
-
2018-10-22$126,000 175-char remark
Show marketing remark (175 chars)
Start packing! This home is ready to move in! Totally redone-new roof, new kitchen, new bath, new flooring, sliders to deck, great yard, and low cost. Municipal electric heat.
-
2018-10-18historical
-
2018-07-19$132,900
ⓘ Source: listings_history table (triggers on properties + properties_extension) + one-shot
backfill from property_details.listing_events for pre-trigger history.
Tax reassessment forecast NY · Partial reset (capped growth)
- Current annual tax
- $3,428 · $286/mo
- Projected year-2 tax
- $3,428 · $286/mo
- Expected delta
- $0/yr ($0/mo · 0.0%)
ⓘ Screening estimate from a state-policy table — verify with the county assessor before closing.
Climate risk First Street
- Flood 1/10 Low FEMA zone X · 0% chance over 30 yrs
- Wildfire 1/10 Low
- Heat 3/10 Moderate 7 d/yr ≥96°F today · 17 d/yr by 30 yrs out
- Wind 2/10 Low 100% chance of damaging wind over 30 yrs
- Air quality 2/10 Low 0 unhealthy d/yr today · 1 by 30 yrs out
Nearby sold comps map
Loading sold comps map…
Walkable amenities ~0.75 mi
Loading nearby amenities…
Taxation est. · year 1
- Rental income
- $18,000
- − Mortgage interest
- −$11,141
- − Property taxes
- −$3,428
- − Insurance
- −$994
- − Repairs & maintenance
- −$1,440
- − Management
- −$1,440
- − Depreciation
- −$5,786
- Taxable loss
- −$6,230
- Est. tax savings @ 24.0%
- +$1,495
- After-tax cash flow
- $-1,224/yr
For passive investors: Depreciation is non-cash, so a rental often shows a tax loss while cash-flowing — sheltering income. Rental losses are passive: they offset passive income freely, and up to $25,000/yr can offset ordinary (W-2) income if you actively participate and your MAGI is under $100k (phasing out to $0 by $150k); unused losses carry forward. On sale, claimed depreciation is recaptured at up to 25%, and gains may owe capital-gains tax (a 1031 exchange can defer both). Figures are a year-1 estimate at your 24.0% rate — not tax advice; consult a CPA.
Schools (NCES district)
- District
- Frankfort-Schuyler Central School District
- NCES district ID
- 3611400
- Math proficiency
- 32% ▼ -12.00%
- Reading proficiency
- 45% ▲ 3.00%
- Median HH income
- $46,499
- Composite
- 32.87/100
- National rank
- #5610
- State rank
- #538 of 590 in NY
Livability — East Frankfort
No livability data for this city. (Only ~50 U.S. cities are tracked.)
Census & demographics
- Population (ZIP)
- 7,322
Population outlook (Herkimer County) Hauer SSP2
- Today (2025)
- 59,340 people
- By 2030
- 56,838 · -4.2%
- By 2040
- 51,098 · -13.9%
- By 2050
- 45,080 · -24.0%
- By 2075
- 32,648 · -45.0%
- By 2100
- 22,266 · -62.5%
Race, ethnicity, and origin ACS 2023
- Neighborhood character
- Predominantly White (91%)
- Race & ethnicity
- White 91% Two or more races 4% Black 2% Hispanic / Latino 1%
- Common ancestry
- Romanian 7% Lithuanian 3% American 2%
- Foreign-born
- 8% · Canada
- Languages at home
- 90% English-only · Russian/Polish/Slavic 6% Other Indo-European 2% Spanish 1%
Political lean MEDSL · Herkimer
- 2024 margin
- Solid R (+36.4) · D 31.8% · R 68.2%
- 2008→2024 swing
- -27.1pp toward R · 2008: -9.3pp · 2024: -36.4pp
- All cycles
- 2024: R+36.4 2020: R+30.5 2016: R+34.5 2012: R+8.4 2008: R+9.3
Not yet ingested
- Civics
- —
Market trends
- HPI YoY
- ▲ 25.15%
- Current HPI
- 336.077
- Rent YoY
- —
- Metro
- —
- State GDP YoY
- ▲ 2.60%
- F500 in state
- 92
Industry mix (Fortune 500 HQ in NY)
| Industry | F500 HQs | Revenue |
|---|---|---|
| Financial Services | 10 | $950B |
|
||
| Consumer Goods | 9 | $162B |
|
||
| Insurance | 4 | $225B |
|
||
| Telecommunications | 2 | $144B |
|
||
| Pharmaceuticals | 2 | $112B |
|
||
| Media / Entertainment | 2 | $69B |
|
||
Price history
+49.7% since first listed7 events — show timeline
- 2026-05-24 Pending — CNYIS
- 2026-04-11 Contingent — CNYIS
- 2026-04-07 Listed $198,900 CNYIS
- 2019-09-26 Sold (MLS) $120,840 CNYIS
- 2018-10-22 Listed $126,000 CNYIS
- 2018-10-18 Listing Removed — CNYIS
- 2018-07-19 Listed $132,900 CNYIS
Property tax history
+3.2%/yrLatest (2025): $3,428 · +1.0% YoY. Source: county tax records.
Cash-flow waterfall
monthlySold comps — $/sqft
last 12 mo · ≤1 miLoading sold comps…