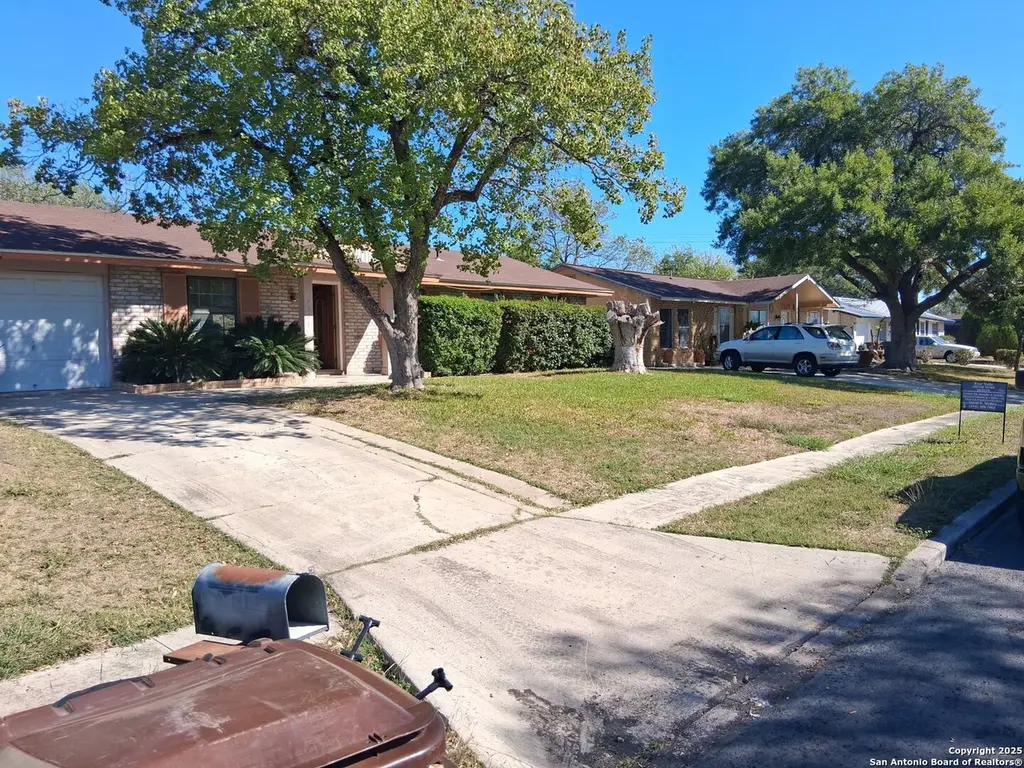
7331 Glen Mnr · San Antonio, TX
Flood risk 1/10 · Minimal
- FEMA flood zone
- X (unshaded)
- Chance of flooding over 30 yrs
- 0.0%
- Est. flood insurance / yr
- $507 – $1,088
Fire risk 2/10 · Minimal
- Est. fire insurance / yr
- $1,222 – $2,270
Heat risk 8/10 · Major
- Hot days now (above 108°F)
- 7 days/yr
- Hot days in 30 yrs
- 22 days/yr
Wind risk 8/10 · Major
- Chance of severe wind over 30 yrs
- 80.0%
Air-quality risk 1/10 · Minimal
- Unhealthy air days now
- 0 days/yr
- Unhealthy air days in 30 yrs
- 0 days/yr
Risk factors via First Street. Map © Google.
Why this score? — see what drove the C+ grade
The composite is a weighted blend of 9 inputs, each scored 0–100. Each bar is that input's sub-score; the figure is the points it added to the 100-point composite (weight × sub-score).
- Cash flow +20.7/30.0
- ARV discount +15.0/15.0
- DSCR +6.6/10.0
- 1% rule +5.8/10.0
- Livability +4.0/5.0
- Schools +3.8/10.0
- Condition / age +2.5/5.0
- Rent growth +2.2/5.0
- Appreciation +0.0/10.0
$150,000
🖨 Deal sheet (PDF) 📄 Offer letter ✓ Due diligence
Listing remarks MLS
Come check out this 4 bedroom 2 bathroom 1 car garage home that is located on a cul-de-sac. This home as ceramic tile throughout the house. Big kitchen with nice countertops and cabinets, eat-in kitchen that leads out to the backyard that has a covered patio. Very nice curb appeal with plants, shrubs and mature trees.
Key facts
- Big kitchen
- Covered patio
- Curb appeal
Tags
Neighborhood map
What this means for you Summary
Snapshot
- This is a 4-bed/2.0-bath single-family listed at $150k.
Deal economics
- At list price, monthly cash flow is $202 ($2k/yr) — positive.
- The deal already cash-flows at list — no discount required.
- Meets the 1% rule at list price ($2k rent vs $150k).
- Recommended offer: $132k (12.0% below list) — sets the bar for market timing.
- Cap rate 7.9% vs local median 3.8% in San Antonio — top-decile yield for the area; either an underpriced asset or a hidden risk that comps aren't pricing in. Stress-test before assuming the spread holds.
Location & tenants
- Location reads 80/100 on livability (#31 in TX, #1,616 nationally) — a professional / high-income tenant draw. Strengths: amenities A+, commute A+, cost of living A+; Watch: schools C-, crime F.
- North East ISD (urban): math 38% / reading 49% proficiency, ranked #276 of 826 in TX (top 33%) — families likely to look elsewhere, expect single-tenant / working-renter base with shorter leases.
- Market conditions: Rents soft (-1.1%/yr); 213 active listings in the ZIP; 40 comparable units currently listed for rent nearby; rentals at typical pace (median 25d on market — plan ~3-4 weeks tenant-placement turnaround); 40% of comp listings sitting > 30 days — soft ceiling on asking rent; 8,308 units permitted in Bexar County in 2024 (2,506 in 5+ unit buildings).
Forward outlook
- Local home prices are declining (-3.0%/yr); year-one equity from $1k of loan paydown is wiped out by about $4k of value loss. Plan a longer hold.
- Bexar County population projected at +50% by 2050 — long-run rental-demand tailwind backs the buy-and-hold thesis.
Negotiation context
- It's been on market 209 days — a 12% lower offer ($132k) is reasonable based on typical stale-listing flexibility.
- 4 sale attempts since 18y ago; this cycle's ask has dropped $15k (9%) from the opening price — seller is motivated, your offer sets the floor, not the list.
Risks & watch-outs
- Climate carrying-cost: severe wind risk, 80% chance of damaging wind over 30y; extreme-heat days projected 7→22/yr by 2055 (HVAC capex compounding) — expect insurance premiums to compound above CPI over the hold.
Questions for the listing agent
- It's been on market 209 days. Have you received any prior offers? Is the seller open to a 12% concession, seller financing, or rate buy-down credit?
- Built in 1972 — when were the roof, HVAC, electrical panel, plumbing, and water heater last replaced?
- Why hasn't it sold? Are there any deal-killer items the seller is aware of (foundation, flood, title, zoning, code violations)?
- Is there a deadline driving the sale (1031 exchange, divorce, estate, relocation)? That informs how much negotiation room exists.
- Crime grade is F in this area — have there been break-ins, vandalism, or insurance claims at this property in the last 3 years? What carrier currently insures it and at what premium?
- What's the average days-on-market for RENTAL listings here right now (not sales)? A rising rental-DOM trend means longer vacancies and softer asking-rent achievability than the comps imply.
- What's the recent tenant-quality profile in this submarket — average credit score on applications, eviction rate, late-payment / NSF rate, and stable-employment percentage? A property-management company in the area should have these aggregated.
- How much new for-sale + rental construction is in the pipeline within 1–3 miles? Heavy new supply typically softens prices + rents 12–24 months out; constrained supply supports both.
Investment metrics
- 1% rule
- 1.08% ✓
- Cap rate
- 7.91%
- Cash-on-cash
- 5.78%
- DSCR
- 1.26
- GRM
- 7.7
CMA / ARV
- ARV (median comp)
- $188,817
- List price
- $150,000
- Delta
- -20.56%
- Verdict
- UNDERPRICED
- Comps
- 20 within 1.0 mi
Show comp detail 12 sales within ~0.75 mi
| Address | Dist | Beds/Ba | Sqft | Sold | Price | $/sf | Match |
|---|---|---|---|---|---|---|---|
| 7207 Glen Pt | 0.23mi | 3/1.0 (-1) | 1,152 (+7%) | 6mo | $99,000 | $86 | 63 |
| 7307 Glen Arbor | 0.11mi | 3/1.5 (-1) | 980 (-9%) | 13mo | $159,100 | $162 | 62 |
| 8110 Whistler | 0.23mi | 3/2.0 (-1) | 960 (-11%) | 5mo | $160,000 | $167 | 62 |
| 7322 Goya | 0.25mi | 3/2.0 (-1) | 1,156 (+8%) | 12mo | $150,000 | $130 | 61 |
| 7314 Montgomery Dr | 0.15mi | 3/2.0 (-1) | 1,205 (+12%) | 14mo | $200,000 | $166 | 56 |
| 7110 Glen Grv | 0.24mi | 3/2.0 (-1) | 1,226 (+14%) | 6mo | $170,000 | $139 | 56 |
| 7350 Rubens | 0.21mi | 3/2.0 (-1) | 1,186 (+10%) | 17mo | $129,900 | $110 | 54 |
| 8200 Glen Lark | 0.27mi | 3/1.0 (-1) | 948 (-12%) | 8mo | $82,000 | $86 | 52 |
| 8239 Glen Lark | 0.39mi | 3/1.0 (-1) | 1,188 (+10%) | 5mo | $139,000 | $117 | 51 |
| 7011 Glen Ledge | 0.75mi | 4/2.0 | 1,091 (+2%) | 18mo | $106,000 | $97 | 48 |
| 7227 Glen Pt | 0.18mi | 3/1.0 (-1) | 924 (-14%) | 16mo | $180,000 | $195 | 46 |
| 7618 Glen Mdws | 0.36mi | 3/1.0 (-1) | 957 (-11%) | 14mo | $135,000 | $141 | 44 |
Match score weights: distance 35% · size 25% · config 20% · recency 20%. Top-matched comps best support the ARV.
Projected returns pro-forma
-3.0% appreciation · 0.0% rent growth · sell at horizon
- IRR
- -10.9%
- Equity multiple
- 0.62×
- Total profit
- $-16,118
- Equity at exit
- $22,365
- IRR
- -6.8%
- Equity multiple
- 0.63×
- Total profit
- $-15,590
- Equity at exit
- $12,969
Cash invested: $42,000 (down + closing). Projections, not guarantees.
Landlord ↔ Tenant lean methodology
- Overall (STATE)
- 87 Strongly Landlord-Friendly
- State Texas
- 87 Strongly Landlord-Friendly · R+5
- County
- — inherits STATE
- City
- — inherits STATE
ZIP-level market 78239
- Home prices YoY
- -5.9%
- Rents YoY
- -1.1%
- Active inventory
- 213
- Price-to-rent
- 7.7×
Monthly cashflow live
- Estimated rent
- $1,621 high interval (Pro) →
- Mortgage (P&I)
- −$787
- Tax from tax record
- −$229 /mo · $2,745/yr
- Insurance
- −$62
- HOA
- −$0
- Vacancy / Maint / Mgmt
- −$340
- Net cashflow
- $202
Break-even live
Sensitivity live
| Price | -10% $287 | -5% $245 | +0% $202 | +5% $160 | +10% $117 |
|---|---|---|---|---|---|
| Rent | -10% $74 | -5% $138 | +0% $202 | +5% $266 | +10% $330 |
| Rate | -1.0pp $278 | -0.5pp $241 | base $202 | +0.5pp $163 | +1.0pp $124 |
UW: 25.0% down · 7.5% · 30yr · 1.5% tax · 5.0% vac · 8.0% maint · 8.0% mgmt
Financing live
Cash to close
- Down payment
- $37,500
- Closing costs
- $4,500
- Reserves months
- —
- Total cash needed
- —
Loan-product check · same deal, 3 products live
Conventional
25% down · 7.5% · 30yr
- Down + closing
- —
- Monthly P&I
- —
- Monthly cashflow
- —
- DSCR
- —
- Eligible?
- —
Personal DTI + credit; lowest rate.
DSCR
20% down · 8.5% · 30yr
- Down + closing
- —
- Monthly P&I
- —
- Monthly cashflow
- —
- DSCR
- —
- Eligible?
- —
No personal income docs; deal must DSCR.
Hard money
10% down · 12.0% · 12mo
- Down + closing
- —
- Monthly P&I
- —
- Monthly cashflow
- —
- DSCR
- —
- Eligible?
- —
Short-term bridge; refi at stabilization.
Rent comps 40 comps
| Address | Beds | Baths | Sqft | Rent | $/sqft | DOM | Units | Dist |
|---|---|---|---|---|---|---|---|---|
| 7318 Glen Trl San Antonio, TX | 3.0 | 2.0 | 1226 | $1,900 | $1.55 | 44d | 1 | 0.01mi |
| 7326 Glen Trl San Antonio, TX | 4.0 | 2.0 | 1370 | $1,549 | $1.13 | 4d | 1 | 0.02mi |
| 7222 Glen Hvn San Antonio, TX | 4.0 | 2.0 | 1320 | $1,350 | $1.02 | 24d | 1 | 0.13mi |
| 7614 Glen Hurst San Antonio, TX | 3.0 | 1.0 | 1100 | $1,400 | $1.27 | 3d | 1 | 0.24mi |
| 7643 Glen Shire San Antonio, TX | 3.0 | 2.0 | 868 | $1,475 | $1.70 | 24d | 1 | 0.26mi |
| 8219 Glen Lark San Antonio, TX | 4.0 | 2.0 | 1260 | $1,250 | $0.99 | 22d | 1 | 0.31mi |
| 7237 Glen Bay San Antonio, TX | 3.0 | 2.0 | 1400 | $1,050 | $0.75 | 44d | 1 | 0.32mi |
| 7006 Glen Grv San Antonio, TX | 3.0 | 2.0 | 1036 | $1,495 | $1.44 | 44d | 1 | 0.34mi |
| 7210 John Palmer Dr Unit 101 San Antonio, TX | 3.0 | 2.5 | 1426 | $1,650 | $1.16 | 17d | 1 | 0.35mi |
| 7210 John Palmer Dr Unit 101 San Antonio, TX | 3.0 | 2.5 | 1426 | $1,700 | $1.19 | 24d | 1 | 0.35mi |
| 7603 Glen Vis San Antonio, TX | 3.0 | 2.0 | 980 | $1,200 | $1.22 | 8d | 1 | 0.37mi |
| 7904 Mallow San Antonio, TX | 3.0 | 2.0 | 1135 | $1,145 | $1.01 | 15d | 1 | 0.39mi |
| 7331 Glen Hts San Antonio, TX | 3.0 | 2.0 | 1184 | $1,390 | $1.17 | 24d | 1 | 0.43mi |
| 7138 Brecon San Antonio, TX | 3.0 | 2.5 | 1276 | $1,065 | $0.83 | 44d | 1 | 0.43mi |
| 7323 Booker Bay San Antonio, TX | 3.0 | 2.0 | 1388 | $1,495 | $1.08 | 44d | 1 | 0.46mi |
| 7042 Glen Mist San Antonio, TX | 3.0 | 2.0 | 1284 | $950 | $0.74 | 44d | 1 | 0.48mi |
| 7923 Langport San Antonio, TX | 3.0 | 2.0 | 1095 | $1,800 | $1.64 | 44d | 1 | 0.49mi |
| 7919 Wayside Trl San Antonio, TX | 3.0 | 2.0 | 1453 | $1,400 | $0.96 | 44d | 1 | 0.49mi |
| 7443 Longing Trl San Antonio, TX | 3.0 | 2.0 | 1487 | $1,495 | $1.01 | 13d | 1 | 0.50mi |
| 7223 Archers Coach San Antonio, TX | 3.0 | 2.0 | 1370 | $1,485 | $1.08 | 4d | 1 | 0.56mi |
| 6811 Avila San Antonio, TX | 3.0 | 2.0 | 1260 | $1,555 | $1.23 | 21d | 1 | 0.56mi |
| 7114 Elm Trail Dr San Antonio, TX | 3.0 | 2.0 | 1332 | $1,600 | $1.20 | 44d | 1 | 0.60mi |
| 6918 Stockport San Antonio, TX | 3.0 | 2.0 | 1390 | $1,050 | $0.76 | 44d | 1 | 0.61mi |
| 8678 Ridge Mile Dr San Antonio, TX | 3.0 | 2.0 | 1269 | $1,800 | $1.42 | 24d | 1 | 0.73mi |
| 6814 Oldham San Antonio, TX | 3.0 | 2.0 | 1238 | $1,300 | $1.05 | 24d | 1 | 0.73mi |
| 8318 Tuxford San Antonio, TX | 4.0 | 2.0 | 1452 | $1,700 | $1.17 | 5d | 1 | 0.75mi |
| 7507 Echo Trl San Antonio, TX | 3.0 | 2.0 | 1456 | $1,600 | $1.10 | 44d | 1 | 0.75mi |
| 8742 Ridge Moon Dr San Antonio, TX | 3.0 | 2.0 | 1350 | $1,489 | $1.10 | 3d | 1 | 0.76mi |
| 7134 Winding Draw San Antonio, TX | 3.0 | 2.0 | 1440 | $1,565 | $1.09 | 15d | 1 | 0.81mi |
| 7226 Winding Cloud San Antonio, TX | 3.0 | 2.0 | 1440 | $1,565 | $1.09 | 24d | 1 | 0.82mi |
| 7107 Winding Shelf San Antonio, TX | 3.0 | 1.0 | 1016 | $1,408 | $1.39 | 24d | 1 | 0.82mi |
| 7135 Grassy Trl San Antonio, TX | 3.0 | 2.0 | 1422 | $2,000 | $1.41 | 44d | 1 | 0.84mi |
| 7211 Winding Finger San Antonio, TX | 3.0 | 2.0 | 1440 | $1,515 | $1.05 | 44d | 1 | 0.84mi |
| 8515 Maple Ridge Dr San Antonio, TX | 3.0 | 2.0 | 1458 | $1,750 | $1.20 | 15d | 1 | 0.86mi |
| 6733 Montgomery Dr San Antonio, TX | 3.0 | 2.0 | 1150 | $860 | $0.75 | 44d | 2 | 0.87mi |
| 7011 Winding Shelf San Antonio, TX | 3.0 | 2.0 | 1266 | $1,449 | $1.14 | 5d | 1 | 0.87mi |
| 9034 (15/16) Glen Shadow Dr San Antonio, TX | 3.0 | 2.5 | 1225 | $1,400 | $1.14 | 44d | 1 | 0.89mi |
| 9034 (15/16) Glen Shadow Dr San Antonio, TX | 3.0 | 2.5 | 1225 | $1,550 | $1.27 | 3d | 1 | 0.89mi |
| 7858 Hedrick Farm San Antonio, TX | 3.0 | 2.5 | 1437 | $1,485 | $1.03 | 4d | 1 | 0.90mi |
| 8259 Montgomery Oak San Antonio, TX | 3.0 | 2.0 | 1152 | $1,250 | $1.09 | 44d | 5 | 0.91mi |
Listing history 16 events
-
2026-06-01days on market $150,000 Active 209 DOM
-
2026-05-31days on market $150,000 Active 208 DOM
-
2026-04-21status Back on Market 319-char remark
Show marketing remark (319 chars)
Come check out this 4 bedroom 2 bathroom 1 car garage home that is located on a cul-de-sac. This home as ceramic tile throughout the house. Big kitchen with nice countertops and cabinets, eat-in kitchen that leads out to the backyard that has a covered patio. Very nice curb appeal with plants, shrubs and mature trees.
-
2026-04-03historical Active Option 319-char remark
Show marketing remark (319 chars)
Come check out this 4 bedroom 2 bathroom 1 car garage home that is located on a cul-de-sac. This home as ceramic tile throughout the house. Big kitchen with nice countertops and cabinets, eat-in kitchen that leads out to the backyard that has a covered patio. Very nice curb appeal with plants, shrubs and mature trees.
-
2026-02-13price $150,000 319-char remark
Show marketing remark (319 chars)
Come check out this 4 bedroom 2 bathroom 1 car garage home that is located on a cul-de-sac. This home as ceramic tile throughout the house. Big kitchen with nice countertops and cabinets, eat-in kitchen that leads out to the backyard that has a covered patio. Very nice curb appeal with plants, shrubs and mature trees.
-
2026-01-06price $160,000 319-char remark
Show marketing remark (319 chars)
Come check out this 4 bedroom 2 bathroom 1 car garage home that is located on a cul-de-sac. This home as ceramic tile throughout the house. Big kitchen with nice countertops and cabinets, eat-in kitchen that leads out to the backyard that has a covered patio. Very nice curb appeal with plants, shrubs and mature trees.
-
2025-11-05price $170,000 319-char remark
Show marketing remark (319 chars)
Come check out this 4 bedroom 2 bathroom 1 car garage home that is located on a cul-de-sac. This home as ceramic tile throughout the house. Big kitchen with nice countertops and cabinets, eat-in kitchen that leads out to the backyard that has a covered patio. Very nice curb appeal with plants, shrubs and mature trees.
-
2025-11-04$165,000 New 319-char remark
Show marketing remark (319 chars)
Come check out this 4 bedroom 2 bathroom 1 car garage home that is located on a cul-de-sac. This home as ceramic tile throughout the house. Big kitchen with nice countertops and cabinets, eat-in kitchen that leads out to the backyard that has a covered patio. Very nice curb appeal with plants, shrubs and mature trees.
-
2010-12-07soldstatus 352-char remark
Show marketing remark (352 chars)
4 bedrooms 2 bath home with single car garage open living room-Great investment opportunity-needs a little TLC-selling in as-is condition-seller will not contribute or allow any repairs prior to closing-seller will not pay for title policy-seller is exempt from sellers disclosure-Hurry wont last long-please allow 48-72 hours for response from seller.
-
2010-11-12historical 352-char remark
Show marketing remark (352 chars)
4 bedrooms 2 bath home with single car garage open living room-Great investment opportunity-needs a little TLC-selling in as-is condition-seller will not contribute or allow any repairs prior to closing-seller will not pay for title policy-seller is exempt from sellers disclosure-Hurry wont last long-please allow 48-72 hours for response from seller.
-
2010-10-06$32,900 352-char remark
Show marketing remark (352 chars)
4 bedrooms 2 bath home with single car garage open living room-Great investment opportunity-needs a little TLC-selling in as-is condition-seller will not contribute or allow any repairs prior to closing-seller will not pay for title policy-seller is exempt from sellers disclosure-Hurry wont last long-please allow 48-72 hours for response from seller.
-
2008-05-20soldstatus
-
2008-05-16soldstatus
-
2008-01-24$65,000
-
2003-08-06soldstatus
-
1982-06-01soldstatus
ⓘ Source: listings_history table (triggers on properties + properties_extension) + one-shot
backfill from property_details.listing_events for pre-trigger history.
Tax reassessment forecast TX · Resets to sale price
- Current annual tax
- $2,745 · $229/mo
- Projected year-2 tax
- $2,745 · $229/mo
- Expected delta
- $0/yr ($0/mo · 0.0%)
ⓘ Screening estimate from a state-policy table — verify with the county assessor before closing.
Climate risk First Street
- Flood 1/10 Low FEMA zone X (unshaded) · 0% chance over 30 yrs
- Wildfire 2/10 Low
- Heat 8/10 Severe 7 d/yr ≥108°F today · 22 d/yr by 30 yrs out
- Wind 8/10 Severe 80% chance of damaging wind over 30 yrs
- Air quality 1/10 Low 0 unhealthy d/yr today · 0 by 30 yrs out
Nearby sold comps map
Loading sold comps map…
Walkable amenities ~0.75 mi
Loading nearby amenities…
Taxation est. · year 1
- Rental income
- $19,446
- − Mortgage interest
- −$8,402
- − Property taxes
- −$2,745
- − Insurance
- −$750
- − Repairs & maintenance
- −$1,556
- − Management
- −$1,556
- − Depreciation
- −$4,364
- Taxable income
- $74
- Est. tax owed @ 24.0%
- −$18
- After-tax cash flow
- $2,411/yr
For passive investors: Depreciation is non-cash, so a rental often shows a tax loss while cash-flowing — sheltering income. Rental losses are passive: they offset passive income freely, and up to $25,000/yr can offset ordinary (W-2) income if you actively participate and your MAGI is under $100k (phasing out to $0 by $150k); unused losses carry forward. On sale, claimed depreciation is recaptured at up to 25%, and gains may owe capital-gains tax (a 1031 exchange can defer both). Figures are a year-1 estimate at your 24.0% rate — not tax advice; consult a CPA.
Schools (NCES district)
- District
- North East ISD
- NCES district ID
- 4832940
- Math proficiency
- 38% ▼ -14.00%
- Reading proficiency
- 49% ▼ -4.00%
- Median HH income
- $57,715
- Composite
- 38.1/100
- National rank
- #4276
- State rank
- #276 of 826 in TX
Livability — San Antonio
- Score
- 80/100
- State rank
- #31
- US rank
- #1616
Category grades
Schools grade is shown separately in the Schools card above.
Census & demographics
- County
- Bexar County · 1,990,555 people
- City population
- 1,806,925
- Metro
- San Antonio-New Braunfels, TX
- Population (ZIP)
- 28,609
- Household income
- $70,098
- Rent vs Own
- Severe rent burden
- 488.0
Population outlook (Bexar County) Hauer SSP2
- Today (2025)
- 2,336,851 people
- By 2030
- 2,560,728 · +9.6%
- By 2040
- 3,020,569 · +29.3%
- By 2050
- 3,493,522 · +49.5%
- By 2075
- 4,668,459 · +99.8%
- By 2100
- 5,533,242 · +136.8%
Race, ethnicity, and origin ACS 2023
- Neighborhood character
- Diverse neighborhood (Simpson 0.66)
- Race & ethnicity
- Hispanic / Latino 47% White 30% Two or more races 20% Black 16% Asian 4% Pacific Islander 2%
- Hispanic origin (detail)
- Mexican 38% Puerto Rican 4%
- Common ancestry
- Lithuanian 2% Romanian 1% Slovak 1%
- Foreign-born
- 13% · Canada, Vietnam, Jamaica
- Languages at home
- 72% English-only · Spanish 24% Vietnamese 1% Chinese 1%
Political lean MEDSL · Bexar
- 2024 margin
- Lean D (+9.8) · D 54.3% · R 44.6% · Other 1.1%
- 2008→2024 swing
- +4.2pp toward D · 2008: 5.6pp · 2024: 9.8pp
- All cycles
- 2024: D+9.8 2020: D+18.2 2016: D+13.5 2012: D+4.6 2008: D+5.6
Not yet ingested
- Civics
- —
Market trends
- HPI YoY
- ▼ -15.13%
- Current HPI
- 242.1272
- Rent YoY
- ▼ -1.05%
- Metro
- San Antonio-New Braunfels, TX
- State GDP YoY
- ▲ 3.95%
- F500 in state
- 110
Industry mix (Fortune 500 HQ in TX)
| Industry | F500 HQs | Revenue |
|---|---|---|
| Energy | 16 | $1,198B |
|
||
| Technology | 5 | $198B |
|
||
| Engineering / Construction | 4 | $72B |
|
||
| Energy Services | 3 | $60B |
|
||
| Utilities | 3 | $41B |
|
||
| Healthcare | 2 | $330B |
|
||
Price history
+130.8% since first listed14 events — show timeline
- 2026-04-21 Relisted — LERA
- 2026-04-03 Contingent — LERA
- 2026-02-13 Price Changed $150,000 LERA
- 2026-01-06 Price Changed $160,000 LERA
- 2025-11-05 Price Changed $170,000 LERA
- 2025-11-04 Listed $165,000 LERA
- 2010-12-07 Sold (MLS) — LERA
- 2010-11-12 Listing Removed — LERA
- 2010-10-06 Listed $32,900 LERA
- 2008-05-20 Sold (Public Records) — Public Records
- 2008-05-16 Sold (MLS) — LERA
- 2008-01-24 Listed $65,000 LERA
- 2003-08-06 Sold (Public Records) — Public Records
- 1982-06-01 Sold (Public Records) — Public Records
Property tax history
+7.7%/yrLatest (2025): $2,745 · -1.0% YoY. Source: county tax records.
Cash-flow waterfall
monthlySold comps — $/sqft
last 12 mo · ≤1 miLoading sold comps…