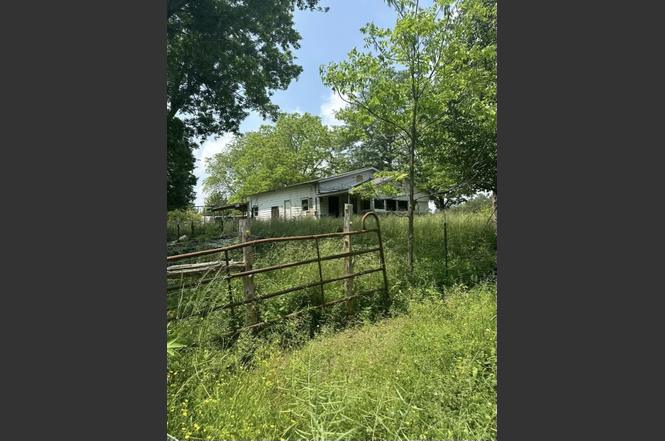
1031 Ridge Rd · Nixon, TN
Flood risk No data
- FEMA flood zone
- —
- Chance of flooding over 30 yrs
- —
- Est. flood insurance / yr
- —
Fire risk No data
- Est. fire insurance / yr
- —
Heat risk No data
- Hot days now (above threshold)
- —
- Hot days in 30 yrs
- —
Wind risk No data
- Chance of severe wind over 30 yrs
- —
Air-quality risk No data
- Unhealthy air days now
- —
- Unhealthy air days in 30 yrs
- —
Risk factors via First Street. Map © Google.
Why this score? — see what drove the B- grade
The composite is a weighted blend of 9 inputs, each scored 0–100. Each bar is that input's sub-score; the figure is the points it added to the 100-point composite (weight × sub-score).
- Cash flow +25.7/30.0
- Appreciation +10.0/10.0
- DSCR +8.6/10.0
- ARV discount +7.5/15.0
- 1% rule +7.0/10.0
- Rent growth +2.5/5.0
- Livability +2.5/5.0
- Condition / age +2.5/5.0
- Schools +2.3/10.0
$69,999
🖨 Deal sheet 📄 Offer letter ✓ Due diligence
Listing remarks
Nestled on 4.77 acres in Hardin County, just 8 minutes past Pickwick Dam, this charming 1905 home is a diamond in the rough. With over 1,000 square feet, the house features 2 bedrooms and is already plumbed for a full bathroom and laundry room. New sub flooring has been installed, the foundation has been inspected and repaired, and it’s equipped with electricity and a well. The property also includes a chicken coop and 2 lean-tos. While it needs some work, this property offers endless potential to create your dream home in a peaceful, rural setting.
Key facts
- Garage
- Built 1905
- Listed 114 days
Neighborhood map
What this means for you Summary
Snapshot
- This is a 2-bed/1.0-bath single-family listed at $70k.
Deal economics
- At list price, monthly cash flow is $168 ($2k/yr) — positive.
- The deal already cash-flows at list — no discount required.
- Meets the 1% rule at list price ($840 rent vs $70k).
- Recommended offer: $64k (9.0% below list) — sets the bar for market timing.
Location & tenants
- Location reads: area grade B — affects rentability + tenant quality, not the cash-flow math above.
- Hardin County (rural): math 27% / reading 28% proficiency, ranked #76 of 139 in TN (top 55%) — low school quality limits family demand, transient renter base, plan for 1-2y turnover.
- Market conditions: 385 active listings in the ZIP; 24 units permitted in Hardin County in 2024 (0 in 5+ unit buildings).
Forward outlook
- In year one you build about $7k of equity ($484 loan paydown + $7k appreciation (10.0% local appreciation)).
- Hardin County population projected at -17% by 2050 — secular population decline; favor cash flow + early exit over multi-decade hold.
- At projected returns (10.0% appreciation + 3.0% rent growth), your $20k cash investment doubles in ~2 years — after that, you're playing with house money.
- By year 5, paydown + projected appreciation supports a ~$35k cash-out refi (75% LTV) — recoverable capital for the next deal without selling this one.
Negotiation context
- It's been on market 114 days — a 9% lower offer ($64k) is reasonable based on typical stale-listing flexibility.
- 9 sale attempts since 12y ago; this cycle's ask has dropped $5k (7%) from the opening price — seller is motivated, your offer sets the floor, not the list.
- Current owner paid $50k; 40% above their basis — modest negotiation headroom, anchor on the comps not their cost.
Risks & watch-outs
- Watch-outs: built in 1905 — expect roof / HVAC / electrical / plumbing capex.
Questions for the listing agent
- It's been on market 114 days. Have you received any prior offers? Is the seller open to a 9% concession, seller financing, or rate buy-down credit?
- Built in 1905 — when were the roof, HVAC, electrical panel, plumbing, and water heater last replaced?
- Why hasn't it sold? Are there any deal-killer items the seller is aware of (foundation, flood, title, zoning, code violations)?
- Is there a deadline driving the sale (1031 exchange, divorce, estate, relocation)? That informs how much negotiation room exists.
- What's the average days-on-market for RENTAL listings here right now (not sales)? A rising rental-DOM trend means longer vacancies and softer asking-rent achievability than the comps imply.
- What's the recent tenant-quality profile in this submarket — average credit score on applications, eviction rate, late-payment / NSF rate, and stable-employment percentage? A property-management company in the area should have these aggregated.
- How much new for-sale + rental construction is in the pipeline within 1–3 miles? Heavy new supply typically softens prices + rents 12–24 months out; constrained supply supports both.
Investment metrics
- 1% rule
- 1.20% ✓
- Cap rate
- 9.18%
- Cash-on-cash
- 10.32%
- DSCR
- 1.46
- GRM
- 6.9
CMA / ARV
No comps found within radius.
Projected returns pro-forma
10.0% appreciation · 3.0% rent growth · sell at horizon
- IRR
- 31.8%
- Equity multiple
- 3.49×
- Total profit
- $48,874
- Equity at exit
- $63,061
- IRR
- 27.5%
- Equity multiple
- 7.91×
- Total profit
- $135,527
- Equity at exit
- $135,993
Cash invested: $19,600 (down + closing). Projections, not guarantees.
Landlord ↔ Tenant lean methodology
- Overall (STATE)
- 87 Strongly Landlord-Friendly
- State Tennessee
- 87 Strongly Landlord-Friendly · R+13
- County
- — inherits STATE
- City
- — inherits STATE
ZIP-level market 38372
- Home prices YoY
- 5.5%
- Active inventory
- 385
- Price-to-rent
- 6.9×
Monthly cashflow live
- Estimated rent
- $840 medium interval (Pro) →
- Mortgage (P&I)
- −$367
- Tax from tax record
- −$99 /mo · $1,187/yr
- Insurance
- −$29
- HOA
- −$0
- Vacancy / Maint / Mgmt
- −$176
- Net cashflow
- $168
Break-even live
UW: 25.0% down · 7.5% · 30yr · 1.5% tax · 5.0% vac · 8.0% maint · 8.0% mgmt
Financing live
Cash to close
- Down payment
- $17,500
- Closing costs
- $2,100
- Reserves months
- —
- Total cash needed
- —
Loan-product check · same deal, 3 products live
Conventional
25% down · 7.5% · 30yr
- Down + closing
- —
- Monthly P&I
- —
- Monthly cashflow
- —
- DSCR
- —
- Eligible?
- —
Personal DTI + credit; lowest rate.
DSCR
20% down · 8.5% · 30yr
- Down + closing
- —
- Monthly P&I
- —
- Monthly cashflow
- —
- DSCR
- —
- Eligible?
- —
No personal income docs; deal must DSCR.
Hard money
10% down · 12.0% · 12mo
- Down + closing
- —
- Monthly P&I
- —
- Monthly cashflow
- —
- DSCR
- —
- Eligible?
- —
Short-term bridge; refi at stabilization.
Listing history 33 events
-
2026-01-17status Pending
-
2026-01-17status Pending
-
2026-01-17status Pending
-
2026-01-17status Pending
-
2026-01-16historical
-
2026-01-16historical
-
2026-01-16historical
-
2026-01-16historical
-
2025-12-26Active
-
2025-12-26Active
-
2025-12-26Active
-
2025-12-26Active
-
2025-12-22historical
-
2025-12-22historical
-
2025-12-22historical
-
2025-12-22historical
-
2025-01-17soldstatus $50,000 Closed
-
2024-12-12status Pending
-
2024-12-10historical Active Under Contract
-
2024-11-01price $64,999
-
2024-09-25price $69,999
-
2024-09-25price $69,999
-
2024-09-16status Active
-
2024-09-16status Active
-
2024-09-09historical Active Under Contract
-
2024-09-09status Pending
-
2024-08-13$75,000 Active
-
2024-08-13$75,000 Active
-
2024-08-12historical $75,000
-
2024-03-28soldstatus $1,100,000
-
2015-03-16soldstatus $42,000 Closed
-
2015-02-17status Pending
-
2014-12-12$49,000 Active
ⓘ Source: listings_history table (triggers on properties + properties_extension) + one-shot
backfill from property_details.listing_events for pre-trigger history.
Tax reassessment forecast TN · Resets to sale price
- Current annual tax
- $1,187 · $99/mo
- Projected year-2 tax
- $1,187 · $99/mo
- Expected delta
- $0/yr ($0/mo · 0.0%)
ⓘ Screening estimate from a state-policy table — verify with the county assessor before closing.
Nearby sold comps map
Loading sold comps map…
Walkable amenities ~0.75 mi
Loading nearby amenities…
Taxation est. · year 1
- Rental income
- $10,081
- − Mortgage interest
- −$3,921
- − Property taxes
- −$1,187
- − Insurance
- −$350
- − Repairs & maintenance
- −$806
- − Management
- −$806
- − Depreciation
- −$2,036
- Taxable income
- $974
- Est. tax owed @ 24.0%
- −$234
- After-tax cash flow
- $1,788/yr
For passive investors: Depreciation is non-cash, so a rental often shows a tax loss while cash-flowing — sheltering income. Rental losses are passive: they offset passive income freely, and up to $25,000/yr can offset ordinary (W-2) income if you actively participate and your MAGI is under $100k (phasing out to $0 by $150k); unused losses carry forward. On sale, claimed depreciation is recaptured at up to 25%, and gains may owe capital-gains tax (a 1031 exchange can defer both). Figures are a year-1 estimate at your 24.0% rate — not tax advice; consult a CPA.
Schools (NCES district)
- District
- Hardin County
- NCES district ID
- 4701680
- Math proficiency
- 27% ▼ -1.00%
- Reading proficiency
- 28% ▼ -1.00%
- Median HH income
- $34,404
- Composite
- 22.64/100
- National rank
- #8061
- State rank
- #76 of 139 in TN
Livability — Nixon
No livability data for this city. (Only ~50 U.S. cities are tracked.)
Census & demographics
- Census place
- Nixon, TN
- Population (ZIP)
- 17,659
Population outlook (Hardin County) Hauer SSP2
- Today (2025)
- 24,740 people
- By 2030
- 23,971 · -3.1%
- By 2040
- 22,284 · -9.9%
- By 2050
- 20,612 · -16.7%
- By 2075
- 17,072 · -31.0%
- By 2100
- 13,723 · -44.5%
Race, ethnicity, and origin ACS 2023
- Neighborhood character
- Predominantly White (89%)
- Race & ethnicity
- White 89% Two or more races 5% Black 3% Hispanic / Latino 3%
- Common ancestry
- Italian 5% Slovak 2% Danish 2%
- Foreign-born
- 1% · Canada
- Languages at home
- 97% English-only · Spanish 2% German/W. Germanic 1%
Political lean MEDSL · Hardin
- 2024 margin
- Solid R (+71.0) · D 14.1% · R 85.1%
- 2008→2024 swing
- -28.3pp toward R · 2008: -42.7pp · 2024: -71.0pp
- All cycles
- 2024: R+71.0 2020: R+67.5 2016: R+64.2 2012: R+51.6 2008: R+42.7
Not yet ingested
- Civics
- —
Market trends
- HPI YoY
- ▲ 15.20%
- Current HPI
- 293.51
- Rent YoY
- —
- Metro
- —
- State GDP YoY
- ▲ 2.78%
- F500 in state
- 22
Industry mix (Fortune 500 HQ in TN)
| Industry | F500 HQs | Revenue |
|---|---|---|
| Healthcare | 3 | $91B |
|
||
| Retail | 3 | $72B |
|
||
| Transportation / Logistics | 1 | $88B |
|
||
| Paper / Packaging | 1 | $19B |
|
||
| Insurance | 1 | $13B |
|
||
| Energy | 1 | $12B |
|
||
Price history
+2.0% since first listed33 events — show timeline
- 2026-01-17 Pending — REALTRACS as Distributed by MLS Grid
- 2026-01-17 Pending — REALTRACS as Distributed by MLS Grid
- 2026-01-17 Pending — REALTRACS as Distributed by MLS Grid
- 2026-01-17 Pending — REALTRACS as Distributed by MLS Grid
- 2026-01-16 Listing Removed — REALTRACS as Distributed by MLS Grid
- 2026-01-16 Listing Removed — REALTRACS as Distributed by MLS Grid
- 2026-01-16 Listing Removed — REALTRACS as Distributed by MLS Grid
- 2026-01-16 Listing Removed — REALTRACS as Distributed by MLS Grid
- 2025-12-26 Listed — REALTRACS as Distributed by MLS Grid
- 2025-12-26 Listed — REALTRACS as Distributed by MLS Grid
- 2025-12-26 Listed — REALTRACS as Distributed by MLS Grid
- 2025-12-26 Listed — REALTRACS as Distributed by MLS Grid
- 2025-12-22 Coming Soon — REALTRACS as Distributed by MLS Grid
- 2025-12-22 Coming Soon — REALTRACS as Distributed by MLS Grid
- 2025-12-22 Coming Soon — REALTRACS as Distributed by MLS Grid
- 2025-12-22 Coming Soon — REALTRACS as Distributed by MLS Grid
- 2025-01-17 Sold (MLS) $50,000 REALTRACS as Distributed by MLS Grid
- 2024-12-12 Pending — CWTAR
- 2024-12-10 Contingent — REALTRACS as Distributed by MLS Grid
- 2024-11-01 Price Changed $64,999 REALTRACS as Distributed by MLS Grid
- 2024-09-25 Price Changed $69,999 CWTAR
- 2024-09-25 Price Changed $69,999 REALTRACS as Distributed by MLS Grid
- 2024-09-16 Relisted — CWTAR
- 2024-09-16 Relisted — REALTRACS as Distributed by MLS Grid
- 2024-09-09 Contingent — REALTRACS as Distributed by MLS Grid
- 2024-09-09 Pending — CWTAR
- 2024-08-13 Listed $75,000 CWTAR
- 2024-08-13 Listed $75,000 REALTRACS as Distributed by MLS Grid
- 2024-08-12 Coming Soon $75,000 REALTRACS as Distributed by MLS Grid
- 2024-03-28 Sold (Public Records) $1,100,000 Public Records
- 2015-03-16 Sold (MLS) $42,000 Memphis Area Association of Realtors(R) MLS
- 2015-02-17 Pending — Memphis Area Association of Realtors(R) MLS
- 2014-12-12 Listed $49,000 Memphis Area Association of Realtors(R) MLS
Property tax history
+4.6%/yrLatest (2025): $1,187 · +0.0% YoY. Source: county tax records.
Cash-flow waterfall
monthlySold comps — $/sqft
last 12 mo · ≤1 miLoading sold comps…