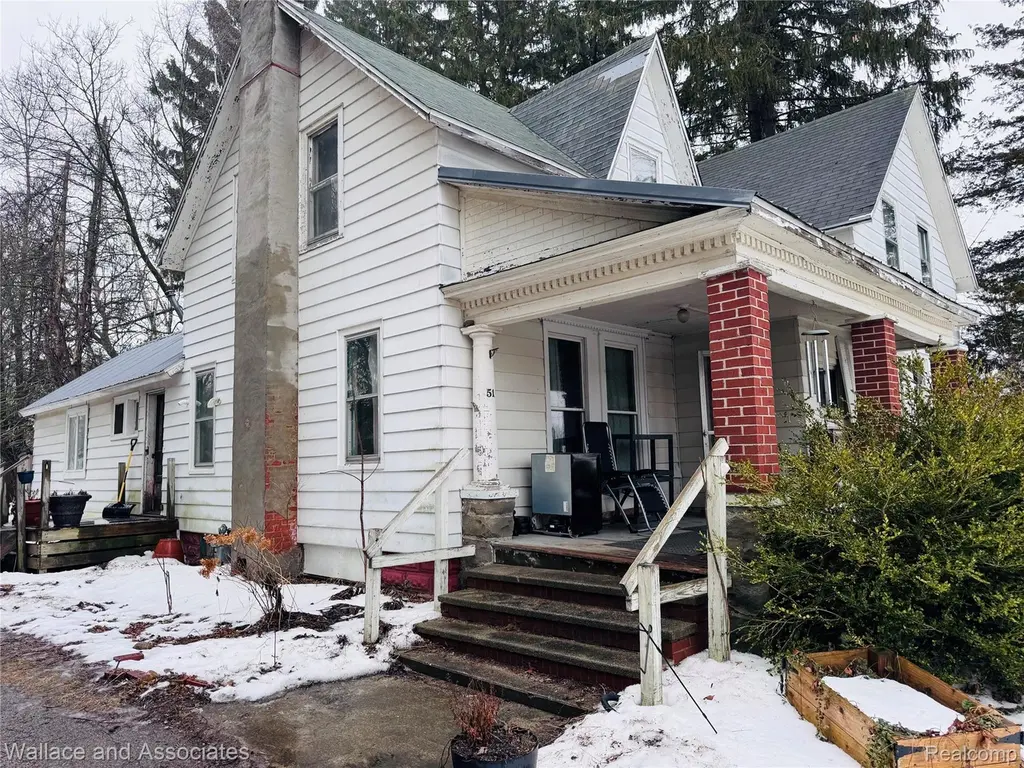
51 S Marsh St · Washington, MI
Flood risk 1/10 · Minimal
- FEMA flood zone
- X (unshaded)
- Chance of flooding over 30 yrs
- 0.0%
- Est. flood insurance / yr
- $507 – $1,088
Fire risk 1/10 · Minimal
- Est. fire insurance / yr
- $784 – $1,456
Heat risk 1/10 · Minimal
- Hot days now (above 96°F)
- 7 days/yr
- Hot days in 30 yrs
- 14 days/yr
Wind risk 1/10 · Minimal
- Chance of severe wind over 30 yrs
- —
Air-quality risk 3/10 · Minor
- Unhealthy air days now
- 2 days/yr
- Unhealthy air days in 30 yrs
- 3 days/yr
Risk factors via First Street. Map © Google.
Why this score? — see what drove the B+ grade
The composite is a weighted blend of 9 inputs, each scored 0–100. Each bar is that input's sub-score; the figure is the points it added to the 100-point composite (weight × sub-score).
- Cash flow +30.0/30.0
- ARV discount +15.0/15.0
- 1% rule +10.0/10.0
- DSCR +10.0/10.0
- Schools +3.0/10.0
- Rent growth +2.5/5.0
- Livability +2.5/5.0
- Condition / age +2.5/5.0
- Appreciation +0.0/10.0
$90,000
🖨 Deal sheet 📄 Offer letter ✓ Due diligence
Listing remarks MLS
Large 4 bedroom, 1.5 bath farmhouse located in the village of Carsonville situated on a nice size city lot. Tons of potential. Natural Gas with city water/sewer. This spacious home is awaiting new owners to make it their own. Call to schedule a showing today!
Key facts
- 0.62 acre lot
- Garage
- Listed 93 days
Neighborhood map
What this means for you Summary
Snapshot
- This is a 4-bed/1.5-bath single-family listed at $90k.
Deal economics
- At list price, monthly cash flow is $378 ($5k/yr) — positive.
- The deal already cash-flows at list — no discount required.
- Meets the 1% rule at list price ($1k rent vs $90k).
- Recommended offer: $82k (9.0% below list) — sets the bar for market timing.
Location & tenants
- Location reads: area grade B — affects rentability + tenant quality, not the cash-flow math above.
- Carsonville-Port Sanilac School District (rural): math 25% / reading 40% proficiency, ranked #498 of 760 in MI (top 66%) — families likely to look elsewhere, expect single-tenant / working-renter base with shorter leases.
- Market conditions: 20 active listings in the ZIP; 63 units permitted in Sanilac County in 2024 (0 in 5+ unit buildings).
Forward outlook
- Local home prices are declining (-3.0%/yr); year-one equity from $622 of loan paydown is wiped out by about $3k of value loss. Plan a longer hold.
- Sanilac County population projected at -31% by 2050 — secular population decline; favor cash flow + early exit over multi-decade hold.
- At projected returns (-3.0% appreciation + 3.0% rent growth), your $25k cash investment doubles in ~7 years — after that, you're playing with house money.
Negotiation context
- It's been on market 93 days — a 9% lower offer ($82k) is reasonable based on typical stale-listing flexibility.
- 2 sale attempts with the ask held roughly flat each time — persistent listings suggest the price (not the market) is what's stuck; bring a comps-based counter.
Questions for the listing agent
- It's been on market 93 days. Have you received any prior offers? Is the seller open to a 9% concession, seller financing, or rate buy-down credit?
- Why hasn't it sold? Are there any deal-killer items the seller is aware of (foundation, flood, title, zoning, code violations)?
- Is there a deadline driving the sale (1031 exchange, divorce, estate, relocation)? That informs how much negotiation room exists.
- What's the average days-on-market for RENTAL listings here right now (not sales)? A rising rental-DOM trend means longer vacancies and softer asking-rent achievability than the comps imply.
- What's the recent tenant-quality profile in this submarket — average credit score on applications, eviction rate, late-payment / NSF rate, and stable-employment percentage? A property-management company in the area should have these aggregated.
- How much new for-sale + rental construction is in the pipeline within 1–3 miles? Heavy new supply typically softens prices + rents 12–24 months out; constrained supply supports both.
Investment metrics
- 1% rule
- 1.51% ✓
- Cap rate
- 11.34%
- Cash-on-cash
- 18.02%
- DSCR
- 1.80
- GRM
- 5.5
CMA / ARV
- ARV (median comp)
- $158,380
- List price
- $90,000
- Delta
- -43.17%
- Verdict
- UNDERPRICED
- Comps
- 13 within 1.0 mi
Show comp detail 2 sales within ~0.75 mi
| Address | Dist | Beds/Ba | Sqft | Sold | Price | $/sf | Match |
|---|---|---|---|---|---|---|---|
| 32 S High St | 0.12mi | 5/1.5 (+1) | 2,085 (+4%) | 14mo | $137,000 | $66 | 71 |
| 3927 W Sheldon Rd | 0.11mi | 3/2.0 (-1) | 1,798 (-10%) | 12mo | $35,000 | $19 | 61 |
Match score weights: distance 35% · size 25% · config 20% · recency 20%. Top-matched comps best support the ARV.
Projected returns pro-forma
-3.0% appreciation · 3.0% rent growth · sell at horizon
- IRR
- 9.6%
- Equity multiple
- 1.38×
- Total profit
- $9,575
- Equity at exit
- $13,419
- IRR
- 18.8%
- Equity multiple
- 2.57×
- Total profit
- $39,624
- Equity at exit
- $7,782
Cash invested: $25,200 (down + closing). Projections, not guarantees.
Landlord ↔ Tenant lean methodology
- Overall (STATE)
- 62 Landlord-Friendly
- State Michigan
- 62 Landlord-Friendly · EVEN
- County
- — inherits STATE
- City
- — inherits STATE
ZIP-level market 48419
- Home prices YoY
- -6.8%
- Active inventory
- 20
- Price-to-rent
- 5.5×
Monthly cashflow live
- Estimated rent
- $1,355 medium interval (Pro) →
- Mortgage (P&I)
- −$472
- Tax from tax record
- −$183 /mo · $2,193/yr
- Insurance
- −$38
- HOA
- −$0
- Vacancy / Maint / Mgmt
- −$285
- Net cashflow
- $378
Break-even live
UW: 25.0% down · 7.5% · 30yr · 1.5% tax · 5.0% vac · 8.0% maint · 8.0% mgmt
Financing live
Cash to close
- Down payment
- $22,500
- Closing costs
- $2,700
- Reserves months
- —
- Total cash needed
- —
Loan-product check · same deal, 3 products live
Conventional
25% down · 7.5% · 30yr
- Down + closing
- —
- Monthly P&I
- —
- Monthly cashflow
- —
- DSCR
- —
- Eligible?
- —
Personal DTI + credit; lowest rate.
DSCR
20% down · 8.5% · 30yr
- Down + closing
- —
- Monthly P&I
- —
- Monthly cashflow
- —
- DSCR
- —
- Eligible?
- —
No personal income docs; deal must DSCR.
Hard money
10% down · 12.0% · 12mo
- Down + closing
- —
- Monthly P&I
- —
- Monthly cashflow
- —
- DSCR
- —
- Eligible?
- —
Short-term bridge; refi at stabilization.
Listing history 4 events
-
2026-02-20price $90,000 259-char remark
Show marketing remark (259 chars)
Large 4 bedroom, 1.5 bath farmhouse located in the village of Carsonville situated on a nice size city lot. Tons of potential. Natural Gas with city water/sewer. This spacious home is awaiting new owners to make it their own. Call to schedule a showing today!
-
2026-02-19$89,900 Active 259-char remark
Show marketing remark (259 chars)
Large 4 bedroom, 1.5 bath farmhouse located in the village of Carsonville situated on a nice size city lot. Tons of potential. Natural Gas with city water/sewer. This spacious home is awaiting new owners to make it their own. Call to schedule a showing today!
ⓘ Source: listings_history table (triggers on properties + properties_extension) + one-shot
backfill from property_details.listing_events for pre-trigger history.
Tax reassessment forecast MI · Partial reset (capped growth)
- Current annual tax
- $2,193 · $183/mo
- Projected year-2 tax
- $2,193 · $183/mo
- Expected delta
- $0/yr ($0/mo · 0.0%)
ⓘ Screening estimate from a state-policy table — verify with the county assessor before closing.
Climate risk First Street
- Flood 1/10 Low FEMA zone X (unshaded) · 0% chance over 30 yrs
- Wildfire 1/10 Low
- Heat 1/10 Low 7 d/yr ≥96°F today · 14 d/yr by 30 yrs out
- Wind 1/10 Low
- Air quality 3/10 Moderate 2 unhealthy d/yr today · 3 by 30 yrs out
Nearby sold comps map
Loading sold comps map…
Walkable amenities ~0.75 mi
Loading nearby amenities…
Taxation est. · year 1
- Rental income
- $16,261
- − Mortgage interest
- −$5,041
- − Property taxes
- −$2,193
- − Insurance
- −$450
- − Repairs & maintenance
- −$1,301
- − Management
- −$1,301
- − Depreciation
- −$2,618
- Taxable income
- $3,357
- Est. tax owed @ 24.0%
- −$806
- After-tax cash flow
- $3,734/yr
For passive investors: Depreciation is non-cash, so a rental often shows a tax loss while cash-flowing — sheltering income. Rental losses are passive: they offset passive income freely, and up to $25,000/yr can offset ordinary (W-2) income if you actively participate and your MAGI is under $100k (phasing out to $0 by $150k); unused losses carry forward. On sale, claimed depreciation is recaptured at up to 25%, and gains may owe capital-gains tax (a 1031 exchange can defer both). Figures are a year-1 estimate at your 24.0% rate — not tax advice; consult a CPA.
Schools (NCES district)
- District
- Carsonville-Port Sanilac School District
- NCES district ID
- 2608160
- Math proficiency
- 25% ▬ 0.00%
- Reading proficiency
- 40% ▲ 15.00%
- Median HH income
- $40,981
- Composite
- 30.12/100
- National rank
- #11603
- State rank
- #498 of 760 in MI
Livability — Washington
No livability data for this city. (Only ~50 U.S. cities are tracked.)
Census & demographics
- Census place
- Carsonville, MI
- City population
- 20,736
- Population (ZIP)
- 2,309
Population outlook (Sanilac County) Hauer SSP2
- Today (2025)
- 37,948 people
- By 2030
- 35,772 · -5.7%
- By 2040
- 30,996 · -18.3%
- By 2050
- 26,280 · -30.7%
- By 2075
- 17,471 · -54.0%
- By 2100
- 10,572 · -72.1%
Race, ethnicity, and origin ACS 2023
- Neighborhood character
- Predominantly White (89%)
- Race & ethnicity
- White 89% Hispanic / Latino 7% Two or more races 6%
- Hispanic origin (detail)
- Mexican 6%
- Common ancestry
- Romanian 9% Lithuanian 4% Slovak 4%
- Foreign-born
- 2% · Canada
- Languages at home
- 95% English-only · Spanish 4%
Political lean MEDSL · Sanilac
- 2024 margin
- Solid R (+47.7) · D 25.5% · R 73.2% · Other 1.3%
- 2008→2024 swing
- -39.6pp toward R · 2008: -8.1pp · 2024: -47.7pp
- All cycles
- 2024: R+47.7 2020: R+45.6 2016: R+44.5 2012: R+20.4 2008: R+8.1
Not yet ingested
- Civics
- —
Market trends
- HPI YoY
- ▼ -16.27%
- Current HPI
- 223.5117
- Rent YoY
- —
- Metro
- —
- State GDP YoY
- ▲ 1.37%
- F500 in state
- 28
Industry mix (Fortune 500 HQ in MI)
| Industry | F500 HQs | Revenue |
|---|---|---|
| Automotive Parts | 3 | $48B |
|
||
| Automotive | 2 | $372B |
|
||
| Chemicals | 1 | $45B |
|
||
| Automotive Retail | 1 | $29B |
|
||
| Healthcare / Medical Devices | 1 | $23B |
|
||
| Automotive Technology | 1 | $20B |
|
||
Price history
+0.1% since first listed4 events — show timeline
- 2026-02-20 Price Changed $90,000 MiRealSource-MiMLS
- 2026-02-20 Price Changed $90,000 REALCOMP
- 2026-02-19 Listed $89,900 REALCOMP
- 2026-02-19 Listed $89,900 MiRealSource-MiMLS
Property tax history
+12.4%/yrLatest (2025): $2,193 · -11.4% YoY. Source: county tax records.
Cash-flow waterfall
monthlySold comps — $/sqft
last 12 mo · ≤1 miLoading sold comps…