2033 Oakview Road Rd · Ashland, KY
Flood risk 1/10 · Minimal
- FEMA flood zone
- X (unshaded)
- Chance of flooding over 30 yrs
- 0.0%
- Est. flood insurance / yr
- $473 – $860
Fire risk 1/10 · Minimal
- Est. fire insurance / yr
- $839 – $1,559
Heat risk 4/10 · Minor
- Hot days now (above 102°F)
- 7 days/yr
- Hot days in 30 yrs
- 19 days/yr
Wind risk 2/10 · Minimal
- Chance of severe wind over 30 yrs
- 2.0%
Air-quality risk 2/10 · Minimal
- Unhealthy air days now
- 0 days/yr
- Unhealthy air days in 30 yrs
- 1 days/yr
Risk factors via First Street. Map © Google.
Why this score? — see what drove the B+ grade
The composite is a weighted blend of 9 inputs, each scored 0–100. Each bar is that input's sub-score; the figure is the points it added to the 100-point composite (weight × sub-score).
- Cash flow +30.0/30.0
- ARV discount +15.0/15.0
- 1% rule +10.0/10.0
- DSCR +10.0/10.0
- Schools +3.2/10.0
- Livability +3.2/5.0
- Rent growth +2.5/5.0
- Condition / age +2.5/5.0
- Appreciation +0.0/10.0
$60,000
🖨 Deal sheet 📄 Offer letter ✓ Due diligence
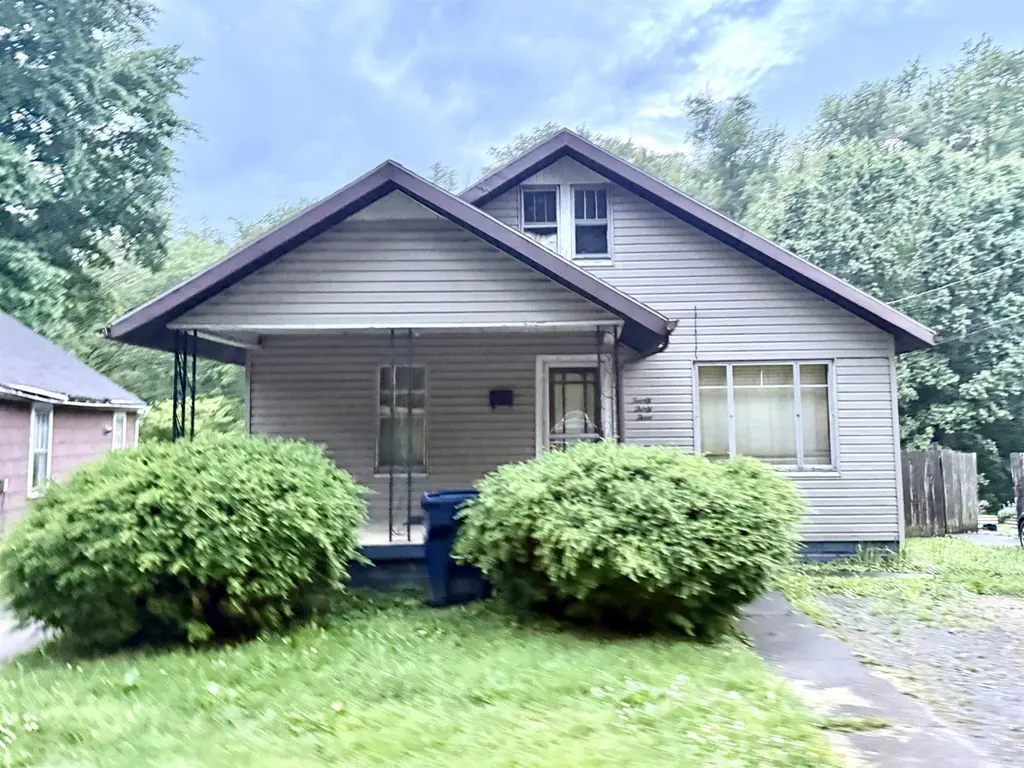
Listing remarks
This home offers investment potential, a flexible 2 to 3 bedroom layout, covered outdoor spaces, and a detached block garage on a fairly level 125-foot deep lot. Step inside to a nice-sized living room with hardwood floors and a practical main floor layout featuring two bedrooms and one full bathroom. The home is heated by a floor furnace and offers the opportunity for cosmetic updates, repairs, and a good cleanout to help bring it back to life. Upstairs, the attic room features lower ceilings and could serve as additional sleeping space, storage, an office, or a bonus area depending on your needs. The unfinished walkout basement adds useful storage and access to the exterior. Outside, enjo
Key facts
- Flexible layout
- Level lot
- Main floor layout
Tags
Property features AI
Exterior
- Parking: Detached 1-car garage
- Utilities: Public water; Public sewer
- Home design: Single-family residence; Residential property
- Construction: Vinyl siding; Composition roof; Block foundation; Approximately 920 above-grade finished area
- Exterior features: Front porch; Level lot
Interior
- Kitchen: Gas water heater
- Bedrooms: Master located downstairs
- Bathrooms: 1 full bathroom
- Heating & cooling: Floor furnace heating
- Interior features: Master bedroom on the main floor; Full unfinished walk-out basement
Neighborhood map
What this means for you Summary
Snapshot
- This is a 2-bed/1.0-bath single-family listed at $60k.
Deal economics
- At list price, monthly cash flow is $456 ($5k/yr) — positive.
- The deal already cash-flows at list — no discount required.
- Meets the 1% rule at list price ($1k rent vs $60k).
- Recommended offer: $59k (1.5% below list) — sets the bar for market timing.
- Cap rate 15.4% vs local median 5.4% in Ashland — top-decile yield for the area; either an underpriced asset or a hidden risk that comps aren't pricing in. Stress-test before assuming the spread holds.
Location & tenants
- Location reads 64/100 on livability (#304 in KY) — a middle-class / working-renter tenant base. Strengths: cost of living A+, housing A+; Watch: schools C-, amenities F, commute F.
- Ashland Independent (urban): math 32% / reading 44% proficiency, ranked #49 of 165 in KY (top 30%) — families likely to look elsewhere, expect single-tenant / working-renter base with shorter leases.
- Market conditions: 100 active listings in the ZIP; 2 units permitted in Boyd County in 2024 (0 in 5+ unit buildings).
Forward outlook
- Local home prices are declining (-3.0%/yr); year-one equity from $415 of loan paydown is wiped out by about $2k of value loss. Plan a longer hold.
- Boyd County population projected at -17% by 2050 — secular population decline; favor cash flow + early exit over multi-decade hold.
- At projected returns (-3.0% appreciation + 3.0% rent growth), your $17k cash investment doubles in ~4 years — after that, you're playing with house money.
Negotiation context
- It's been on market 28 days — a 2% lower offer ($59k) is reasonable based on typical stale-listing flexibility.
Risks & watch-outs
- Watch-outs: built in 1941 — expect roof / HVAC / electrical / plumbing capex.
Questions for the listing agent
- Built in 1941 — when were the roof, HVAC, electrical panel, plumbing, and water heater last replaced?
- Is there a deadline driving the sale (1031 exchange, divorce, estate, relocation)? That informs how much negotiation room exists.
- What's the average days-on-market for RENTAL listings here right now (not sales)? A rising rental-DOM trend means longer vacancies and softer asking-rent achievability than the comps imply.
- What's the recent tenant-quality profile in this submarket — average credit score on applications, eviction rate, late-payment / NSF rate, and stable-employment percentage? A property-management company in the area should have these aggregated.
- How much new for-sale + rental construction is in the pipeline within 1–3 miles? Heavy new supply typically softens prices + rents 12–24 months out; constrained supply supports both.
Investment metrics
- 1% rule
- 1.71% ✓
- Cap rate
- 15.41%
- Cash-on-cash
- 32.57%
- DSCR
- 2.45
- GRM
- 4.9
CMA / ARV
- ARV (on-the-fly)
- $91,392
- Comps found
- 12
Show comp detail 12 sales within ~0.75 mi
| Address | Dist | Beds/Ba | Sqft | Sold | Price | $/sf | Match |
|---|---|---|---|---|---|---|---|
| 1412 Wurts Ave | 0.40mi | 2/1.0 | 800 (-11%) | 1mo | $45,000 | $56 | 63 |
| 2218 Griffith Street St | 0.42mi | 3/1.0 (+1) | 912 (+2%) | 13mo | $126,100 | $138 | 61 |
| 2216 Blackburn Ave | 0.45mi | 2/1.0 | 866 (-3%) | 15mo | $115,000 | $133 | 61 |
| 2705 Blackburn Ave | 0.56mi | 3/1.0 (+1) | 900 (+0%) | 11mo | $92,000 | $102 | 59 |
| 2314 Margarette St | 0.65mi | 2/1.0 | 858 (-4%) | 4mo | $74,500 | $87 | 59 |
| 617 Long Street St | 0.64mi | 2/1.0 | 888 (-1%) | 12mo | $18,000 | $20 | 58 |
| 2427 Chinn Street St | 0.70mi | 2/1.5 | 953 (+6%) | 1mo | $142,500 | $150 | 54 |
| 465 Blackburn Avenue Ave | 0.74mi | 2/1.0 | 906 (+1%) | 14mo | $55,000 | $61 | 52 |
| 1611 Blackburn Ave Ave | 0.44mi | 2/1.0 | 1,000 (+12%) | 17mo | $139,900 | $140 | 46 |
| 2410 Roosevelt Avenue Ave | 0.46mi | 3/1.5 (+1) | 1,021 (+14%) | 2mo | $145,000 | $142 | 46 |
| 2234 Horne Street St | 0.71mi | 2/1.0 | 960 (+7%) | 12mo | $75,000 | $78 | 45 |
| 828 & 830 13th Street St | 0.62mi | 3/1.0 (+1) | 1,028 (+15%) | 10mo | $89,000 | $87 | 33 |
Match score weights: distance 35% · size 25% · config 20% · recency 20%. Top-matched comps best support the ARV.
Projected returns pro-forma
-3.0% appreciation · 3.0% rent growth · sell at horizon
- IRR
- 27.6%
- Equity multiple
- 2.15×
- Total profit
- $19,300
- Equity at exit
- $8,946
- IRR
- 35.1%
- Equity multiple
- 4.22×
- Total profit
- $54,119
- Equity at exit
- $5,188
Cash invested: $16,800 (down + closing). Projections, not guarantees.
Landlord ↔ Tenant lean methodology
- Overall (STATE)
- 83 Strongly Landlord-Friendly
- State Kentucky
- 83 Strongly Landlord-Friendly · R+16
- County
- — inherits STATE
- City
- — inherits STATE
ZIP-level market 41101
- Active inventory
- 100
- Price-to-rent
- 4.9×
Monthly cashflow live
- Estimated rent
- $1,027 medium interval (Pro) →
- Mortgage (P&I)
- −$315
- Tax from tax record
- −$16 /mo · $188/yr
- Insurance
- −$25
- HOA
- −$0
- Vacancy / Maint / Mgmt
- −$216
- Net cashflow
- $456
Break-even live
UW: 25.0% down · 7.5% · 30yr · 1.5% tax · 5.0% vac · 8.0% maint · 8.0% mgmt
Financing live
Cash to close
- Down payment
- $15,000
- Closing costs
- $1,800
- Reserves months
- —
- Total cash needed
- —
Loan-product check · same deal, 3 products live
Conventional
25% down · 7.5% · 30yr
- Down + closing
- —
- Monthly P&I
- —
- Monthly cashflow
- —
- DSCR
- —
- Eligible?
- —
Personal DTI + credit; lowest rate.
DSCR
20% down · 8.5% · 30yr
- Down + closing
- —
- Monthly P&I
- —
- Monthly cashflow
- —
- DSCR
- —
- Eligible?
- —
No personal income docs; deal must DSCR.
Hard money
10% down · 12.0% · 12mo
- Down + closing
- —
- Monthly P&I
- —
- Monthly cashflow
- —
- DSCR
- —
- Eligible?
- —
Short-term bridge; refi at stabilization.
Listing history 16 events
-
2026-06-18days on market $60,000 Active 28 DOM
-
2026-06-17days on market $60,000 Active 27 DOM
-
2026-06-16days on market $60,000 Active 26 DOM
-
2026-06-15days on market $60,000 Active 25 DOM
-
2026-06-13days on market $60,000 Active 23 DOM
-
2026-06-12days on market $60,000 Active 22 DOM
-
2026-06-09days on market $60,000 Active 19 DOM
-
2026-06-08days on market $60,000 Active 18 DOM
-
2026-06-07days on market $60,000 Active 17 DOM
-
2026-06-07days on market $60,000 Active 16 DOM
-
2026-06-04days on market $60,000 Active 13 DOM
-
2026-06-02days on market $60,000 Active 12 DOM
-
2026-06-01days on market $60,000 Active 11 DOM
-
2026-05-31days on market $60,000 Active 10 DOM
-
2026-05-31days on market $60,000 Active 9 DOM
-
2026-05-21$60,000 Active
ⓘ Source: listings_history table (triggers on properties + properties_extension) + one-shot
backfill from property_details.listing_events for pre-trigger history.
Tax reassessment forecast KY · Resets to sale price
- Current annual tax
- $188 · $16/mo
- Projected year-2 tax
- $516 · $43/mo
- Expected delta
- +$328/yr (+$27/mo · 174.9%)
ⓘ Screening estimate from a state-policy table — verify with the county assessor before closing.
Climate risk First Street
- Flood 1/10 Low FEMA zone X (unshaded) · 0% chance over 30 yrs
- Wildfire 1/10 Low
- Heat 4/10 Moderate 7 d/yr ≥102°F today · 19 d/yr by 30 yrs out
- Wind 2/10 Low 2% chance of damaging wind over 30 yrs
- Air quality 2/10 Low 0 unhealthy d/yr today · 1 by 30 yrs out
Nearby sold comps map
Loading sold comps map…
Walkable amenities ~0.75 mi
Loading nearby amenities…
Taxation est. · year 1
- Rental income
- $12,324
- − Mortgage interest
- −$3,361
- − Property taxes
- −$188
- − Insurance
- −$300
- − Repairs & maintenance
- −$986
- − Management
- −$986
- − Depreciation
- −$1,745
- Taxable income
- $4,758
- Est. tax owed @ 24.0%
- −$1,142
- After-tax cash flow
- $4,330/yr
For passive investors: Depreciation is non-cash, so a rental often shows a tax loss while cash-flowing — sheltering income. Rental losses are passive: they offset passive income freely, and up to $25,000/yr can offset ordinary (W-2) income if you actively participate and your MAGI is under $100k (phasing out to $0 by $150k); unused losses carry forward. On sale, claimed depreciation is recaptured at up to 25%, and gains may owe capital-gains tax (a 1031 exchange can defer both). Figures are a year-1 estimate at your 24.0% rate — not tax advice; consult a CPA.
Schools (NCES district)
- District
- Ashland Independent
- NCES district ID
- 2100150
- Math proficiency
- 32% ▼ -16.00%
- Reading proficiency
- 44% ▼ -15.00%
- Median HH income
- $36,579
- Composite
- 31.51/100
- National rank
- #5971
- State rank
- #49 of 165 in KY
Livability — Ashland
- Score
- 64/100
- State rank
- #304
- US rank
- #14462
Category grades
Schools grade is shown separately in the Schools card above.
Census & demographics
- Census place
- Ashland, KY
- City population
- 19,331
- Population (ZIP)
- 19,331
Population outlook (Boyd County) Hauer SSP2
- Today (2025)
- 46,137 people
- By 2030
- 44,585 · -3.4%
- By 2040
- 41,442 · -10.2%
- By 2050
- 38,313 · -17.0%
- By 2075
- 31,077 · -32.6%
- By 2100
- 23,432 · -49.2%
Race, ethnicity, and origin ACS 2023
- Neighborhood character
- Predominantly White (89%)
- Race & ethnicity
- White 89% Two or more races 5% Hispanic / Latino 3% Black 2% Asian 1%
- Common ancestry
- Serbian 3% Slovak 2% Italian 2%
- Foreign-born
- 2% · Canada
- Languages at home
- 96% English-only · Spanish 2%
Political lean MEDSL · Boyd
- 2024 margin
- Solid R (+38.5) · D 30.0% · R 68.6% · Other 1.4%
- 2008→2024 swing
- -26.2pp toward R · 2008: -12.3pp · 2024: -38.5pp
- All cycles
- 2024: R+38.5 2020: R+33.2 2016: R+37.0 2012: R+16.3 2008: R+12.3
Not yet ingested
- Civics
- —
Market trends
- HPI YoY
- ▼ -81.83%
- Current HPI
- 148.0076
- Rent YoY
- —
- Metro
- —
- State GDP YoY
- ▲ 1.81%
- F500 in state
- 4
Industry mix (Fortune 500 HQ in KY)
| Industry | F500 HQs | Revenue |
|---|---|---|
| Healthcare | 1 | $118B |
|
||
| Food / Beverage | 1 | $7B |
|
||
Price history
1 event — show timeline
- 2026-05-21 Listed $60,000 AABOR
Property tax history
+1.9%/yrLatest (2025): $188 · -1.0% YoY. Source: county tax records.
Cash-flow waterfall
monthlySold comps — $/sqft
last 12 mo · ≤1 miLoading sold comps…