 🌊 Lakefront
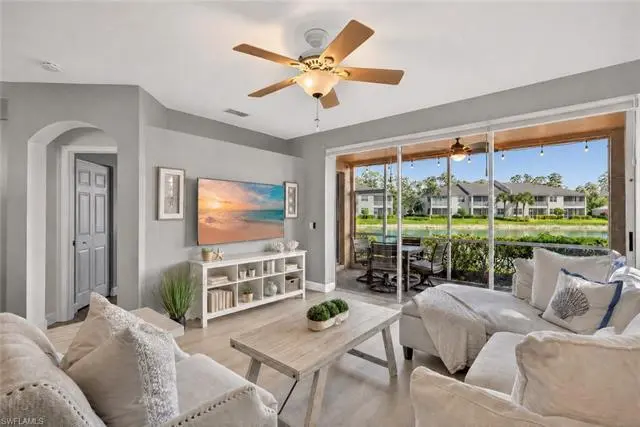
6295 Wilshire Pines Cir #604 · Vineyards, FL
Flood risk 1/10 · Minimal
- FEMA flood zone
- X (unshaded)
- Chance of flooding over 30 yrs
- 0.0%
- Est. flood insurance / yr
- $507 – $1,088
Fire risk 2/10 · Minimal
- Est. fire insurance / yr
- $947 – $1,759
Heat risk 10/10 · Severe
- Hot days now (above 107°F)
- 7 days/yr
- Hot days in 30 yrs
- 28 days/yr
Wind risk 10/10 · Severe
- Chance of severe wind over 30 yrs
- 99.0%
Air-quality risk 2/10 · Minimal
- Unhealthy air days now
- 2 days/yr
- Unhealthy air days in 30 yrs
- 2 days/yr
Risk factors via First Street. Map © Google.
Why this score? — see what drove the C grade
The composite is a weighted blend of 9 inputs, each scored 0–100. Each bar is that input's sub-score; the figure is the points it added to the 100-point composite (weight × sub-score).
- Cash flow +17.1/30.0
- ARV discount +7.5/15.0
- 1% rule +6.5/10.0
- DSCR +5.3/10.0
- Appreciation +5.1/10.0
- Schools +5.0/10.0
- Livability +3.2/5.0
- Rent growth +2.7/5.0
- Condition / age +2.5/5.0
$399,000
🖨 Deal sheet 📄 Offer letter ✓ Due diligence
Listing remarks MLS
This gorgeous lakefront 3/2 first floor Condo with detached garage located in desirable North Naples gated community of Wilshire Lakes. This end unit in Wilshire Pines has a magnificent lakeview from the screened lanai & master bedroom! This warm and inviting floor plan offers a private entrance, ceramic tiled floors throughout, wood laminate flooring in bedrooms, and new paint throughout. Spacious, eat-in kitchen with bay window, solid surface breakfast bar and kitchen counters, pantry, and raised panel cabinets. Living room and dining room offer spectacular views of lake via triple hiding sliding doors that open to large newly re-screened lanai. Master suite has 2 walk-in closets, sliding door to lanai, a huge master bath has dual vanity sinks, spa-inspired jetted tub, separate tiled shower and toilet room, plus a large linen closet.
Key facts
- Gated community
- Fitness areas
- Miles of trails
Tags
Property features AI
Finance
- Other: 122 units in the complex, 6 units in the building, 2 floors in the building; Unit number 604
- HOA & community: Mandatory HOA; Quarterly master HOA fee of $800; Quarterly condo fee of $1,572; Professional management; Community amenities include clubhouse, community pool, exercise room, internet access, tennis court, and streetlights; Maintenance coverage includes cable, insurance, internet/Wi-Fi, irrigation water, lawn/land maintenance, pest control (exterior), recreation facilities, reserves, security, street maintenance, trash removal, water, and management; Total annual recurring fees: $9,488; Total one-time fees: $1,650
Exterior
- Parking: Detached 1-car garage
- Security: Gated community; Community provides security services
- Utilities: Assessment-paid water; Assessment-paid sewer; Cable available
- Home design: Residential low-rise building (1–3 stories); End-unit; Rear exposure faces north; Located in Wilshire Lakes community (Wilshire Pines sub-condo)
- Construction: Concrete block construction; Built in 2000
- Exterior features: Stucco exterior; Shingle roof; Double-hung, sliding, and impact-resistant windows; Lakefront view with water feature; Irrigation assessment paid; Deeded restrictions
Interior
- Kitchen: Pantry; Electric cooktop; Dishwasher; Microwave; Refrigerator
- Bedrooms: 3 bedrooms with at least one on the first floor
- Flooring: Vinyl flooring
- Bathrooms: 2 full bathrooms; Primary bath with jetted tub and separate tub and shower
- Heating & cooling: Central electric heat; Central electric air conditioning; Ceiling fans
- Interior features: Built-in cabinets; Closet cabinets; Pantry; High-speed internet available; Smoke detectors; Turnkey furnished; Split bedroom floor plan; Screened lanai/porch; Breakfast area and dining/living combination
- Laundry & utility: Washer in residence; Laundry room inside the unit; Auto garage door opener
Neighborhood map
What this means for you Summary
Snapshot
- This is a 3-bed/2.0-bath condo listed at $399k.
Deal economics
- At list price, monthly cash flow is $280 ($3k/yr) — positive.
- The deal already cash-flows at list — no discount required.
- Meets the 1% rule at list price ($5k rent vs $399k).
- Recommended offer: $387k (3.0% below list) — sets the bar for market timing.
Location & tenants
- Location reads 64/100 on livability (#679 in FL) — a middle-class / working-renter tenant base. Strengths: crime A+, employment A+, housing A-; Watch: health & safety D, amenities F, commute F.
- Collier (suburban): math 60% / reading 56% proficiency, ranked #16 of 73 in FL (top 22%) — acceptable for families but not a draw, mixed tenant base, ~2y average lease.
- Zoned schools: Vineyards Elementary School (math 79% / reading 75%, grade A, #170 of 2,144 statewide, top 9%, 845 students, 27% FRL) — zoned schools average 27% FRL vs 55% district-wide (28 pts lower); this property's tenant base skews higher-income than the district average.
- Zoned-school proficiency averages 77% at this address vs 58% district-wide (+19 pts) — the actual schools serving this property are materially stronger than the Collier average implies; a family-tenant draw the district grade alone would hide.
- Market conditions: Rents flat; 424 active listings in the ZIP; 40 comparable units currently listed for rent nearby; rentals leasing fast (median 14d on market — plan ~1-2 weeks tenant-placement turnaround); solid renter incomes; 3,520 units permitted in Collier County in 2024 (959 in 5+ unit buildings).
- At $4,585/mo this rent would consume 60% of the median local household income ($92k/yr) (locally 1712% of renters already pay >50% of income on rent) — very limited rent-growth headroom before tenants either downsize or default.
Forward outlook
- In year one you build about $4k of equity ($3k loan paydown + $1k appreciation (0.3% local appreciation)).
- Collier County population projected at +30% by 2050 — long-run rental-demand tailwind backs the buy-and-hold thesis.
- By year 7, paydown + projected appreciation supports a ~$31k cash-out refi (75% LTV) — recoverable capital for the next deal without selling this one.
Negotiation context
- It's been on market 46 days — a 3% lower offer ($387k) is reasonable based on typical stale-listing flexibility.
- 3 sale attempts since 5y ago with the ask held roughly flat each time — persistent listings suggest the price (not the market) is what's stuck; bring a comps-based counter.
- Current owner paid $265k; list at $399k implies a 51% gain — meaningful room to come down on a strong offer.
Risks & watch-outs
- Climate carrying-cost: severe wind risk, 99% chance of damaging wind over 30y; extreme-heat days projected 7→28/yr by 2055 (HVAC capex compounding) — expect insurance premiums to compound above CPI over the hold.
Questions for the listing agent
- It's been on market 46 days. Have you received any prior offers? Is the seller open to a 3% concession, seller financing, or rate buy-down credit?
- What does the HOA fee cover, when was the last increase, and are there any pending special assessments or reserve-fund shortfalls?
- Any open or pending special assessments — roof, HVAC, plumbing, elevator, façade? What's the per-unit balance and payoff schedule, and is the seller paying it off at close or rolling it to the buyer?
- Is there a deadline driving the sale (1031 exchange, divorce, estate, relocation)? That informs how much negotiation room exists.
- This sits on a lake — are riparian / water-frontage rights deeded with the parcel? Any dock permits, shoreline easements, or HOA water-use restrictions?
- What's the documented flood / surge / shoreline-erosion history here (FEMA AND non-FEMA — e.g., storm surge, creek backup, septic-field saturation)?
- Any water-quality or seasonal algae-bloom issues that affect tenant satisfaction or short-term-rental demand?
- What's the average days-on-market for RENTAL listings here right now (not sales)? A rising rental-DOM trend means longer vacancies and softer asking-rent achievability than the comps imply.
- What's the recent tenant-quality profile in this submarket — average credit score on applications, eviction rate, late-payment / NSF rate, and stable-employment percentage? A property-management company in the area should have these aggregated.
- How much new apartment / multifamily construction is in the pipeline within 1–3 miles? Heavy new supply (>2% of stock underway) typically softens rents 12–24 months out; light construction supports rent growth.
Investment metrics
- 1% rule
- 1.15% ✓
- Cap rate
- 7.14%
- Cash-on-cash
- 3.01%
- DSCR
- 1.13
- GRM
- 7.3
CMA / ARV
No comps found within radius.
Projected returns pro-forma
0.29% appreciation · 0.92% rent growth · sell at horizon
- IRR
- 0.5%
- Equity multiple
- 1.02×
- Total profit
- $2,781
- Equity at exit
- $121,775
- IRR
- 4.1%
- Equity multiple
- 1.44×
- Total profit
- $48,874
- Equity at exit
- $151,190
Cash invested: $111,720 (down + closing). Projections, not guarantees.
Landlord ↔ Tenant lean methodology
- Overall (STATE)
- 87 Strongly Landlord-Friendly
- State Florida
- 87 Strongly Landlord-Friendly · R+3
- County
- — inherits STATE
- City
- — inherits STATE
ZIP-level market 34109
- Home prices YoY
- 0.1%
- Rents YoY
- 0.9%
- Active inventory
- 424
- Price-to-rent
- 7.3×
Monthly cashflow live
- Estimated rent
- $4,585 high interval (Pro) →
- Mortgage (P&I)
- −$2,092
- Tax from tax record
- −$292 /mo · $3,503/yr
- Insurance
- −$166
- HOA
- −$791
- Vacancy / Maint / Mgmt
- −$963
- Net cashflow
- $280
Break-even live
UW: 25.0% down · 7.5% · 30yr · 1.5% tax · 5.0% vac · 8.0% maint · 8.0% mgmt
Financing live
Cash to close
- Down payment
- $99,750
- Closing costs
- $11,970
- Reserves months
- —
- Total cash needed
- —
Loan-product check · same deal, 3 products live
Conventional
25% down · 7.5% · 30yr
- Down + closing
- —
- Monthly P&I
- —
- Monthly cashflow
- —
- DSCR
- —
- Eligible?
- —
Personal DTI + credit; lowest rate.
DSCR
20% down · 8.5% · 30yr
- Down + closing
- —
- Monthly P&I
- —
- Monthly cashflow
- —
- DSCR
- —
- Eligible?
- —
No personal income docs; deal must DSCR.
Hard money
10% down · 12.0% · 12mo
- Down + closing
- —
- Monthly P&I
- —
- Monthly cashflow
- —
- DSCR
- —
- Eligible?
- —
Short-term bridge; refi at stabilization.
Rent comps 40 comps
| Address | Beds | Baths | Sqft | Rent | $/sqft | DOM | Units | Dist |
|---|---|---|---|---|---|---|---|---|
| 6325 Wilshire Pines Cir #308 Naples, FL | 3.0 | 2.0 | 1577 | $5,000 | $3.17 | 13d | 1 | 0.10mi |
| 6215 Wilshire Pines Cir #1601 Naples, FL | 3.0 | 2.0 | 1592 | $4,500 | $2.83 | 23d | 1 | 0.16mi |
| 6051 Shallows Way Naples, FL | 3.0 | 2.0 | 2000 | $5,000 | $2.50 | 23d | 1 | 0.28mi |
| 2864 Tiburon Blvd E #101 Naples, FL | 2.0 | 2.0 | 2159 | $13,500 | $6.25 | 13d | 1 | 0.47mi |
| 2864 Tiburon Blvd E #101 Naples, FL | 2.0 | 2.0 | 2159 | $13,500 | $6.25 | 23d | 1 | 0.47mi |
| 1710 Tarpon Bay Dr S Unit 4 Naples, FL | 2.0 | 2.0 | 1537 | $2,200 | $1.43 | 13d | 1 | 0.49mi |
| 2847 Tiburon Blvd E #101 Naples, FL | 2.0 | 2.0 | 2159 | $6,500 | $3.01 | 13d | 1 | 0.50mi |
| 2809 Tiburon Blvd E Unit 2 Naples, FL | 3.0 | 2.0 | 2159 | $18,000 | $8.34 | 13d | 1 | 0.57mi |
| 1761 Tarpon Bay Dr S #58 Naples, FL | 3.0 | 2.0 | 1879 | $3,299 | $1.76 | 23d | 1 | 0.60mi |
| 1628 Cayman Ct #2 Naples, FL | 3.0 | 2.0 | 1879 | $6,500 | $3.46 | 23d | 1 | 0.60mi |
| 1634 Tarpon Bay Dr S #202 Naples, FL | 3.0 | 2.0 | 2170 | $6,000 | $2.76 | 23d | 1 | 0.63mi |
| 1634 Tarpon Bay Dr S #202 Naples, FL | 3.0 | 2.0 | 2170 | $6,000 | $2.76 | 13d | 1 | 0.63mi |
| 15126 Palmer Lake Cir Naples, FL | 2.0–3.0 | 2.0 | 1254 | $3,700 | $2.95 | 23d | 2 | 0.63mi |
| 15144 Palmer Lake Cir #102 Naples, FL | 2.0 | 2.0 | 1375 | $6,500 | $4.73 | 23d | 1 | 0.68mi |
| 15145 Palmer Lake Cir #103 Naples, FL | 3.0 | 2.0 | 1571 | $7,000 | $4.46 | 23d | 1 | 0.71mi |
| 1882 Tarpon Bay Dr S Unit 2 Naples, FL | 2.0 | 2.0 | 1332 | $2,200 | $1.65 | 13d | 1 | 0.74mi |
| 2001 Tarpon Bay Dr N #102 Naples, FL | 2.0 | 2.0 | 1620 | $5,400 | $3.33 | 23d | 1 | 0.79mi |
| 2748 Tiburon Blvd E Unit C202 Naples, FL | 2.0 | 2.5 | 1865 | $15,000 | $8.04 | 13d | 1 | 0.80mi |
| 3775 Fieldstone Blvd Unit 102 Naples, FL | 2.0 | 2.0 | 1281 | $4,700 | $3.67 | 13d | 1 | 0.82mi |
| 2004 Tarpon Bay Dr N #201 Naples, FL | 3.0 | 2.0 | 2170 | $6,000 | $2.76 | 23d | 1 | 0.82mi |
| 2004 Tarpon Bay Dr N #101 Naples, FL | 3.0 | 2.0 | 1759 | $2,450 | $1.39 | 23d | 1 | 0.82mi |
| 15177 Butler Lake Dr #201 Naples, FL | 3.0 | 2.0 | 2152 | $8,500 | $3.95 | 13d | 1 | 0.84mi |
| 15181 Butler Lake Dr #201 Naples, FL | 3.0 | 2.0 | 2152 | $7,500 | $3.49 | 13d | 1 | 0.84mi |
| 3745 Fieldstone Blvd Unit 107 Naples, FL | 2.0 | 2.0 | 1310 | $3,800 | $2.90 | 13d | 1 | 0.85mi |
| 3511 Vanderbilt Beach Rd Naples, FL | 1.0–2.0 | 1.0–2.0 | 968 | $2,976 | $3.07 | 13d | 12 | 0.85mi |
| 3780 Fieldstone Blvd #301 Naples, FL | 3.0 | 2.0 | 1500 | $2,800 | $1.87 | 13d | 1 | 0.85mi |
| 3740 Fieldstone Blvd Unit 104 Naples, FL | 3.0 | 2.0 | 1456 | $2,300 | $1.58 | 13d | 1 | 0.86mi |
| 2728 Tiburon Blvd E Unit A-203 Naples, FL | 2.0 | 2.0 | 1465 | $11,000 | $7.51 | 13d | 1 | 0.87mi |
| 2728 Tiburon Blvd E Unit A-104 Naples, FL | 2.0 | 2.0 | 1465 | $12,500 | $8.53 | 13d | 1 | 0.87mi |
| 2728 Tiburon Blvd E Unit A204 Naples, FL | 2.0 | 2.0 | 1470 | $8,500 | $5.78 | 13d | 1 | 0.87mi |
| 2728 Tiburon Blvd E Naples, FL | 2.0–3.0 | 2.5–3.5 | 2425 | $22,000 | $9.07 | 13d | 3 | 0.87mi |
| 2115 Malibu Lake Cir Naples, FL | 1.0–4.0 | 1.0–2.0 | 1188 | $2,791 | $2.35 | 13d | 56 | 0.89mi |
| 4965 Sandra Bay Dr #102 Naples, FL | 2.0 | 2.0 | 1377 | $2,200 | $1.60 | 13d | 1 | 0.95mi |
| 2738 Tiburon Blvd E Unit B405 Naples, FL | 2.0 | 2.5 | 1865 | $12,000 | $6.43 | 13d | 1 | 0.97mi |
| 4940 Cougar Ct S Unit 1545947P Naples, FL | 2.0 | 2.0 | 1367 | $2,185 | $1.60 | 13d | 1 | 0.98mi |
| 5000 Immokalee Rd Naples, FL | 1.0–3.0 | 1.0–2.0 | 1115 | $4,272 | $3.83 | 13d | 68 | 0.98mi |
| 4945 Cougar Ct S #105 Naples, FL | 2.0 | 2.0 | 1377 | $2,750 | $2.00 | 13d | 1 | 1.01mi |
| 3320 Bermuda Isle Cir Naples, FL | 1.0–3.0 | 1.0–2.0 | 1134 | $3,270 | $2.88 | 13d | 45 | 1.05mi |
| 1156 Oakes Blvd Naples, FL | 3.0 | 2.0 | 1554 | $7,500 | $4.83 | 23d | 1 | 1.05mi |
| 4680 Saint Croix Ln #512 Naples, FL | 3.0 | 2.0 | 1196 | $2,490 | $2.08 | 23d | 1 | 1.07mi |
HOA detail condo
- Monthly dues
- $791 · $9,492/yr
- Likely covers
- security
- Assessments
- None detected in remarks — confirm with the listing agent.
Listing history 15 events
-
2026-06-18days on market $399,000 Active 46 DOM
-
2026-06-17days on market $399,000 Active 45 DOM
-
2026-06-16days on market $399,000 Active 44 DOM
-
2026-06-15days on market $399,000 Active 43 DOM
-
2026-06-14days on market $399,000 Active 41 DOM
-
2026-06-10days on market $399,000 Active 38 DOM
-
2026-06-09days on market $399,000 Active 37 DOM
-
2026-06-08days on market $399,000 Active 36 DOM
-
2026-06-07days on market $399,000 Active 35 DOM
-
2026-06-03days on market $399,000 Active 31 DOM
-
2026-06-02days on market $399,000 Active 30 DOM
-
2026-06-01days on market $399,000 Active 29 DOM
-
2026-05-31days on market $399,000 Active 28 DOM
-
2026-05-30remarks 699-char remark
-
2026-05-30$399,000 Active 27 DOM
ⓘ Source: listings_history table (triggers on properties + properties_extension) + one-shot
backfill from property_details.listing_events for pre-trigger history.
Tax reassessment forecast FL · Resets to sale price
- Current annual tax
- $3,503 · $292/mo
- Projected year-2 tax
- $3,503 · $292/mo
- Expected delta
- $0/yr ($0/mo · 0.0%)
ⓘ Screening estimate from a state-policy table — verify with the county assessor before closing.
Climate risk First Street
- Flood 1/10 Low FEMA zone X (unshaded) · 0% chance over 30 yrs
- Wildfire 2/10 Low
- Heat 10/10 Extreme 7 d/yr ≥107°F today · 28 d/yr by 30 yrs out
- Wind 10/10 Extreme 99% chance of damaging wind over 30 yrs
- Air quality 2/10 Low 2 unhealthy d/yr today · 2 by 30 yrs out
Nearby sold comps map
Loading sold comps map…
Walkable amenities ~0.75 mi
Loading nearby amenities…
Taxation est. · year 1
- Rental income
- $55,019
- − Mortgage interest
- −$22,350
- − Property taxes
- −$3,503
- − Insurance
- −$1,995
- − Repairs & maintenance
- −$4,401
- − Management
- −$4,401
- − HOA
- −$9,492
- − Depreciation
- −$11,607
- Taxable loss
- −$2,732
- Est. tax savings @ 24.0%
- +$656
- After-tax cash flow
- $4,021/yr
For passive investors: Depreciation is non-cash, so a rental often shows a tax loss while cash-flowing — sheltering income. Rental losses are passive: they offset passive income freely, and up to $25,000/yr can offset ordinary (W-2) income if you actively participate and your MAGI is under $100k (phasing out to $0 by $150k); unused losses carry forward. On sale, claimed depreciation is recaptured at up to 25%, and gains may owe capital-gains tax (a 1031 exchange can defer both). Figures are a year-1 estimate at your 24.0% rate — not tax advice; consult a CPA.
Schools (NCES district)
- District
- Collier
- NCES district ID
- 1200330
- Math proficiency
- 60% ▼ -4.00%
- Reading proficiency
- 56% ▼ -2.00%
- Median HH income
- $58,275
- Composite
- 50.23/100
- National rank
- #1892
- State rank
- #16 of 73 in FL
Livability — Vineyards
- Score
- 64/100
- State rank
- #679
- US rank
- #14101
Category grades
Schools grade is shown separately in the Schools card above.
Census & demographics
- County
- Collier County · 396,295 people
- Metro
- Naples-Marco Island, FL
- Population (ZIP)
- 27,273
- Household income
- $92,259
- Rent vs Own
- Severe rent burden
- 1712.0
Population outlook (Collier County) Hauer SSP2
- Today (2025)
- 420,858 people
- By 2030
- 450,054 · +6.9%
- By 2040
- 502,232 · +19.3%
- By 2050
- 544,932 · +29.5%
- By 2075
- 627,203 · +49.0%
- By 2100
- 659,015 · +56.6%
Race, ethnicity, and origin ACS 2023
- Neighborhood character
- Predominantly White (78%)
- Race & ethnicity
- White 78% Hispanic / Latino 11% Two or more races 9% Black 4% Asian 4%
- Hispanic origin (detail)
- Mexican 1% Puerto Rican 1% Cuban 3%
- Common ancestry
- Romanian 5% Scotch-Irish 3% Lithuanian 2%
- Foreign-born
- 20% · Canada, Jamaica, Vietnam
- Languages at home
- 77% English-only · Spanish 10% Other Indo-European 5% Russian/Polish/Slavic 3%
Political lean MEDSL · Collier
- 2024 margin
- Solid R (+33.1) · D 33.1% · R 66.2%
- 2008→2024 swing
- -10.6pp toward R · 2008: -22.5pp · 2024: -33.1pp
- All cycles
- 2024: R+33.1 2020: R+24.7 2016: R+26.0 2012: R+30.1 2008: R+22.5
Not yet ingested
- Civics
- —
Market trends
- HPI YoY
- ▲ 0.29%
- Current HPI
- 279.357
- Rent YoY
- ▲ 0.92%
- Metro
- Naples-Marco Island, FL
- State GDP YoY
- ▲ 3.28%
- F500 in state
- 36
Industry mix (Fortune 500 HQ in FL)
| Industry | F500 HQs | Revenue |
|---|---|---|
| Industrial Technology | 2 | $29B |
|
||
| Insurance | 2 | $17B |
|
||
| Retail | 1 | $60B |
|
||
| Technology Distribution | 1 | $58B |
|
||
| Homebuilding | 1 | $35B |
|
||
| Technology Manufacturing | 1 | $35B |
|
||
Price history
+45.4% since first listed7 events — show timeline
- 2026-05-10 Relisted — NAPLESMLS
- 2026-05-05 Pending — NAPLESMLS
- 2026-04-27 Listed $399,000 NAPLESMLS
- 2021-04-18 Sold (Public Records) $265,000 Public Records
- 2021-04-07 Sold (MLS) $265,000 FORTMLS
- 2021-02-06 Pending — FORTMLS
- 2021-01-20 Listed $274,500 FORTMLS
Property tax history
+6.2%/yrLatest (2025): $3,503 · +8.8% YoY. Source: county tax records.
Cash-flow waterfall
monthlySold comps — $/sqft
last 12 mo · ≤1 miLoading sold comps…