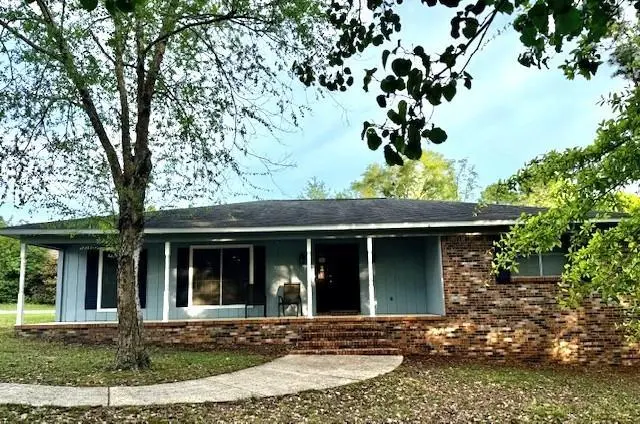
7531 Branchwood Dr · Mobile, AL
Flood risk 1/10 · Minimal
- FEMA flood zone
- X (unshaded)
- Chance of flooding over 30 yrs
- 0.0%
- Est. flood insurance / yr
- $507 – $1,088
Fire risk 2/10 · Minimal
- Est. fire insurance / yr
- $916 – $1,700
Heat risk 9/10 · Severe
- Hot days now (above 104°F)
- 7 days/yr
- Hot days in 30 yrs
- 21 days/yr
Wind risk 9/10 · Severe
- Chance of severe wind over 30 yrs
- 99.0%
Air-quality risk 1/10 · Minimal
- Unhealthy air days now
- 0 days/yr
- Unhealthy air days in 30 yrs
- 0 days/yr
Risk factors via First Street. Map © Google.
Why this score? — see what drove the C- grade
The composite is a weighted blend of 9 inputs, each scored 0–100. Each bar is that input's sub-score; the figure is the points it added to the 100-point composite (weight × sub-score).
- Cash flow +17.0/30.0
- ARV discount +14.6/15.0
- DSCR +5.3/10.0
- Livability +3.8/5.0
- 1% rule +3.5/10.0
- Condition / age +2.5/5.0
- Rent growth +2.4/5.0
- Schools +2.3/10.0
- Appreciation +0.0/10.0
$234,000
🖨 Deal sheet 📄 Offer letter ✓ Due diligence
Listing remarks MLS
This charming 3 bedroom/2 bath home is situated on a large corner lot and has an open floor plan with large windows letting in a lot of natural light. The den has a beautiful beamed ceiling and a cozy wood-burning fireplace. The open concept of den and living room allows for versatility in setting up the common areas. Handsome hardwood floors and tile throughout the house. A large covered deck looks out over a private, fenced backyard with a garden shed and enough area for some raised planters and a play area. Roof was replaced approximately 7 years ago. HVAC system was completely replaced in 2020.
Key facts
- 0.41 acre lot
- 2 parking spots
- Built 1980
Neighborhood map
What this means for you Summary
Snapshot
- This is a 3-bed/2.0-bath single-family listed at $234k.
Deal economics
- At list price, monthly cash flow is $158 ($2k/yr) — positive.
- The deal already cash-flows at list — no discount required.
- To meet the 1% rule (rent ≥ 1% of price), the offer needs to be $200k (14.7% below list).
- Recommended offer: $200k (14.7% below list) — sets the bar for 1% rule.
- Cap rate 7.1% vs local median 4.9% in Mobile — top-decile yield for the area; either an underpriced asset or a hidden risk that comps aren't pricing in. Stress-test before assuming the spread holds.
Location & tenants
- Location reads 75/100 on livability (#20 in AL, #4,262 nationally) — a middle-class / working-renter tenant base. Strengths: commute A+, cost of living A+, housing A+; Watch: schools D-, crime F, employment D-.
- Mobile County (urban): math 15% / reading 39% proficiency, ranked #81 of 129 in AL (top 63%) — low school quality limits family demand, transient renter base, plan for 1-2y turnover; 67% free/reduced lunch — lower-income household profile, screen leases tightly.
- Market conditions: Rents soft (-0.4%/yr); 551 active listings in the ZIP; 8 comparable units currently listed for rent nearby; rentals at typical pace (median 21d on market — plan ~3-4 weeks tenant-placement turnaround); solid renter incomes; 1,678 units permitted in Mobile County in 2024 (264 in 5+ unit buildings).
- This rent runs 31% of the median local income ($76k/yr) — at the standard rent-burdened threshold; future hikes will face affordability resistance.
Forward outlook
- Local home prices are declining (-3.0%/yr); year-one equity from $2k of loan paydown is wiped out by about $7k of value loss. Plan a longer hold.
- Mobile County population projected to shrink 8% by 2050 — rents likely to lag national; underwrite the cash flow, not the appreciation.
Negotiation context
- It's been on market 77 days — a 6% lower offer ($220k) is reasonable based on typical stale-listing flexibility.
- 3 sale attempts since 9y ago with the ask held roughly flat each time — persistent listings suggest the price (not the market) is what's stuck; bring a comps-based counter.
Risks & watch-outs
- Climate carrying-cost: severe wind risk, 99% chance of damaging wind over 30y; extreme-heat days projected 7→21/yr by 2055 (HVAC capex compounding) — expect insurance premiums to compound above CPI over the hold.
Questions for the listing agent
- It's been on market 77 days. Have you received any prior offers? Is the seller open to a 15% concession, seller financing, or rate buy-down credit?
- Why hasn't it sold? Are there any deal-killer items the seller is aware of (foundation, flood, title, zoning, code violations)?
- Is there a deadline driving the sale (1031 exchange, divorce, estate, relocation)? That informs how much negotiation room exists.
- Schools are D-rated, which usually means shorter tenancies and higher turnover. Who's the typical renter profile here, and what's been the actual vacancy rate?
- Crime grade is F in this area — have there been break-ins, vandalism, or insurance claims at this property in the last 3 years? What carrier currently insures it and at what premium?
- What's the average days-on-market for RENTAL listings here right now (not sales)? A rising rental-DOM trend means longer vacancies and softer asking-rent achievability than the comps imply.
- What's the recent tenant-quality profile in this submarket — average credit score on applications, eviction rate, late-payment / NSF rate, and stable-employment percentage? A property-management company in the area should have these aggregated.
- How much new for-sale + rental construction is in the pipeline within 1–3 miles? Heavy new supply typically softens prices + rents 12–24 months out; constrained supply supports both.
Investment metrics
- 1% rule
- 0.85% ✗
- Cap rate
- 7.10%
- Cash-on-cash
- 2.90%
- DSCR
- 1.13
- GRM
- 9.8
CMA / ARV
- ARV (median comp)
- $278,190
- List price
- $234,000
- Delta
- -15.88%
- Verdict
- UNDERPRICED
- Comps
- 20 within 1.0 mi
Show comp detail 12 sales within ~0.75 mi
| Address | Dist | Beds/Ba | Sqft | Sold | Price | $/sf | Match |
|---|---|---|---|---|---|---|---|
| 7485 Creekwood Dr | 0.11mi | 3/2.5 | 1,971 (+9%) | 4mo | $252,000 | $128 | 75 |
| 7671 Creekwood Dr | 0.23mi | 3/2.0 | 1,641 (-10%) | 3mo | $178,000 | $108 | 71 |
| 7238 Belle Chase Dr | 0.66mi | 3/2.0 | 1,864 (+3%) | 2mo | $255,000 | $137 | 63 |
| 2039 CREEKWOOD PLACE Ct | 0.35mi | 4/2.0 (+1) | 1,944 (+7%) | 8mo | $274,750 | $141 | 60 |
| 1905 Ridgeline Dr | 0.20mi | 3/2.0 | 2,044 (+13%) | 11mo | $270,000 | $132 | 60 |
| 2030 Adobe Ridge Rd W | 0.47mi | 3/2.0 | 1,662 (-8%) | 10mo | $253,000 | $152 | 56 |
| 7271 Carson Rd S | 0.68mi | 3/3.0 | 1,938 (+7%) | 4mo | $210,000 | $108 | 49 |
| 8010 Suzanne Way | 0.72mi | 3/2.0 | 1,697 (-6%) | 9mo | $215,000 | $127 | 48 |
| 7311 Carson Rd S | 0.65mi | 3/2.0 | 2,036 (+12%) | 3mo | $215,000 | $106 | 47 |
| 1630 Pine Station Rd | 0.62mi | 4/2.0 (+1) | 2,036 (+12%) | 2mo | $297,000 | $146 | 44 |
| 1352 W Carson Rd | 0.62mi | 4/3.0 (+1) | 2,008 (+11%) | 5mo | $274,000 | $136 | 40 |
| 7175 Ashmoor Dr N | 0.59mi | 4/2.5 (+1) | 1,950 (+8%) | 16mo | $296,000 | $152 | 40 |
Match score weights: distance 35% · size 25% · config 20% · recency 20%. Top-matched comps best support the ARV.
Projected returns pro-forma
-3.0% appreciation · 0.0% rent growth · sell at horizon
- IRR
- -14.8%
- Equity multiple
- 0.48×
- Total profit
- $-33,791
- Equity at exit
- $34,890
- IRR
- -11.4%
- Equity multiple
- 0.40×
- Total profit
- $-39,436
- Equity at exit
- $20,232
Cash invested: $65,520 (down + closing). Projections, not guarantees.
Landlord ↔ Tenant lean methodology
- Overall (STATE)
- 90 Strongly Landlord-Friendly
- State Alabama
- 90 Strongly Landlord-Friendly · R+15
- County
- — inherits STATE
- City
- — inherits STATE
ZIP-level market 36695
- Home prices YoY
- -30.9%
- Rents YoY
- -0.4%
- Active inventory
- 551
- Price-to-rent
- 9.8×
Monthly cashflow live
- Estimated rent
- $1,996 high interval (Pro) →
- Mortgage (P&I)
- −$1,227
- Tax from tax record
- −$94 /mo · $1,126/yr
- Insurance
- −$98
- HOA
- −$0
- Vacancy / Maint / Mgmt
- −$419
- Net cashflow
- $158
Break-even live
UW: 25.0% down · 7.5% · 30yr · 1.5% tax · 5.0% vac · 8.0% maint · 8.0% mgmt
Financing live
Cash to close
- Down payment
- $58,500
- Closing costs
- $7,020
- Reserves months
- —
- Total cash needed
- —
Loan-product check · same deal, 3 products live
Conventional
25% down · 7.5% · 30yr
- Down + closing
- —
- Monthly P&I
- —
- Monthly cashflow
- —
- DSCR
- —
- Eligible?
- —
Personal DTI + credit; lowest rate.
DSCR
20% down · 8.5% · 30yr
- Down + closing
- —
- Monthly P&I
- —
- Monthly cashflow
- —
- DSCR
- —
- Eligible?
- —
No personal income docs; deal must DSCR.
Hard money
10% down · 12.0% · 12mo
- Down + closing
- —
- Monthly P&I
- —
- Monthly cashflow
- —
- DSCR
- —
- Eligible?
- —
Short-term bridge; refi at stabilization.
Rent comps 8 comps
| Address | Beds | Baths | Sqft | Rent | $/sqft | DOM | Units | Dist |
|---|---|---|---|---|---|---|---|---|
| 2175 Schillinger Rd S Mobile, AL | 1.0–3.0 | 1.0–2.0 | 1188 | $1,790 | $1.51 | 13d | 11 | 0.53mi |
| 7325 Smithfield Rd Mobile, AL | 4.0 | 2.5 | 2258 | $2,150 | $0.95 | 21d | 1 | 0.82mi |
| 1313 Schillinger Rd S Mobile, AL | 1.0–3.0 | 1.0–2.0 | 1022 | $1,651 | $1.62 | 13d | 7 | 0.88mi |
| 8361 Jeptha Ct Mobile, AL | 3.0 | 2.0 | 1600 | $1,900 | $1.19 | 43d | 1 | 1.23mi |
| 945 Schillinger Rd S Mobile, AL | 2.0–3.0 | 2.0–2.5 | 1809 | $2,300 | $1.27 | 43d | 1 | 1.29mi |
| 1718 Calgary Dr W Mobile, AL | 4.0 | 2.0 | 1830 | $2,200 | $1.20 | 43d | 1 | 1.33mi |
| 6650 Cottage Hill Rd Mobile, AL | 1.0–3.0 | 1.0–2.0 | 1049 | $1,518 | $1.45 | 13d | 40 | 1.46mi |
| 6605 Chimney Top Dr S Mobile, AL | 4.0 | 2.5 | 2400 | $2,500 | $1.04 | 21d | 1 | 1.47mi |
Listing history 24 events
-
2026-06-18days on market $234,000 Active 77 DOM
-
2026-06-17days on market $234,000 Active 76 DOM
-
2026-06-16days on market $234,000 Active 75 DOM
-
2026-06-15days on market $234,000 Active 74 DOM
-
2026-06-14days on market $234,000 Active 72 DOM
-
2026-06-13days on market $234,000 Active 71 DOM
-
2026-06-10days on market $234,000 Active 69 DOM
-
2026-06-09days on market $234,000 Active 68 DOM
-
2026-06-08days on market $234,000 Active 67 DOM
-
2026-06-07days on market $234,000 Active 66 DOM
-
2026-06-05days on market $234,000 Active 63 DOM
-
2026-06-03days on market $234,000 Active 62 DOM
-
2026-06-02days on market $234,000 Active 61 DOM
-
2026-06-01days on market $234,000 Active 60 DOM
-
2026-05-31days on market $234,000 Active 59 DOM
-
2026-05-30days on market $234,000 Active 58 DOM
-
2026-04-26price $239,000 612-char remark
Show marketing remark (612 chars)
This charming 3 bedroom/2 bath home is situated on a large corner lot and has an open floor plan with large windows letting in a lot of natural light. The den has a beautiful beamed ceiling and a cozy wood-burning fireplace. The open concept of den and living room allows for versatility in setting up the common areas. Handsome hardwood floors and tile throughout the house. A large covered deck looks out over a private, fenced backyard with a garden shed and enough area for some raised planters and a play area. Roof was replaced approximately 7 years ago. HVAC system was completely replaced in 2020.
-
2026-04-02$245,000 Active 612-char remark
Show marketing remark (612 chars)
This charming 3 bedroom/2 bath home is situated on a large corner lot and has an open floor plan with large windows letting in a lot of natural light. The den has a beautiful beamed ceiling and a cozy wood-burning fireplace. The open concept of den and living room allows for versatility in setting up the common areas. Handsome hardwood floors and tile throughout the house. A large covered deck looks out over a private, fenced backyard with a garden shed and enough area for some raised planters and a play area. Roof was replaced approximately 7 years ago. HVAC system was completely replaced in 2020.
-
2022-08-11soldstatus $218,000
-
2022-08-09soldstatus $218,000 712-char remark
Show marketing remark (712 chars)
**VRM Seller will entertain offers between $199,000 to $229,000**This 3 bedroom 2 bath open floor plan home situated on a corner lot (almost half acre) with a 2 car carport is not your typical cookie cutter home! architectural ROOF is approximately 3 years old! COMPLETE NEW HVAC IN 2020! There’s no carpet anywhere in this home! Beautiful hardwood floors and Stone tile in wet areas! Granite and stainless steel in kitchen! Large laundry room! Remolded main bathroom! Beautiful beamed ceilings with cozy wood burning fireplace! Sit on your front porch and enjoy that morning cup of coffee or on your back porch overlooking a large back yard with shed. Contact your Realtor for your private viewing today!
-
2019-06-25soldstatus $159,000
-
2018-05-15soldstatus $120,000
-
2017-09-26$139,800
-
2017-08-22$145,000
ⓘ Source: listings_history table (triggers on properties + properties_extension) + one-shot
backfill from property_details.listing_events for pre-trigger history.
Tax reassessment forecast AL · Resets to sale price
- Current annual tax
- $1,126 · $94/mo
- Projected year-2 tax
- $1,126 · $94/mo
- Expected delta
- $0/yr ($0/mo · 0.0%)
ⓘ Screening estimate from a state-policy table — verify with the county assessor before closing.
Climate risk First Street
- Flood 1/10 Low FEMA zone X (unshaded) · 0% chance over 30 yrs
- Wildfire 2/10 Low
- Heat 9/10 Extreme 7 d/yr ≥104°F today · 21 d/yr by 30 yrs out
- Wind 9/10 Extreme 99% chance of damaging wind over 30 yrs
- Air quality 1/10 Low 0 unhealthy d/yr today · 0 by 30 yrs out
Nearby sold comps map
Loading sold comps map…
Walkable amenities ~0.75 mi
Loading nearby amenities…
Taxation est. · year 1
- Rental income
- $23,947
- − Mortgage interest
- −$13,108
- − Property taxes
- −$1,126
- − Insurance
- −$1,170
- − Repairs & maintenance
- −$1,916
- − Management
- −$1,916
- − Depreciation
- −$6,807
- Taxable loss
- −$2,095
- Est. tax savings @ 24.0%
- +$503
- After-tax cash flow
- $2,400/yr
For passive investors: Depreciation is non-cash, so a rental often shows a tax loss while cash-flowing — sheltering income. Rental losses are passive: they offset passive income freely, and up to $25,000/yr can offset ordinary (W-2) income if you actively participate and your MAGI is under $100k (phasing out to $0 by $150k); unused losses carry forward. On sale, claimed depreciation is recaptured at up to 25%, and gains may owe capital-gains tax (a 1031 exchange can defer both). Figures are a year-1 estimate at your 24.0% rate — not tax advice; consult a CPA.
Schools (NCES district)
- District
- Mobile County
- NCES district ID
- 0102370
- Math proficiency
- 15% ▼ -28.00%
- Reading proficiency
- 39% ▬ 0.00%
- Median HH income
- $42,455
- Composite
- 22.9/100
- National rank
- #8002
- State rank
- #81 of 129 in AL
Livability — Mobile
- Score
- 75/100
- State rank
- #20
- US rank
- #4262
Category grades
Schools grade is shown separately in the Schools card above.
Census & demographics
- County
- Mobile County · 246,577 people
- City population
- 205,729
- Metro
- Mobile, AL
- Population (ZIP)
- 52,690
- Household income
- $76,040
- Rent vs Own
- Severe rent burden
- 1619.0
Population outlook (Mobile County) Hauer SSP2
- Today (2025)
- 415,303 people
- By 2030
- 411,755 · -0.9%
- By 2040
- 399,670 · -3.8%
- By 2050
- 382,616 · -7.9%
- By 2075
- 337,353 · -18.8%
- By 2100
- 283,391 · -31.8%
Race, ethnicity, and origin ACS 2023
- Neighborhood character
- Predominantly White (67%)
- Race & ethnicity
- White 67% Black 23% Two or more races 5% Hispanic / Latino 5% Asian 2%
- Common ancestry
- Lithuanian 3% Italian 2% Slovak 1%
- Foreign-born
- 5% · Canada, Vietnam, China
- Languages at home
- 94% English-only · Spanish 2% Vietnamese 1% Arabic 1%
Political lean MEDSL · Mobile
- 2024 margin
- R (+16.4) · D 41.3% · R 57.7%
- 2008→2024 swing
- -7.7pp toward R · 2008: -8.7pp · 2024: -16.4pp
- All cycles
- 2024: R+16.4 2020: R+11.9 2016: R+13.9 2012: R+9.3 2008: R+8.7
Not yet ingested
- Civics
- —
Market trends
- HPI YoY
- ▼ -86.28%
- Current HPI
- 193.1651
- Rent YoY
- ▼ -0.41%
- Metro
- Mobile, AL
- State GDP YoY
- ▲ 2.94%
- F500 in state
- 4
Industry mix (Fortune 500 HQ in AL)
| Industry | F500 HQs | Revenue |
|---|---|---|
| Financial Services | 1 | $8B |
|
||
| Healthcare | 1 | $5B |
|
||
Price history
+64.8% since first listed8 events — show timeline
- 2026-04-26 Price Changed $239,000 GCMLS AL
- 2026-04-02 Listed $245,000 GCMLS AL
- 2022-08-11 Sold (Public Records) $218,000 Public Records
- 2022-08-09 Sold (MLS) $218,000 GCMLS AL
- 2019-06-25 Sold (Public Records) $159,000 Public Records
- 2018-05-15 Sold (Public Records) $120,000 Public Records
- 2017-09-26 Listed $139,800 BCAR
- 2017-08-22 Listed $145,000 BCAR
Property tax history
+6.7%/yrLatest (2025): $1,126 · +3.5% YoY. Source: county tax records.
Cash-flow waterfall
monthlySold comps — $/sqft
last 12 mo · ≤1 miLoading sold comps…