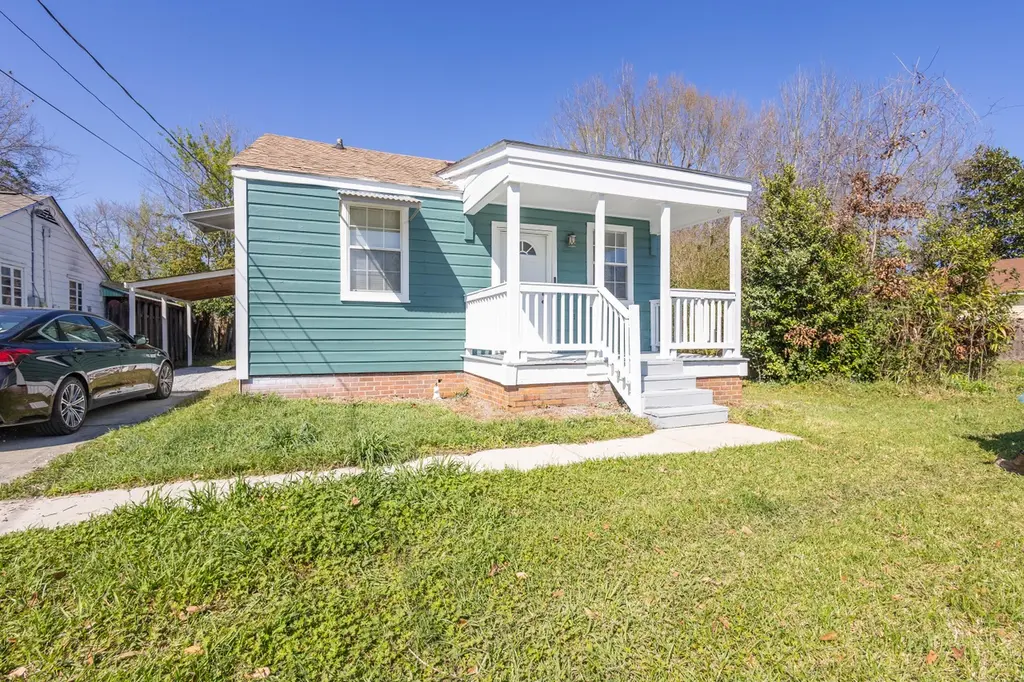
213 Chestnut Ave · Hattiesburg, MS
Flood risk 1/10 · Minimal
- FEMA flood zone
- X (unshaded)
- Chance of flooding over 30 yrs
- 0.0%
- Est. flood insurance / yr
- $507 – $1,088
Fire risk 3/10 · Minor
- Est. fire insurance / yr
- $1,241 – $2,305
Heat risk 8/10 · Major
- Hot days now (above 106°F)
- 7 days/yr
- Hot days in 30 yrs
- 20 days/yr
Wind risk 8/10 · Major
- Chance of severe wind over 30 yrs
- 99.0%
Air-quality risk 1/10 · Minimal
- Unhealthy air days now
- 0 days/yr
- Unhealthy air days in 30 yrs
- 0 days/yr
Risk factors via First Street. Map © Google.
Why this score? — see what drove the B- grade
The composite is a weighted blend of 9 inputs, each scored 0–100. Each bar is that input's sub-score; the figure is the points it added to the 100-point composite (weight × sub-score).
- Cash flow +28.3/30.0
- DSCR +10.0/10.0
- ARV discount +7.5/15.0
- 1% rule +7.0/10.0
- Rent growth +4.1/5.0
- Livability +4.0/5.0
- Condition / age +2.5/5.0
- Schools +2.0/10.0
- Appreciation +0.0/10.0
$114,500
🖨 Deal sheet (PDF) 📄 Offer letter ✓ Due diligence
Listing remarks MLS
Precious 3BR/1BA home that has been updated by seller. Immediate vicinity of William Carey University. Could be cute rental for students. Information gathered from Tax Roll, Seller, and public sources. Buyer/Buyer's Agent to verify all information provided. Must have appointment to show. NO SHOWINGTIME APPOINTMENTS. Call listing office.
Key facts
- 5,035 sq ft lot
- Built 1943
- Listed 46 days
Property features AI
Exterior
- Parking: Attached carport; Driveway; No garage
- Utilities: Public water; Public sewer
- Home design: Single family residence; One story; Residential property; Located in the Garden Place subdivision
- Construction: Wood siding; Foam insulation; Raised foundation; Composition roof
- Exterior features: Covered patio/porch; Level lot; Lot dimensions approximately 53 x 95
Interior
- Flooring: Wood flooring; Vinyl flooring; Carpet
- Bathrooms: 1 full bathroom
- Heating & cooling: Central air conditioning
- Interior features: Ceiling fan(s); Window coverings; Wood window frames
Neighborhood map
What this means for you Summary
Snapshot
- This is a 3-bed/1.0-bath single-family listed at $114k.
Deal economics
- At list price, monthly cash flow is $366 ($4k/yr) — positive.
- The deal already cash-flows at list — no discount required.
- Meets the 1% rule at list price ($1k rent vs $114k).
- Recommended offer: $111k (3.0% below list) — sets the bar for market timing.
- Cap rate 10.1% vs local median 4.0% in Hattiesburg — top-decile yield for the area; either an underpriced asset or a hidden risk that comps aren't pricing in. Stress-test before assuming the spread holds.
Location & tenants
- Location reads 79/100 on livability (#5 in MS, #2,046 nationally) — a middle-class / working-renter tenant base. Strengths: commute A+, cost of living A+, health & safety A+; Watch: schools D+, crime D+, employment F.
- Hattiesburg Public School District (urban): math 25% / reading 26% proficiency, ranked #81 of 130 in MS (top 62%) — low school quality limits family demand, transient renter base, plan for 1-2y turnover; 88% free/reduced lunch — lower-income household profile, screen leases tightly.
- Market conditions: Rents rising fast (+6.6%/yr); 261 active listings in the ZIP; 3 comparable units currently listed for rent nearby; rentals at typical pace (median 22d on market — plan ~3-4 weeks tenant-placement turnaround); lower-income renter base — watch delinquency; 121 units permitted in Forrest County in 2024 (30 in 5+ unit buildings).
- This rent runs 40% of the median local income ($41k/yr) — at the standard rent-burdened threshold; future hikes will face affordability resistance.
Forward outlook
- Local home prices are declining (-3.0%/yr); year-one equity from $792 of loan paydown is wiped out by about $3k of value loss. Plan a longer hold.
- Forrest County population projected at +6% by 2050 — modest demand growth; plan on rents tracking national, not racing it.
- At projected returns (-3.0% appreciation + 6.6% rent growth), your $32k cash investment doubles in ~7 years — after that, you're playing with house money.
Negotiation context
- It's been on market 46 days — a 3% lower offer ($111k) is reasonable based on typical stale-listing flexibility.
- 3 sale attempts since 9y ago with the ask held roughly flat each time — persistent listings suggest the price (not the market) is what's stuck; bring a comps-based counter.
Risks & watch-outs
- Watch-outs: built in 1943 — expect roof / HVAC / electrical / plumbing capex.
- Climate carrying-cost: severe wind risk, 99% chance of damaging wind over 30y; extreme-heat days projected 7→20/yr by 2055 (HVAC capex compounding) — expect insurance premiums to compound above CPI over the hold.
Questions for the listing agent
- It's been on market 46 days. Have you received any prior offers? Is the seller open to a 3% concession, seller financing, or rate buy-down credit?
- Built in 1943 — when were the roof, HVAC, electrical panel, plumbing, and water heater last replaced?
- Is there a deadline driving the sale (1031 exchange, divorce, estate, relocation)? That informs how much negotiation room exists.
- Schools are D-rated, which usually means shorter tenancies and higher turnover. Who's the typical renter profile here, and what's been the actual vacancy rate?
- Crime grade is D in this area — have there been break-ins, vandalism, or insurance claims at this property in the last 3 years? What carrier currently insures it and at what premium?
- What's the average days-on-market for RENTAL listings here right now (not sales)? A rising rental-DOM trend means longer vacancies and softer asking-rent achievability than the comps imply.
- What's the recent tenant-quality profile in this submarket — average credit score on applications, eviction rate, late-payment / NSF rate, and stable-employment percentage? A property-management company in the area should have these aggregated.
- How much new for-sale + rental construction is in the pipeline within 1–3 miles? Heavy new supply typically softens prices + rents 12–24 months out; constrained supply supports both.
Investment metrics
- 1% rule
- 1.20% ✓
- Cap rate
- 10.13%
- Cash-on-cash
- 13.69%
- DSCR
- 1.61
- GRM
- 7.0
CMA / ARV
No comps found within radius.
Projected returns pro-forma
-3.0% appreciation · 6.56% rent growth · sell at horizon
- IRR
- 7.5%
- Equity multiple
- 1.31×
- Total profit
- $9,809
- Equity at exit
- $17,072
- IRR
- 19.6%
- Equity multiple
- 2.90×
- Total profit
- $60,921
- Equity at exit
- $9,900
Cash invested: $32,060 (down + closing). Projections, not guarantees.
Landlord ↔ Tenant lean methodology
- Overall (STATE)
- 90 Strongly Landlord-Friendly
- State Mississippi
- 90 Strongly Landlord-Friendly · R+11
- County
- — inherits STATE
- City
- — inherits STATE
ZIP-level market 39401
- Rents YoY
- 6.6%
- Active inventory
- 261
- Price-to-rent
- 7.0×
Monthly cashflow live
- Estimated rent
- $1,372 medium interval (Pro) →
- Mortgage (P&I)
- −$600
- Tax from tax record
- −$70 /mo · $841/yr
- Insurance
- −$48
- HOA
- −$0
- Vacancy / Maint / Mgmt
- −$288
- Net cashflow
- $366
Break-even live
Sensitivity live
| Price | -10% $431 | -5% $398 | +0% $366 | +5% $333 | +10% $301 |
|---|---|---|---|---|---|
| Rent | -10% $257 | -5% $312 | +0% $366 | +5% $420 | +10% $474 |
| Rate | -1.0pp $423 | -0.5pp $395 | base $366 | +0.5pp $336 | +1.0pp $306 |
UW: 25.0% down · 7.5% · 30yr · 1.5% tax · 5.0% vac · 8.0% maint · 8.0% mgmt
Financing live
Cash to close
- Down payment
- $28,625
- Closing costs
- $3,435
- Reserves months
- —
- Total cash needed
- —
Loan-product check · same deal, 3 products live
Conventional
25% down · 7.5% · 30yr
- Down + closing
- —
- Monthly P&I
- —
- Monthly cashflow
- —
- DSCR
- —
- Eligible?
- —
Personal DTI + credit; lowest rate.
DSCR
20% down · 8.5% · 30yr
- Down + closing
- —
- Monthly P&I
- —
- Monthly cashflow
- —
- DSCR
- —
- Eligible?
- —
No personal income docs; deal must DSCR.
Hard money
10% down · 12.0% · 12mo
- Down + closing
- —
- Monthly P&I
- —
- Monthly cashflow
- —
- DSCR
- —
- Eligible?
- —
Short-term bridge; refi at stabilization.
Rent comps 3 comps
| Address | Beds | Baths | Sqft | Rent | $/sqft | DOM | Units | Dist |
|---|---|---|---|---|---|---|---|---|
| 901 W Pine St Hattiesburg, MS | 1.0–2.0 | 1.0–1.5 | 930 | $1,200 | $1.29 | 22d | 1 | 1.04mi |
| 112 Dearborne St Unit B Hattiesburg, MS | 2.0 | 2.0 | 1000 | $1,450 | $1.45 | 22d | 1 | 1.41mi |
| 112 Dearborne St Unit A Hattiesburg, MS | 2.0 | 1.0 | 1000 | $1,450 | $1.45 | 22d | 1 | 1.41mi |
Listing history 9 events
-
2026-05-01status Pending
-
2026-04-14price $114,500
-
2026-04-10price $114
-
2026-03-16$114,900 Active
-
2023-04-26soldstatus
-
2023-04-21soldstatus Closed 338-char remark
Show marketing remark (338 chars)
Precious 3BR/1BA home that has been updated by seller. Immediate vicinity of William Carey University. Could be cute rental for students. Information gathered from Tax Roll, Seller, and public sources. Buyer/Buyer's Agent to verify all information provided. Must have appointment to show. NO SHOWINGTIME APPOINTMENTS. Call listing office.
-
2023-04-13status Pending 338-char remark
Show marketing remark (338 chars)
Precious 3BR/1BA home that has been updated by seller. Immediate vicinity of William Carey University. Could be cute rental for students. Information gathered from Tax Roll, Seller, and public sources. Buyer/Buyer's Agent to verify all information provided. Must have appointment to show. NO SHOWINGTIME APPOINTMENTS. Call listing office.
-
2023-03-27$69,900 Active 338-char remark
Show marketing remark (338 chars)
Precious 3BR/1BA home that has been updated by seller. Immediate vicinity of William Carey University. Could be cute rental for students. Information gathered from Tax Roll, Seller, and public sources. Buyer/Buyer's Agent to verify all information provided. Must have appointment to show. NO SHOWINGTIME APPOINTMENTS. Call listing office.
-
2017-01-10$36,500
ⓘ Source: listings_history table (triggers on properties + properties_extension) + one-shot
backfill from property_details.listing_events for pre-trigger history.
Tax reassessment forecast MS · Resets to sale price
- Current annual tax
- $841 · $70/mo
- Projected year-2 tax
- $905 · $75/mo
- Expected delta
- +$63/yr (+$5/mo · 7.5%)
ⓘ Screening estimate from a state-policy table — verify with the county assessor before closing.
Climate risk First Street
- Flood 1/10 Low FEMA zone X (unshaded) · 0% chance over 30 yrs
- Wildfire 3/10 Moderate
- Heat 8/10 Severe 7 d/yr ≥106°F today · 20 d/yr by 30 yrs out
- Wind 8/10 Severe 99% chance of damaging wind over 30 yrs
- Air quality 1/10 Low 0 unhealthy d/yr today · 0 by 30 yrs out
Nearby sold comps map
Loading sold comps map…
Walkable amenities ~0.75 mi
Loading nearby amenities…
Taxation est. · year 1
- Rental income
- $16,467
- − Mortgage interest
- −$6,414
- − Property taxes
- −$841
- − Insurance
- −$572
- − Repairs & maintenance
- −$1,317
- − Management
- −$1,317
- − Depreciation
- −$3,331
- Taxable income
- $2,673
- Est. tax owed @ 24.0%
- −$642
- After-tax cash flow
- $3,748/yr
For passive investors: Depreciation is non-cash, so a rental often shows a tax loss while cash-flowing — sheltering income. Rental losses are passive: they offset passive income freely, and up to $25,000/yr can offset ordinary (W-2) income if you actively participate and your MAGI is under $100k (phasing out to $0 by $150k); unused losses carry forward. On sale, claimed depreciation is recaptured at up to 25%, and gains may owe capital-gains tax (a 1031 exchange can defer both). Figures are a year-1 estimate at your 24.0% rate — not tax advice; consult a CPA.
Schools (NCES district)
- District
- Hattiesburg Public School District
- NCES district ID
- 2801800
- Math proficiency
- 25% ▼ -12.00%
- Reading proficiency
- 26% ▼ -6.00%
- Median HH income
- $28,058
- Composite
- 20.38/100
- National rank
- #8595
- State rank
- #81 of 130 in MS
Livability — Hattiesburg
- Score
- 79/100
- State rank
- #5
- US rank
- #2046
Category grades
Schools grade is shown separately in the Schools card above.
Census & demographics
- Census place
- Hattiesburg, MS
- County
- Forrest County · 65,413 people
- City population
- 87,151
- Metro
- Hattiesburg, MS
- Population (ZIP)
- 42,531
- Household income
- $41,127
- Rent vs Own
- Severe rent burden
- 2534.0
Population outlook (Forrest County) Hauer SSP2
- Today (2025)
- 79,264 people
- By 2030
- 80,822 · +2.0%
- By 2040
- 82,979 · +4.7%
- By 2050
- 84,324 · +6.4%
- By 2075
- 84,942 · +7.2%
- By 2100
- 80,616 · +1.7%
Race, ethnicity, and origin ACS 2023
- Neighborhood character
- Diverse neighborhood (Simpson 0.57)
- Race & ethnicity
- Black 52% White 40% Two or more races 5% Hispanic / Latino 4%
- Common ancestry
- Slovak 2% Lithuanian 2% Serbian 1%
- Foreign-born
- 3% · Canada, China
- Languages at home
- 96% English-only · Spanish 2%
Political lean MEDSL · Forrest
- 2024 margin
- R (+17.9) · D 40.3% · R 58.2% · Other 1.4%
- 2008→2024 swing
- -4.4pp toward R · 2008: -13.5pp · 2024: -17.9pp
- All cycles
- 2024: R+17.9 2020: R+11.1 2016: R+14.2 2012: R+11.7 2008: R+13.5
Not yet ingested
- Civics
- —
Market trends
- HPI YoY
- ▼ -148.93%
- Current HPI
- 137.87
- Rent YoY
- ▲ 6.56%
- Metro
- Hattiesburg, MS
- State GDP YoY
- —
- F500 in state
- 0
Price history
+213.7% since first listed9 events — show timeline
- 2026-05-01 Pending — HAAR
- 2026-04-14 Price Changed $114,500 HAAR
- 2026-04-10 Price Changed $114 HAAR
- 2026-03-16 Listed $114,900 HAAR
- 2023-04-26 Sold (Public Records) — Public Records
- 2023-04-21 Sold (MLS) — HAAR
- 2023-04-13 Pending — HAAR
- 2023-03-27 Listed $69,900 HAAR
- 2017-01-10 Listed $36,500 HAAR
Property tax history
+6.7%/yrLatest (2025): $841 · +20.2% YoY. Source: county tax records.
Cash-flow waterfall
monthlySold comps — $/sqft
last 12 mo · ≤1 miLoading sold comps…