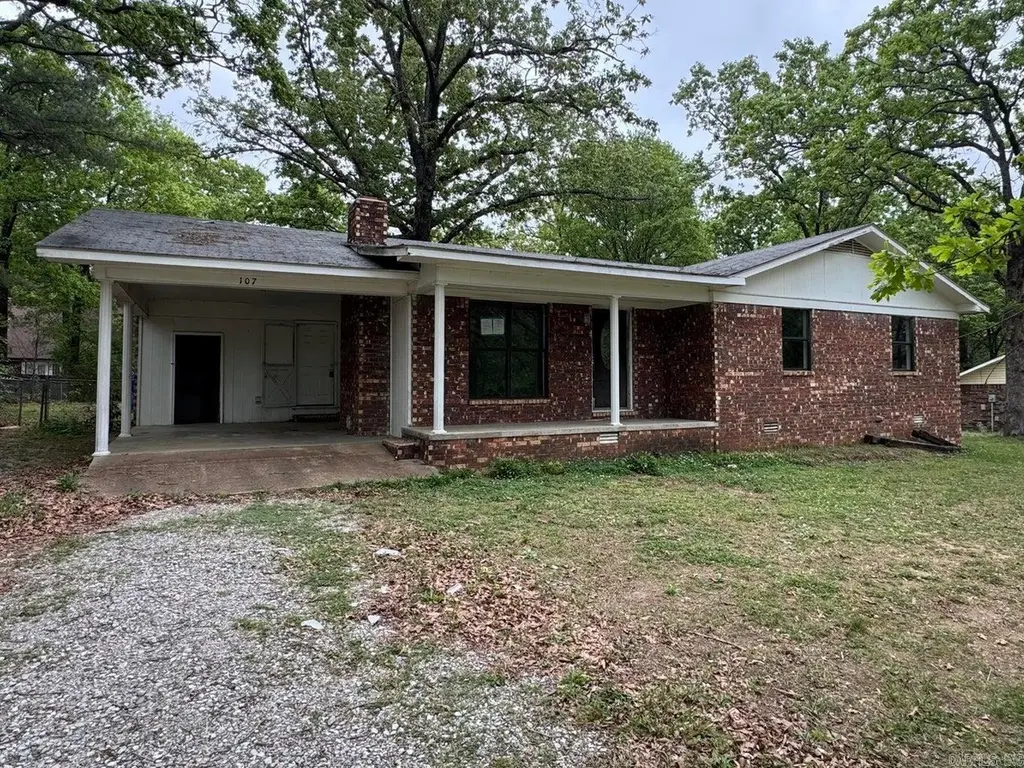
107 Boyd Rd · Southside, AR
Flood risk 1/10 · Minimal
- FEMA flood zone
- X (unshaded)
- Chance of flooding over 30 yrs
- 0.0%
- Est. flood insurance / yr
- $507 – $1,088
Fire risk 5/10 · Moderate
- Est. fire insurance / yr
- $1,499 – $2,785
Heat risk 5/10 · Moderate
- Hot days now (above 108°F)
- 7 days/yr
- Hot days in 30 yrs
- 19 days/yr
Wind risk 3/10 · Minor
- Chance of severe wind over 30 yrs
- 6.0%
Air-quality risk 2/10 · Minimal
- Unhealthy air days now
- 0 days/yr
- Unhealthy air days in 30 yrs
- 1 days/yr
Risk factors via First Street. Map © Google.
Why this score? — see what drove the B grade
The composite is a weighted blend of 9 inputs, each scored 0–100. Each bar is that input's sub-score; the figure is the points it added to the 100-point composite (weight × sub-score).
- Cash flow +27.9/30.0
- ARV discount +15.0/15.0
- DSCR +9.9/10.0
- 1% rule +6.4/10.0
- Schools +3.3/10.0
- Livability +3.1/5.0
- Rent growth +2.5/5.0
- Condition / age +2.5/5.0
- Appreciation +0.0/10.0
$139,000
🖨 Deal sheet 📄 Offer letter ✓ Due diligence
Listing remarks MLS
3 bedroom 2 bath home in Clearview Subdivision!
Key facts
- Brick fireplace
- Large living room
- Fenced backyard
Tags
Property features AI
Finance
- Financial info: Financing available: conventional loan, cash, or in-house financing
Exterior
- Parking: Carport for 1 car
- Utilities: Public water; Septic; Insulated windows
- Home design: Brick exterior
- Construction: 3-tab shingle roof; Crawl space foundation
- Exterior features: Patio; Deck; Level lot in a subdivision; Paved road access
Interior
- Kitchen: Electric range; Dishwasher; Breakfast bar
- Flooring: Carpet; Laminate
- Bathrooms: 2 full bathrooms
- Heating & cooling: Central electric heat; Central electric cooling
- Interior features: Washer connection; Electric dryer connection; Electric water heater; Ceiling fans; Breakfast bar; Fireplace insert; Sheetrock walls/ceilings
- Laundry & utility: Washer hookup; Electric dryer hookup
Neighborhood map
What this means for you Summary
Snapshot
- This is a 3-bed/2.0-bath single-family listed at $139k.
Deal economics
- At list price, monthly cash flow is $429 ($5k/yr) — positive.
- The deal already cash-flows at list — no discount required.
- Meets the 1% rule at list price ($2k rent vs $139k).
- Recommended offer: $137k (1.5% below list) — sets the bar for market timing.
- Cap rate 10.0% vs local median 4.8% in Southside — top-decile yield for the area; either an underpriced asset or a hidden risk that comps aren't pricing in. Stress-test before assuming the spread holds.
Location & tenants
- Location reads 62/100 on livability (#216 in AR) — a middle-class / working-renter tenant base. Strengths: cost of living A+, housing B; Watch: employment C-, amenities F, commute F.
- Southside School District (rural): math 43% / reading 35% proficiency, ranked #77 of 238 in AR (top 32%) — families likely to look elsewhere, expect single-tenant / working-renter base with shorter leases.
- Market conditions: 176 active listings in the ZIP; 3 comparable units currently listed for rent nearby; rentals lingering (median 44d on market — plan ~5-8 weeks vacancy on turnover, expect pricing pressure); 100% of comp listings sitting > 30 days — soft ceiling on asking rent; 33 units permitted in Independence County in 2024 (24 in 5+ unit buildings).
- This rent runs 36% of the median local income ($53k/yr) — at the standard rent-burdened threshold; future hikes will face affordability resistance.
Forward outlook
- Local home prices are declining (-3.0%/yr); year-one equity from $961 of loan paydown is wiped out by about $4k of value loss. Plan a longer hold.
- At projected returns (-3.0% appreciation + 3.0% rent growth), your $39k cash investment doubles in ~9 years — after that, you're playing with house money.
Negotiation context
- It's been on market 25 days — a 2% lower offer ($137k) is reasonable based on typical stale-listing flexibility.
- 4 sale attempts since 27y ago with the ask held roughly flat each time — persistent listings suggest the price (not the market) is what's stuck; bring a comps-based counter.
Risks & watch-outs
- Climate carrying-cost: moderate wildfire risk; extreme-heat days projected 7→19/yr by 2055 (HVAC capex compounding) — expect insurance premiums to compound above CPI over the hold.
Questions for the listing agent
- Is there a deadline driving the sale (1031 exchange, divorce, estate, relocation)? That informs how much negotiation room exists.
- What's the average days-on-market for RENTAL listings here right now (not sales)? A rising rental-DOM trend means longer vacancies and softer asking-rent achievability than the comps imply.
- What's the recent tenant-quality profile in this submarket — average credit score on applications, eviction rate, late-payment / NSF rate, and stable-employment percentage? A property-management company in the area should have these aggregated.
- How much new for-sale + rental construction is in the pipeline within 1–3 miles? Heavy new supply typically softens prices + rents 12–24 months out; constrained supply supports both.
Investment metrics
- 1% rule
- 1.14% ✓
- Cap rate
- 9.99%
- Cash-on-cash
- 13.21%
- DSCR
- 1.59
- GRM
- 7.3
CMA / ARV
- ARV (median comp)
- $173,314
- List price
- $139,000
- Delta
- -19.80%
- Verdict
- UNDERPRICED
- Comps
- 20 within 1.0 mi
Show comp detail 8 sales within ~0.75 mi
| Address | Dist | Beds/Ba | Sqft | Sold | Price | $/sf | Match |
|---|---|---|---|---|---|---|---|
| 107 Boyd Rd | 0.00mi | 3/2.0 | 1,360 (0%) | 0mo | $139,000 | $102 | 100 |
| 113 Boyd Rd | 0.02mi | 3/2.0 | 1,189 (-13%) | 11mo | $147,000 | $124 | 69 |
| 5 Shangri-la Ln | 0.48mi | 3/2.0 | 1,512 (+11%) | 3mo | $87,500 | $58 | 56 |
| 52 Carol Ln | 0.27mi | 3/2.0 | 1,502 (+10%) | 18mo | $200,000 | $133 | 55 |
| 345 Heber Springs Rd | 0.52mi | 3/2.0 | 1,456 (+7%) | 15mo | $136,580 | $94 | 51 |
| 17 Estes Way | 0.66mi | 3/3.0 | 1,476 (+8%) | 8mo | $204,500 | $139 | 44 |
| 2 Estes Way | 0.72mi | 3/2.0 | 1,476 (+8%) | 14mo | $198,000 | $134 | 41 |
| 28 Red Bud Dr | 0.63mi | 2/1.0 (-1) | 1,236 (-9%) | 23mo | $128,000 | $104 | 28 |
Match score weights: distance 35% · size 25% · config 20% · recency 20%. Top-matched comps best support the ARV.
Projected returns pro-forma
-3.0% appreciation · 3.0% rent growth · sell at horizon
- IRR
- 3.1%
- Equity multiple
- 1.12×
- Total profit
- $4,708
- Equity at exit
- $20,725
- IRR
- 12.7%
- Equity multiple
- 2.00×
- Total profit
- $38,991
- Equity at exit
- $12,018
Cash invested: $38,920 (down + closing). Projections, not guarantees.
Landlord ↔ Tenant lean methodology
- Overall (STATE)
- 92 Strongly Landlord-Friendly
- State Arkansas
- 92 Strongly Landlord-Friendly · R+14
- County
- — inherits STATE
- City
- — inherits STATE
ZIP-level market 72501
- Home prices YoY
- -16.3%
- Active inventory
- 176
- Price-to-rent
- 7.3×
Monthly cashflow live
- Estimated rent
- $1,580 medium interval (Pro) →
- Mortgage (P&I)
- −$729
- Tax from tax record
- −$33 /mo · $398/yr
- Insurance
- −$58
- HOA
- −$0
- Vacancy / Maint / Mgmt
- −$332
- Net cashflow
- $429
Break-even live
UW: 25.0% down · 7.5% · 30yr · 1.5% tax · 5.0% vac · 8.0% maint · 8.0% mgmt
Financing live
Cash to close
- Down payment
- $34,750
- Closing costs
- $4,170
- Reserves months
- —
- Total cash needed
- —
Loan-product check · same deal, 3 products live
Conventional
25% down · 7.5% · 30yr
- Down + closing
- —
- Monthly P&I
- —
- Monthly cashflow
- —
- DSCR
- —
- Eligible?
- —
Personal DTI + credit; lowest rate.
DSCR
20% down · 8.5% · 30yr
- Down + closing
- —
- Monthly P&I
- —
- Monthly cashflow
- —
- DSCR
- —
- Eligible?
- —
No personal income docs; deal must DSCR.
Hard money
10% down · 12.0% · 12mo
- Down + closing
- —
- Monthly P&I
- —
- Monthly cashflow
- —
- DSCR
- —
- Eligible?
- —
Short-term bridge; refi at stabilization.
Rent comps 3 comps
| Address | Beds | Baths | Sqft | Rent | $/sqft | DOM | Units | Dist |
|---|---|---|---|---|---|---|---|---|
| 23 Estes Way Southside, AR | 3.0 | 2.0 | 1440 | $1,700 | $1.18 | 43d | 1 | 0.64mi |
| 16 Estes Way Southside, AR | 3.0 | 2.0 | 1440 | $1,800 | $1.25 | 43d | 1 | 0.67mi |
| 1 Estes Way Southside, AR | 3.0 | 2.0 | 1440 | $1,800 | $1.25 | 43d | 1 | 0.73mi |
Listing history 11 events
-
2026-05-18historical Active Under Contract 296-char remark
-
2026-04-30$139,000 Active 296-char remark
-
2026-04-30$139,000 New Listing 294-char remark
-
2024-11-27$169,900 Active
-
2022-06-08$155,000
Show marketing remark (47 chars)
3 bedroom 2 bath home in Clearview Subdivision!
-
2022-06-06soldstatus $155,000
-
2022-06-03soldstatus $155,000
Show marketing remark (47 chars)
3 bedroom 2 bath home in Clearview Subdivision!
-
2013-12-10soldstatus $103,900
-
2002-10-21soldstatus $75,000
-
1999-10-22soldstatus $63,000
-
1990-04-30soldstatus $49,000
ⓘ Source: listings_history table (triggers on properties + properties_extension) + one-shot
backfill from property_details.listing_events for pre-trigger history.
Tax reassessment forecast AR · Resets to sale price
- Current annual tax
- $398 · $33/mo
- Projected year-2 tax
- $890 · $74/mo
- Expected delta
- +$491/yr (+$41/mo · 123.4%)
ⓘ Screening estimate from a state-policy table — verify with the county assessor before closing.
Climate risk First Street
- Flood 1/10 Low FEMA zone X (unshaded) · 0% chance over 30 yrs
- Wildfire 5/10 Major
- Heat 5/10 Major 7 d/yr ≥108°F today · 19 d/yr by 30 yrs out
- Wind 3/10 Moderate 6% chance of damaging wind over 30 yrs
- Air quality 2/10 Low 0 unhealthy d/yr today · 1 by 30 yrs out
Nearby sold comps map
Loading sold comps map…
Walkable amenities ~0.75 mi
Loading nearby amenities…
Taxation est. · year 1
- Rental income
- $18,966
- − Mortgage interest
- −$7,786
- − Property taxes
- −$398
- − Insurance
- −$695
- − Repairs & maintenance
- −$1,517
- − Management
- −$1,517
- − Depreciation
- −$4,044
- Taxable income
- $3,008
- Est. tax owed @ 24.0%
- −$722
- After-tax cash flow
- $4,421/yr
For passive investors: Depreciation is non-cash, so a rental often shows a tax loss while cash-flowing — sheltering income. Rental losses are passive: they offset passive income freely, and up to $25,000/yr can offset ordinary (W-2) income if you actively participate and your MAGI is under $100k (phasing out to $0 by $150k); unused losses carry forward. On sale, claimed depreciation is recaptured at up to 25%, and gains may owe capital-gains tax (a 1031 exchange can defer both). Figures are a year-1 estimate at your 24.0% rate — not tax advice; consult a CPA.
Schools (NCES district)
- District
- Southside School District
- NCES district ID
- 0512540
- Math proficiency
- 43% ▼ -14.00%
- Reading proficiency
- 35% ▼ -11.00%
- Median HH income
- $37,901
- Composite
- 32.55/100
- National rank
- #5688
- State rank
- #77 of 238 in AR
Livability — Southside
- Score
- 62/100
- State rank
- #216
- US rank
- #16702
Category grades
Schools grade is shown separately in the Schools card above.
Census & demographics
- Census place
- Southside, AR
- County
- Independence County · 26,218 people
- Metro
- Batesville, AR
- Population (ZIP)
- 26,218
- Household income
- $52,829
- Rent vs Own
- Severe rent burden
- 553.0
Population outlook (Independence County) Hauer SSP2
- Today (2025)
- 37,748 people
- By 2030
- 37,962 · +0.6%
- By 2040
- 38,151 · +1.1%
- By 2050
- 37,980 · +0.6%
- By 2075
- 36,622 · -3.0%
- By 2100
- 32,741 · -13.3%
Race, ethnicity, and origin ACS 2023
- Neighborhood character
- Predominantly White (79%)
- Race & ethnicity
- White 79% Hispanic / Latino 12% Two or more races 8% Black 2% Asian 1%
- Hispanic origin (detail)
- Mexican 6%
- Common ancestry
- Slovak 2% Lithuanian 2% Italian 1%
- Foreign-born
- 5% · Canada, Vietnam
- Languages at home
- 92% English-only · Spanish 7% Other Asian/Pacific 1%
Political lean MEDSL · Independence
- 2024 margin
- Solid R (+59.5) · D 19.2% · R 78.7% · Other 2.1%
- 2008→2024 swing
- -22.3pp toward R · 2008: -37.1pp · 2024: -59.5pp
- All cycles
- 2024: R+59.5 2020: R+58.2 2016: R+52.4 2012: R+44.0 2008: R+37.1
Not yet ingested
- Civics
- —
Market trends
- HPI YoY
- ▼ -40.19%
- Current HPI
- 206.3787
- Rent YoY
- —
- Metro
- Batesville, AR
- State GDP YoY
- ▲ 3.80%
- F500 in state
- 10
Industry mix (Fortune 500 HQ in AR)
| Industry | F500 HQs | Revenue |
|---|---|---|
| Retail | 1 | $681B |
|
||
| Food / Agriculture | 1 | $53B |
|
||
| Retail / Energy | 1 | $22B |
|
||
| Transportation / Logistics | 1 | $12B |
|
||
| Energy | 1 | $4B |
|
||
Price history
+183.7% since first listed13 events — show timeline
- 2026-06-17 Sold (MLS) $139,000 CARMLS
- 2026-05-28 Pending — CARMLS
- 2026-04-30 Listed $139,000 CARMLS
- 2024-11-27 Listed $169,900 Batesville
- 2022-06-08 Listed $155,000 Batesville
- 2022-06-06 Sold (Public Records) $155,000 Public Records
- 2022-06-03 Sold (MLS) $155,000 Batesville
- 2013-12-10 Sold (Public Records) $103,900 Public Records
- 2002-10-21 Sold (Public Records) $75,000 Public Records
- 1999-10-22 Sold (Public Records) $63,000 Public Records
- 1999-10-21 Sold (MLS) $63,000 Batesville
- 1999-06-30 Listed $68,000 Batesville
- 1990-04-30 Sold (Public Records) $49,000 Public Records
Property tax history
-0.4%/yrLatest (2025): $398 · -12.4% YoY. Source: county tax records.
Cash-flow waterfall
monthlySold comps — $/sqft
last 12 mo · ≤1 miLoading sold comps…