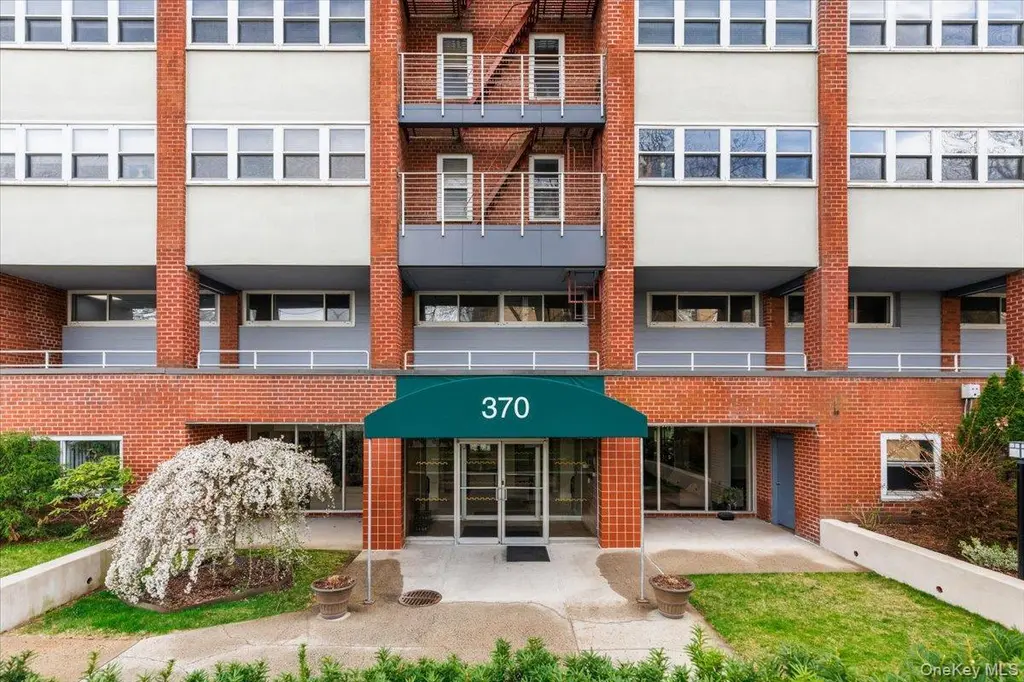
370 Westchester Ave Unit 5C · Port Chester, NY
Flood risk 1/10 · Minimal
- FEMA flood zone
- X (unshaded)
- Chance of flooding over 30 yrs
- 0.0%
- Est. flood insurance / yr
- $473 – $860
Fire risk 1/10 · Minimal
- Est. fire insurance / yr
- $691 – $1,283
Heat risk 6/10 · Moderate
- Hot days now (above 98°F)
- 7 days/yr
- Hot days in 30 yrs
- 16 days/yr
Wind risk 6/10 · Moderate
- Chance of severe wind over 30 yrs
- 55.0%
Air-quality risk 4/10 · Minor
- Unhealthy air days now
- 5 days/yr
- Unhealthy air days in 30 yrs
- 7 days/yr
Risk factors via First Street. Map © Google.
Why this score? — see what drove the D- grade
The composite is a weighted blend of 9 inputs, each scored 0–100. Each bar is that input's sub-score; the figure is the points it added to the 100-point composite (weight × sub-score).
- ARV discount +9.3/15.0
- 1% rule +8.2/10.0
- Cash flow +6.4/30.0
- Schools +4.1/10.0
- Livability +3.7/5.0
- Condition / age +2.5/5.0
- Rent growth +2.1/5.0
- DSCR +0.7/10.0
- Appreciation +0.0/10.0
$215,000
🖨 Deal sheet 📄 Offer letter ✓ Due diligence
Listing remarks MLS
Welcome to The Windsor at 370 Westchester Avenue! This bright and spacious one bedroom offers a desirable walk-in layout, hardwood floors, and abundant natural light throughout. Recently refinished floors and fresh paint throughout provide a crisp, updated feel, while offering the perfect opportunity to personalize and make it your own. An exceptional opportunity for buyers seeking both value and convenience, with the added benefit of the NY STAR program helping to reduce monthly maintenance costs. Beautifully maintained inside and out, The Windsor is ideally situated within one of Port Chester’s most established and convenient co-op communities.
Key facts
- Pool
- Built 1960
- Listed 45 days
Neighborhood map
What this means for you Summary
Snapshot
- This is a 1-bed/1.0-bath condo listed at $215k.
Deal economics
- At list price, monthly cash flow is $-369 ($-4k/yr) — negative.
- The deal already cash-flows at list — no discount required.
- Meets the 1% rule at list price ($3k rent vs $215k).
- Recommended offer: $209k (3.0% below list) — sets the bar for market timing.
Location & tenants
- Location reads 73/100 on livability (#315 in NY) — a middle-class / working-renter tenant base. Strengths: commute A+, employment A+, health & safety A; Watch: schools D+, amenities D, cost of living F.
- Port Chester-Rye Union Free School District (suburban): math 44% / reading 49% proficiency, ranked #428 of 590 in NY (top 72%) — families likely to look elsewhere, expect single-tenant / working-renter base with shorter leases.
- Market conditions: Rents soft (-1.7%/yr); 144 active listings in the ZIP; 29 comparable units currently listed for rent nearby; rentals at typical pace (median 19d on market — plan ~3-4 weeks tenant-placement turnaround); solid renter incomes; 954 units permitted in Westchester County in 2024 (649 in 5+ unit buildings).
- This rent runs 32% of the median local income ($106k/yr) — at the standard rent-burdened threshold; future hikes will face affordability resistance.
Forward outlook
- Local home prices are declining (-3.0%/yr); year-one equity from $1k of loan paydown is wiped out by about $6k of value loss. Plan a longer hold.
- Westchester County population projected at +10% by 2050 — modest demand growth; plan on rents tracking national, not racing it.
Negotiation context
- It's been on market 45 days — a 3% lower offer ($209k) is reasonable based on typical stale-listing flexibility.
- 3 sale attempts since 21y ago with the ask held roughly flat each time — persistent listings suggest the price (not the market) is what's stuck; bring a comps-based counter.
- Current owner paid $170k; 26% above their basis — modest negotiation headroom, anchor on the comps not their cost.
Risks & watch-outs
- Watch-outs: HOA is 40% of rent.
- Climate carrying-cost: major wind risk, 55% chance of damaging wind over 30y; extreme-heat days projected 7→16/yr by 2055 (HVAC capex compounding) — expect insurance premiums to compound above CPI over the hold.
Questions for the listing agent
- What do current leases actually rent for vs. the listed asking? Can we see a recent rent roll and the last 12 months of T-12 income?
- It's been on market 45 days. Have you received any prior offers? Is the seller open to a 3% concession, seller financing, or rate buy-down credit?
- Built in 1960 — when were the roof, HVAC, electrical panel, plumbing, and water heater last replaced?
- What does the HOA fee cover, when was the last increase, and are there any pending special assessments or reserve-fund shortfalls?
- Any open or pending special assessments — roof, HVAC, plumbing, elevator, façade? What's the per-unit balance and payoff schedule, and is the seller paying it off at close or rolling it to the buyer?
- Is there a deadline driving the sale (1031 exchange, divorce, estate, relocation)? That informs how much negotiation room exists.
- Schools are D-rated, which usually means shorter tenancies and higher turnover. Who's the typical renter profile here, and what's been the actual vacancy rate?
- The area grade is low — what's the realistic commute time and amenity access for the typical tenant pool here? Any planned neighborhood developments (good or bad) we should know about?
- What's the average days-on-market for RENTAL listings here right now (not sales)? A rising rental-DOM trend means longer vacancies and softer asking-rent achievability than the comps imply.
- What's the recent tenant-quality profile in this submarket — average credit score on applications, eviction rate, late-payment / NSF rate, and stable-employment percentage? A property-management company in the area should have these aggregated.
- How much new apartment / multifamily construction is in the pipeline within 1–3 miles? Heavy new supply (>2% of stock underway) typically softens rents 12–24 months out; light construction supports rent growth.
Investment metrics
- 1% rule
- 1.32% ✓
- Cap rate
- 4.23%
- Cash-on-cash
- -7.36%
- DSCR
- 0.67
- GRM
- 6.3
CMA / ARV
- ARV (median comp)
- $224,049
- List price
- $215,000
- Delta
- -4.04%
- Verdict
- FAIR
- Comps
- 20 within 1.0 mi
Projected returns pro-forma
-3.0% appreciation · 0.0% rent growth · sell at horizon
- IRR
- -35.6%
- Equity multiple
- -0.10×
- Total profit
- $-65,952
- Equity at exit
- $32,057
- IRR
- -97.6%
- Equity multiple
- -0.94×
- Total profit
- $-116,915
- Equity at exit
- $18,589
Cash invested: $60,200 (down + closing). Projections, not guarantees.
Landlord ↔ Tenant lean methodology
- Overall (STATE)
- 15 Strongly Tenant-Friendly
- State New York
- 15 Strongly Tenant-Friendly · D+10
- County
- — inherits STATE
- City
- — inherits STATE
ZIP-level market 10573
- Rents YoY
- -1.7%
- Active inventory
- 144
- Price-to-rent
- 6.3×
Monthly cashflow live
- Estimated rent
- $2,842 high interval (Pro) →
- Mortgage (P&I)
- −$1,127
- Tax est. 1.5%
- −$269 /mo · $3,225/yr
- Insurance
- −$90
- HOA est. from 1 same-building comp
- −$1,129
- Vacancy / Maint / Mgmt
- −$597
- Net cashflow
- $-369
Break-even live
UW: 25.0% down · 7.5% · 30yr · 1.5% tax · 5.0% vac · 8.0% maint · 8.0% mgmt
Financing live
Cash to close
- Down payment
- $53,750
- Closing costs
- $6,450
- Reserves months
- —
- Total cash needed
- —
Loan-product check · same deal, 3 products live
Conventional
25% down · 7.5% · 30yr
- Down + closing
- —
- Monthly P&I
- —
- Monthly cashflow
- —
- DSCR
- —
- Eligible?
- —
Personal DTI + credit; lowest rate.
DSCR
20% down · 8.5% · 30yr
- Down + closing
- —
- Monthly P&I
- —
- Monthly cashflow
- —
- DSCR
- —
- Eligible?
- —
No personal income docs; deal must DSCR.
Hard money
10% down · 12.0% · 12mo
- Down + closing
- —
- Monthly P&I
- —
- Monthly cashflow
- —
- DSCR
- —
- Eligible?
- —
Short-term bridge; refi at stabilization.
Rent comps 29 comps
| Address | Beds | Baths | Sqft | Rent | $/sqft | DOM | Units | Dist |
|---|---|---|---|---|---|---|---|---|
| Westchester Ave Unit A Port Chester, NY | 2.0 | 2.0 | 1102 | $3,015 | $2.74 | 24d | 1 | 0.15mi |
| 66 Oak St Unit 2 R Port Chester, NY | 2.0 | 1.0 | 800 | $2,395 | $2.99 | 43d | 1 | 0.26mi |
| 14 University Pl Port Chester, NY | 1.0 | 1.0 | 700 | $2,295 | $3.28 | 21d | 1 | 0.46mi |
| 201 Willett Ave Port Chester, NY | 2.0 | 1.0–2.0 | 817 | $3,672 | $4.49 | 7d | 1 | 0.46mi |
| 325 King St Unit 4L Port Chester, NY | 1.0 | 1.0 | 800 | $2,450 | $3.06 | 24d | 1 | 0.48mi |
| S Ridge St , NY | 1.0 | 1.0 | 576 | $1,950 | $3.39 | 43d | 1 | 0.49mi |
| 194 1/2 S Main St Port Chester, NY | 1.0 | 1.0 | 706 | $2,996 | $4.24 | 43d | 1 | 0.50mi |
| 40 Division St Port Chester, NY | 2.0 | 1.0 | 828 | $2,600 | $3.14 | 7d | 1 | 0.53mi |
| 145 N Main St Unit 2nd Floor Port Chester, NY | 2.0 | 1.0 | 1000 | $3,000 | $3.00 | 4d | 1 | 0.57mi |
| 2 S Ridge St Unit 2 Rye Brook, NY | 1.0 | 1.0 | 576 | $1,950 | $3.39 | 43d | 1 | 0.60mi |
| 21 Willett Ave Port Chester, NY | 2.0–3.0 | 1.0–2.0 | 1199 | $3,450 | $2.88 | 1d | 1 | 0.61mi |
| 169 N Main St Port Chester, NY | 2.0 | 1.0–2.0 | 799 | $3,524 | $4.41 | 1d | 43 | 0.62mi |
| 189 N Main St Unit 2 Port Chester, NY | — | 1.0 | 842 | $3,000 | $3.56 | 43d | 1 | 0.64mi |
| 36 Roanoke Ave #2 Rye Brook, NY | 2.0 | 1.0 | 840 | $3,100 | $3.69 | 17d | 1 | 0.65mi |
| 113 S Water St Unit 4 Greenwich, CT | 2.0 | 1.0 | 1000 | $2,985 | $2.98 | 3d | 1 | 0.77mi |
| 168 N Water St Unit 3L Greenwich, CT | 2.0 | 1.0 | 850 | $2,850 | $3.35 | 43d | 1 | 0.93mi |
| 168 N Water St Unit 1R Greenwich, CT | 2.0 | 1.0 | 850 | $2,850 | $3.35 | 23d | 1 | 0.93mi |
| 45 Gold St Greenwich, CT | 1.0 | 1.0 | 936 | $2,800 | $2.99 | 43d | 1 | 0.98mi |
| 144 Pine St Unit D Greenwich, CT | 2.0 | 1.5 | 1120 | $2,950 | $2.63 | 14d | 1 | 0.98mi |
| 2 Sherman Ave Greenwich, CT | 2.0 | 1.0 | 984 | $3,850 | $3.91 | 3d | 1 | 1.07mi |
| 2 Sherman Ave Greenwich, CT | 2.0 | 1.0 | 984 | $3,950 | $4.01 | 43d | 1 | 1.07mi |
| 1 Webb Ave Purchase, NY | 2.0 | 1.0–2.0 | 895 | $3,918 | $4.37 | 1d | 65 | 1.19mi |
| 493 Den Ln Unit 1 Greenwich, CT | 2.0 | 1.5 | 900 | $2,950 | $3.28 | 19d | 1 | 1.21mi |
| 199 Purchase St Unit 2 Rye, NY | 2.0 | 1.0 | 969 | $3,800 | $3.92 | 18d | 1 | 1.22mi |
| 184 Purchase St Apt 12 Rye, NY | 2.0 | 1.5 | 1100 | $5,000 | $4.55 | 4d | 1 | 1.23mi |
| 38 Putnam Grn Greenwich, CT | 1.0 | 1.0 | 847 | $2,995 | $3.54 | 11d | 1 | 1.34mi |
| 4 Weaver St Greenwich, CT | 1.0 | 1.0 | 850 | $2,300 | $2.71 | 43d | 1 | 1.34mi |
| 9 1/2 Putnam Grn Greenwich, CT | 1.0–3.0 | 1.0–2.5 | 1234 | $3,024 | $2.45 | 1d | 19 | 1.37mi |
| 124 Ritch Ave W Greenwich, CT | 1.0–3.0 | 1.0–2.0 | 1238 | $3,550 | $2.87 | 1d | 3 | 1.42mi |
HOA detail condo
- Monthly dues
- $0 · $0/yr
- Assessments
- None detected in remarks — confirm with the listing agent.
Listing history 8 events
-
2026-06-01statusdays on market $215,000 Pending 45 DOM
-
2026-05-31days on market $215,000 Active 44 DOM
-
2026-04-17$215,000 Active 661-char remark
Show marketing remark (661 chars)
Welcome to The Windsor at 370 Westchester Avenue! This bright and spacious one bedroom offers a desirable walk-in layout, hardwood floors, and abundant natural light throughout. Recently refinished floors and fresh paint throughout provide a crisp, updated feel, while offering the perfect opportunity to personalize and make it your own. An exceptional opportunity for buyers seeking both value and convenience, with the added benefit of the NY STAR program helping to reduce monthly maintenance costs. Beautifully maintained inside and out, The Windsor is ideally situated within one of Port Chester’s most established and convenient co-op communities.
-
2009-04-03historical
-
2009-01-26
-
2006-03-24soldstatus $170,000
-
2006-03-24price $175,000
-
2005-10-19$170,000
ⓘ Source: listings_history table (triggers on properties + properties_extension) + one-shot
backfill from property_details.listing_events for pre-trigger history.
Climate risk First Street
- Flood 1/10 Low FEMA zone X (unshaded) · 0% chance over 30 yrs
- Wildfire 1/10 Low
- Heat 6/10 Major 7 d/yr ≥98°F today · 16 d/yr by 30 yrs out
- Wind 6/10 Major 55% chance of damaging wind over 30 yrs
- Air quality 4/10 Moderate 5 unhealthy d/yr today · 7 by 30 yrs out
Nearby sold comps map
Loading sold comps map…
Walkable amenities ~0.75 mi
Loading nearby amenities…
Taxation est. · year 1
- Rental income
- $34,109
- − Mortgage interest
- −$12,043
- − Property taxes
- −$3,225
- − Insurance
- −$1,075
- − Repairs & maintenance
- −$2,729
- − Management
- −$2,729
- − HOA
- −$13,548
- − Depreciation
- −$6,255
- Taxable loss
- −$7,494
- Est. tax savings @ 24.0%
- +$1,799
- After-tax cash flow
- $-2,633/yr
For passive investors: Depreciation is non-cash, so a rental often shows a tax loss while cash-flowing — sheltering income. Rental losses are passive: they offset passive income freely, and up to $25,000/yr can offset ordinary (W-2) income if you actively participate and your MAGI is under $100k (phasing out to $0 by $150k); unused losses carry forward. On sale, claimed depreciation is recaptured at up to 25%, and gains may owe capital-gains tax (a 1031 exchange can defer both). Figures are a year-1 estimate at your 24.0% rate — not tax advice; consult a CPA.
Schools (NCES district)
- District
- Port Chester-Rye Union Free School District
- NCES district ID
- 3623460
- Math proficiency
- 44% ▲ 2.00%
- Reading proficiency
- 49% ▲ 6.00%
- Median HH income
- $58,362
- Composite
- 40.67/100
- National rank
- #3676
- State rank
- #428 of 590 in NY
Livability — Port Chester
- Score
- 73/100
- State rank
- #315
- US rank
- #5245
Category grades
Schools grade is shown separately in the Schools card above.
Census & demographics
- Census place
- Port Chester, NY
- County
- Westchester County · 709,332 people
- City population
- 40,786
- Metro
- New York-Newark-Jersey City, NY-NJ-PA
- Population (ZIP)
- 40,786
- Household income
- $105,686
- Rent vs Own
- Severe rent burden
- 1362.0
Population outlook (Westchester County) Hauer SSP2
- Today (2025)
- 1,028,035 people
- By 2030
- 1,051,636 · +2.3%
- By 2040
- 1,098,520 · +6.9%
- By 2050
- 1,136,044 · +10.5%
- By 2075
- 1,196,925 · +16.4%
- By 2100
- 1,175,147 · +14.3%
Race, ethnicity, and origin ACS 2023
- Neighborhood character
- Diverse neighborhood (Simpson 0.61)
- Race & ethnicity
- Hispanic / Latino 48% White 40% Two or more races 16% Black 5% Asian 4%
- Hispanic origin (detail)
- Mexican 7% Puerto Rican 6% Dominican 3%
- Common ancestry
- Romanian 3% Scotch-Irish 2% Italian 1%
- Foreign-born
- 37% · Canada, Jamaica, China
- Languages at home
- 50% English-only · Spanish 41% Other Indo-European 5% Chinese 1%
Political lean MEDSL · Westchester
- 2024 margin
- Strong D (+26.3) · D 63.1% · R 36.9%
- 2008→2024 swing
- -1.3pp toward R · 2008: 27.6pp · 2024: 26.3pp
- All cycles
- 2024: D+26.3 2020: D+36.3 2016: D+32.8 2012: D+22.2 2008: D+27.6
Not yet ingested
- Civics
- —
Market trends
- HPI YoY
- ▼ -389.46%
- Current HPI
- 258.9227
- Rent YoY
- ▼ -1.70%
- Metro
- New York-Newark-Jersey City, NY-NJ-PA
- State GDP YoY
- ▲ 2.60%
- F500 in state
- 92
Industry mix (Fortune 500 HQ in NY)
| Industry | F500 HQs | Revenue |
|---|---|---|
| Financial Services | 10 | $950B |
|
||
| Consumer Goods | 9 | $162B |
|
||
| Insurance | 4 | $225B |
|
||
| Telecommunications | 2 | $144B |
|
||
| Pharmaceuticals | 2 | $112B |
|
||
| Media / Entertainment | 2 | $69B |
|
||
Price history
+26.5% since first listed6 events — show timeline
- 2026-04-17 Listed $215,000 OneKey® MLS as Distributed by MLS Grid
- 2009-04-03 Delisted — HGMLS
- 2009-01-26 Listed — HGMLS
- 2006-03-24 Price Changed $175,000 HGMLS
- 2006-03-24 Sold (MLS) $170,000 HGMLS
- 2005-10-19 Listed $170,000 HGMLS
Cash-flow waterfall
monthlySold comps — $/sqft
last 12 mo · ≤1 miLoading sold comps…