6611 SW 72nd St #38 · South Miami, FL
Flood risk 4/10 · Minor
- FEMA flood zone
- X (unshaded)
- Chance of flooding over 30 yrs
- 0.23%
- Est. flood insurance / yr
- $507 – $1,088
Fire risk 1/10 · Minimal
- Est. fire insurance / yr
- $947 – $1,759
Heat risk 10/10 · Severe
- Hot days now (above 104°F)
- 7 days/yr
- Hot days in 30 yrs
- 29 days/yr
Wind risk 10/10 · Severe
- Chance of severe wind over 30 yrs
- 99.0%
Air-quality risk 2/10 · Minimal
- Unhealthy air days now
- 1 days/yr
- Unhealthy air days in 30 yrs
- 1 days/yr
Risk factors via First Street. Map © Google.
Why this score? — see what drove the D grade
The composite is a weighted blend of 9 inputs, each scored 0–100. Each bar is that input's sub-score; the figure is the points it added to the 100-point composite (weight × sub-score).
- Cash flow +12.3/30.0
- ARV discount +7.5/15.0
- Condition / age +4.8/5.0
- Schools +4.2/10.0
- Livability +4.0/5.0
- DSCR +3.7/10.0
- Rent growth +3.7/5.0
- 1% rule +3.5/10.0
- Appreciation +0.0/10.0
$899,000
🖨 Deal sheet (PDF) 📄 Offer letter ✓ Due diligence
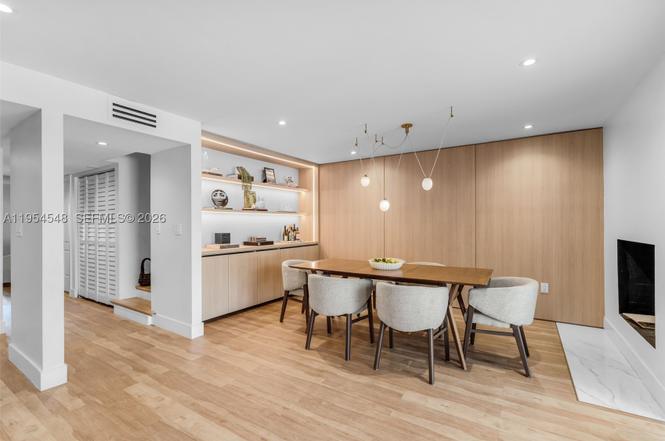
Listing remarks
Rarely available 2,200 sq ft townhouse in The Banyans of South Miami, a well-established and conveniently located community. This two-story home offers three bedrooms, two and a half bathrooms, and an additional room that works well as a home office, den, or playroom. The bedrooms feature high ceilings and generous closet space, with the primary bedroom opening to a private balcony overlooking the backyard. Both front and rear outdoor areas provide comfortable space to unwind or gather with friends. The open kitchen connects naturally to the living areas. The home is move-in ready and thoughtfully laid out for everyday living. The Banyans is centrally located near South Miami Hospital, US-1
Key facts
- Community pool
- Private balcony
- Tennis courts
Tags
Property features AI
Finance
- Financial info: Pets allowed with conditions and possible restrictions
- HOA & community: Monthly association fee; Association covers amenities, common areas, insurance, grounds maintenance, structure maintenance, parking, pool(s), recreation facilities, roof, sewer, trash and water; Community amenities include clubhouse, pool and tennis courts
Exterior
- Parking: Deeded parking; Detached garage; Garage with door opener; 1 covered garage space; Guest parking; Open parking
- Security: Security system
- Utilities: Has cooling and heating; Electric systems
- Home design: Attached property; 2 stories; Entry on level 1
- Construction: Block construction
- Exterior features: Barbecue area; Courtyard; Deck; Patio; Tennis courts; Awnings; Exterior lighting; Heated pool
Interior
- Kitchen: Dishwasher; Disposal; Microwave; Refrigerator; Electric water heater
- Bedrooms: Primary bedroom located on upper level
- Flooring: Ceramic tile; Tile
- Bathrooms: 2 full bathrooms; 1 half bathroom; Dual sinks in bathroom(s)
- Heating & cooling: Central heating (electric); Central air conditioning; Ceiling fans; Electric cooling
- Interior features: Built-in features; Breakfast area; Dining area; Separate/formal dining room; Dual sinks; First-floor entry; Fireplace (decorative); Upper-level primary suite
- Laundry & utility: Washer; Dryer
Neighborhood map
What this means for you Summary
Snapshot
- This is a 3-bed/2.5-bath townhouse listed at $899k. Condition is rated excellent.
Deal economics
- At list price, monthly cash flow is $-163 ($-2k/yr) — negative.
- To cash-flow at today's rent, offer at most $875k (2.6% below list).
- To meet the 1% rule (rent ≥ 1% of price), the offer needs to be $766k (14.8% below list).
- Recommended offer: $766k (14.8% below list) — sets the bar for 1% rule.
Location & tenants
- Location reads 80/100 on livability (#118 in FL, #1,791 nationally) — a professional / high-income tenant draw. Strengths: commute A+, health & safety A+, amenities B+; Watch: crime D-, cost of living F.
- Miami-Dade (suburban): math 45% / reading 54% proficiency, ranked #40 of 73 in FL (top 55%) — families likely to look elsewhere, expect single-tenant / working-renter base with shorter leases; 64% free/reduced lunch — lower-income household profile, screen leases tightly.
- Zoned schools: Ludlam Elementary School (math 47% / reading 52%, grade D, #1,088 of 2,144 statewide, top 53%, 269 students, 56% FRL); South Miami Middle School (math 59% / reading 67%, grade B+, #111 of 571 statewide, top 20%, 725 students, 44% FRL); South Miami Senior High School (math 19% / reading 35%, grade F, #478 of 667 statewide, top 73%, 1,507 students, 59% FRL).
- Market conditions: Rents rising fast (+4.9%/yr); 266 active listings in the ZIP; 22 comparable units currently listed for rent nearby; rentals at typical pace (median 23d on market — plan ~3-4 weeks tenant-placement turnaround); solid renter incomes; 10,051 units permitted in Miami-Dade County in 2024 (7,758 in 5+ unit buildings).
- At $7,658/mo this rent would consume 111% of the median local household income ($83k/yr) (locally 1760% of renters already pay >50% of income on rent) — very limited rent-growth headroom before tenants either downsize or default.
Forward outlook
- Local home prices are declining (-3.0%/yr); year-one equity from $6k of loan paydown is wiped out by about $27k of value loss. Plan a longer hold.
- Miami-Dade County population projected at +28% by 2050 — long-run rental-demand tailwind backs the buy-and-hold thesis.
Negotiation context
- It's been on market 105 days — a 9% lower offer ($818k) is reasonable based on typical stale-listing flexibility.
Risks & watch-outs
- Climate carrying-cost: severe wind risk, 99% chance of damaging wind over 30y; extreme-heat days projected 7→29/yr by 2055 (HVAC capex compounding) — expect insurance premiums to compound above CPI over the hold.
Questions for the listing agent
- What do current leases actually rent for vs. the listed asking? Can we see a recent rent roll and the last 12 months of T-12 income?
- It's been on market 105 days. Have you received any prior offers? Is the seller open to a 15% concession, seller financing, or rate buy-down credit?
- Built in 1977 — when were the roof, HVAC, electrical panel, plumbing, and water heater last replaced?
- Why hasn't it sold? Are there any deal-killer items the seller is aware of (foundation, flood, title, zoning, code violations)?
- Is there a deadline driving the sale (1031 exchange, divorce, estate, relocation)? That informs how much negotiation room exists.
- Schools are A-rated — typically a magnet for longer-tenancy family renters. What's the average tenant stay here, and is there a school-zone premium baked into asking?
- Crime grade is D in this area — have there been break-ins, vandalism, or insurance claims at this property in the last 3 years? What carrier currently insures it and at what premium?
- The area grade is low — what's the realistic commute time and amenity access for the typical tenant pool here? Any planned neighborhood developments (good or bad) we should know about?
- What's the average days-on-market for RENTAL listings here right now (not sales)? A rising rental-DOM trend means longer vacancies and softer asking-rent achievability than the comps imply.
- What's the recent tenant-quality profile in this submarket — average credit score on applications, eviction rate, late-payment / NSF rate, and stable-employment percentage? A property-management company in the area should have these aggregated.
- How much new for-sale + rental construction is in the pipeline within 1–3 miles? Heavy new supply typically softens prices + rents 12–24 months out; constrained supply supports both.
Investment metrics
- 1% rule
- 0.85% ✗
- Cap rate
- 6.07%
- Cash-on-cash
- -0.78%
- DSCR
- 0.97
- GRM
- 9.8
CMA / ARV
No comps found within radius.
Projected returns pro-forma
-3.0% appreciation · 4.93% rent growth · sell at horizon
- IRR
- -15.4%
- Equity multiple
- 0.44×
- Total profit
- $-140,806
- Equity at exit
- $134,044
- IRR
- -3.9%
- Equity multiple
- 0.72×
- Total profit
- $-70,839
- Equity at exit
- $77,729
Cash invested: $251,720 (down + closing). Projections, not guarantees.
Landlord ↔ Tenant lean methodology
- Overall (STATE)
- 87 Strongly Landlord-Friendly
- State Florida
- 87 Strongly Landlord-Friendly · R+3
- County
- — inherits STATE
- City
- — inherits STATE
ZIP-level market 33143
- Rents YoY
- 4.9%
- Active inventory
- 266
- Price-to-rent
- 9.8×
Monthly cashflow live
- Estimated rent
- $7,658 high interval (Pro) →
- Mortgage (P&I)
- −$4,714
- Tax est. 1.5%
- −$1,124 /mo · $13,485/yr
- Insurance
- −$375
- HOA
- −$0
- Vacancy / Maint / Mgmt
- −$1,608
- Net cashflow
- $-163
Break-even live
Sensitivity live
| Price | -10% $458 | -5% $147 | +0% $-163 | +5% $-474 | +10% $-785 |
|---|---|---|---|---|---|
| Rent | -10% $-768 | -5% $-466 | +0% $-163 | +5% $139 | +10% $442 |
| Rate | -1.0pp $289 | -0.5pp $65 | base $-163 | +0.5pp $-396 | +1.0pp $-633 |
UW: 25.0% down · 7.5% · 30yr · 1.5% tax · 5.0% vac · 8.0% maint · 8.0% mgmt
Financing live
Cash to close
- Down payment
- $224,750
- Closing costs
- $26,970
- Reserves months
- —
- Total cash needed
- —
Loan-product check · same deal, 3 products live
Conventional
25% down · 7.5% · 30yr
- Down + closing
- —
- Monthly P&I
- —
- Monthly cashflow
- —
- DSCR
- —
- Eligible?
- —
Personal DTI + credit; lowest rate.
DSCR
20% down · 8.5% · 30yr
- Down + closing
- —
- Monthly P&I
- —
- Monthly cashflow
- —
- DSCR
- —
- Eligible?
- —
No personal income docs; deal must DSCR.
Hard money
10% down · 12.0% · 12mo
- Down + closing
- —
- Monthly P&I
- —
- Monthly cashflow
- —
- DSCR
- —
- Eligible?
- —
Short-term bridge; refi at stabilization.
Rent comps 22 comps
| Address | Beds | Baths | Sqft | Rent | $/sqft | DOM | Units | Dist |
|---|---|---|---|---|---|---|---|---|
| 6802 SW 80th St Unit 6802 South Miami, FL | 3.0 | 3.5 | 2509 | $6,450 | $2.57 | 22d | 1 | 0.63mi |
| 6802 SW 80th St Miami, FL | 3.0 | 3.5 | 2509 | $6,447 | $2.57 | 22d | 1 | 0.63mi |
| 6802 SW 80th St Miami, FL | 3.0 | 3.5 | 2509 | $6,447 | $2.57 | 26d | 1 | 0.63mi |
| 6812 SW 80th ST Miami, FL | 4.0 | 3.5 | 2509 | $6,500 | $2.59 | 26d | 1 | 0.64mi |
| 7840 SW 71st Ave Miami, FL | 3.0 | 2.0 | 2139 | $7,250 | $3.39 | 1d | 1 | 0.70mi |
| 7825 SW 72nd Ave Miami, FL | 4.0 | 3.0 | 2558 | $10,000 | $3.91 | 26d | 1 | 0.72mi |
| 7825 SW 72nd Ave Miami, FL | 3.0 | 3.0 | 2558 | $10,000 | $3.91 | 22d | 1 | 0.72mi |
| 7825 SW 72nd Ave Miami, FL | 3.0 | 3.0 | 2558 | $10,000 | $3.91 | 14d | 1 | 0.72mi |
| 8201 SW 63rd Pl Miami, FL | 3.0 | 2.0 | 1513 | $5,200 | $3.44 | 20d | 1 | 0.75mi |
| 8215 SW 63rd Pl Miami, FL | 4.0 | 3.0 | 2452 | $10,500 | $4.28 | 7d | 1 | 0.79mi |
| 8235 SW 62nd Pl South Miami, FL | 3.0 | 2.0 | 1480 | $6,200 | $4.19 | 1d | 1 | 0.86mi |
| 6466 SW 84th St Miami, FL | 4.0 | 3.5 | 2785 | $15,500 | $5.57 | 7d | 1 | 0.87mi |
| 8150 SW 72nd Ave Miami, FL | 1.0–3.0 | 1.0–3.5 | 1474 | $6,676 | $4.53 | 0d | 30 | 0.90mi |
| 7800 SW 57th Ct South Miami, FL | 3.0 | 2.0 | 2260 | $8,800 | $3.89 | 1d | 1 | 1.01mi |
| 7800 SW 57th Ct South Miami, FL | 3.0 | 2.0 | 2260 | $8,800 | $3.89 | 26d | 1 | 1.01mi |
| 6111 SW 86th St Miami, FL | 4.0 | 4.5 | 2119 | $16,000 | $7.55 | 22d | 1 | 1.08mi |
| 7544 SW 78th Ter Miami, FL | 4.0 | 3.0 | 2313 | $9,000 | $3.89 | 26d | 1 | 1.12mi |
| 7830 SW 53rd Pl Miami, FL | 4.0 | 3.5 | 2309 | $12,500 | $5.41 | 1d | 1 | 1.34mi |
| 7830 SW 53rd Pl Miami, FL | 4.0 | 3.5 | 2309 | $12,500 | $5.41 | 5d | 1 | 1.34mi |
| 7270 SW 88th St Miami, FL | 2.0–3.0 | 2.0 | 1345 | $3,950 | $2.94 | 26d | 2 | 1.37mi |
| 7975 Sunset Dr Unit 7975 Miami, FL | 4.0 | 3.0 | 2581 | $8,000 | $3.10 | 26d | 1 | 1.41mi |
| 7350 SW 89th St Unit 719S Miami, FL | 3.0 | 2.0 | 1657 | $6,500 | $3.92 | 26d | 1 | 1.47mi |
Listing history 3 events
-
2026-05-14status Pending
-
2026-02-26price $899,000
-
2026-01-29$925,000 Active
ⓘ Source: listings_history table (triggers on properties + properties_extension) + one-shot
backfill from property_details.listing_events for pre-trigger history.
Climate risk First Street
- Flood 4/10 Moderate FEMA zone X (unshaded) · 23% chance over 30 yrs
- Wildfire 1/10 Low
- Heat 10/10 Extreme 7 d/yr ≥104°F today · 29 d/yr by 30 yrs out
- Wind 10/10 Extreme 99% chance of damaging wind over 30 yrs
- Air quality 2/10 Low 1 unhealthy d/yr today · 1 by 30 yrs out
Nearby sold comps map
Loading sold comps map…
Walkable amenities ~0.75 mi
Loading nearby amenities…
Taxation est. · year 1
- Rental income
- $91,891
- − Mortgage interest
- −$50,358
- − Property taxes
- −$13,485
- − Insurance
- −$4,495
- − Repairs & maintenance
- −$7,351
- − Management
- −$7,351
- − Depreciation
- −$26,153
- Taxable loss
- −$17,302
- Est. tax savings @ 24.0%
- +$4,153
- After-tax cash flow
- $2,193/yr
For passive investors: Depreciation is non-cash, so a rental often shows a tax loss while cash-flowing — sheltering income. Rental losses are passive: they offset passive income freely, and up to $25,000/yr can offset ordinary (W-2) income if you actively participate and your MAGI is under $100k (phasing out to $0 by $150k); unused losses carry forward. On sale, claimed depreciation is recaptured at up to 25%, and gains may owe capital-gains tax (a 1031 exchange can defer both). Figures are a year-1 estimate at your 24.0% rate — not tax advice; consult a CPA.
Condition & rehab AI · 14 photos
This move-in ready townhouse in The Banyans of South Miami is in excellent condition with modern interiors and a well-maintained exterior. It offers a great opportunity for investors looking to increase both resale and rental value.
Value-add opportunities
- Both Landscaping and curb appeal improvements — Enhances curb appeal and can increase both resale and rental value
- Both Painting exterior walls — Fresh paint can improve the home's curb appeal and value
- Both Landscaping and irrigation system — Well-maintained landscaping and irrigation can increase both resale and rental value
Renovation cost estimate screening
Value-add ROI direction
- Both Landscaping and curb appeal improvements — Enhances curb appeal and can increase both resale and rental value ↑
- Both Painting exterior walls — Fresh paint can improve the home's curb appeal and value ↑
- Both Landscaping and irrigation system — Well-maintained landscaping and irrigation can increase both resale and rental value ↑
ⓘ Cost ranges are severity-bucket heuristics (US national rule-of-thumb). Get contractor quotes + a written scope before underwriting a rehab budget.
Schools (NCES district)
- District
- Miami-Dade
- NCES district ID
- 1200390
- Math proficiency
- 45% ▼ -16.00%
- Reading proficiency
- 54% ▼ -5.00%
- Median HH income
- $43,928
- Composite
- 41.76/100
- National rank
- #3397
- State rank
- #40 of 73 in FL
Livability — South Miami
- Score
- 80/100
- State rank
- #118
- US rank
- #1791
Category grades
Schools grade is shown separately in the Schools card above.
Census & demographics
- Census place
- South Miami, FL
- County
- Miami-Dade County · 2,697,751 people
- City population
- 32,167
- Metro
- Miami-Fort Lauderdale-Pompano Beach, FL
- Population (ZIP)
- 33,711
- Household income
- $83,008
- Rent vs Own
- Severe rent burden
- 1760.0
Population outlook (Miami-Dade County) Hauer SSP2
- Today (2025)
- 3,126,439 people
- By 2030
- 3,325,765 · +6.4%
- By 2040
- 3,697,561 · +18.3%
- By 2050
- 4,012,134 · +28.3%
- By 2075
- 4,605,612 · +47.3%
- By 2100
- 4,866,598 · +55.7%
Race, ethnicity, and origin ACS 2023
- Neighborhood character
- Diverse neighborhood (Simpson 0.56)
- Race & ethnicity
- Hispanic / Latino 60% Two or more races 39% White 27% Black 6% Asian 2%
- Hispanic origin (detail)
- Mexican 4% Puerto Rican 4% Cuban 27% Dominican 2% Salvadoran 2%
- Common ancestry
- Lithuanian 2% Romanian 2% Estonian 2%
- Foreign-born
- 43% · Canada, Jamaica, Dominican Republic
- Languages at home
- 34% English-only · Spanish 58% Other Indo-European 3% French/Haitian/Cajun 2%
Political lean MEDSL · Miami-Dade
- 2024 margin
- R (+11.4) · D 43.9% · R 55.4%
- 2008→2024 swing
- -27.6pp toward R · 2008: 16.1pp · 2024: -11.4pp
- All cycles
- 2024: R+11.4 2020: D+7.3 2016: D+29.6 2012: D+23.7 2008: D+16.1
Not yet ingested
- Civics
- —
Market trends
- HPI YoY
- ▼ -793.78%
- Current HPI
- 490.5935
- Rent YoY
- ▲ 4.93%
- Metro
- Miami-Fort Lauderdale-Pompano Beach, FL
- State GDP YoY
- ▲ 3.28%
- F500 in state
- 36
Industry mix (Fortune 500 HQ in FL)
| Industry | F500 HQs | Revenue |
|---|---|---|
| Industrial Technology | 2 | $29B |
|
||
| Insurance | 2 | $17B |
|
||
| Retail | 1 | $60B |
|
||
| Technology Distribution | 1 | $58B |
|
||
| Homebuilding | 1 | $35B |
|
||
| Technology Manufacturing | 1 | $35B |
|
||
Price history
-2.8% since first listed3 events — show timeline
- 2026-05-14 Pending — MARMLS
- 2026-02-26 Price Changed $899,000 MARMLS
- 2026-01-29 Listed $925,000 MARMLS
Cash-flow waterfall
monthlySold comps — $/sqft
last 12 mo · ≤1 miLoading sold comps…