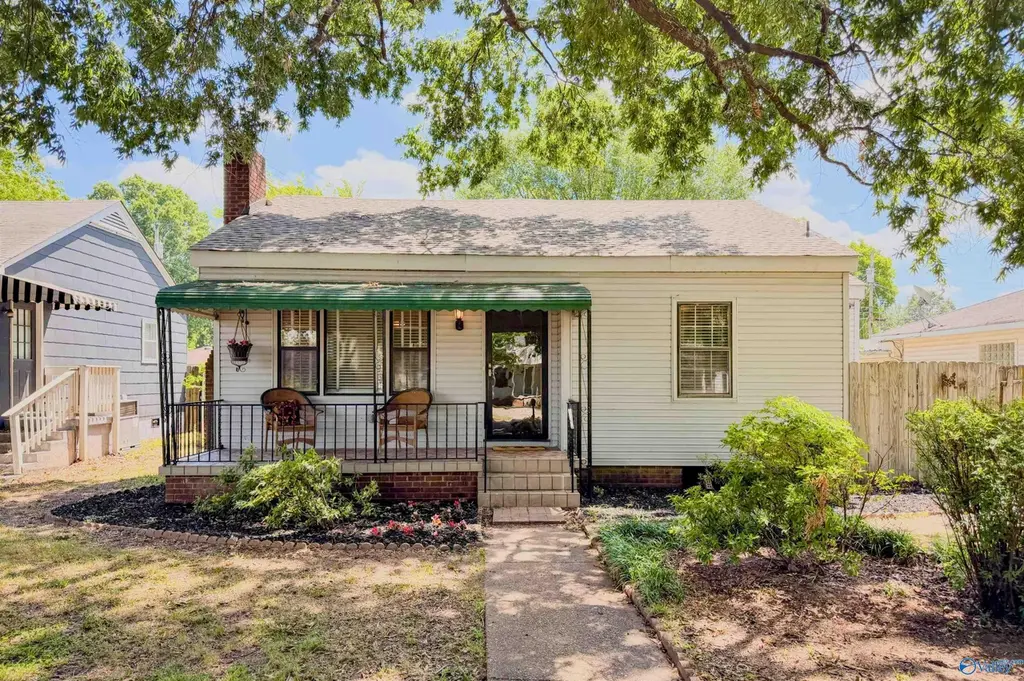
1110 7th Ave · Decatur, AL
Flood risk 5/10 · Moderate
- FEMA flood zone
- X (unshaded)
- Chance of flooding over 30 yrs
- 0.66%
- Est. flood insurance / yr
- $507 – $1,088
Fire risk 1/10 · Minimal
- Est. fire insurance / yr
- $916 – $1,700
Heat risk 6/10 · Moderate
- Hot days now (above 106°F)
- 7 days/yr
- Hot days in 30 yrs
- 19 days/yr
Wind risk 4/10 · Minor
- Chance of severe wind over 30 yrs
- 21.0%
Air-quality risk 2/10 · Minimal
- Unhealthy air days now
- 1 days/yr
- Unhealthy air days in 30 yrs
- 1 days/yr
Risk factors via First Street. Map © Google.
Why this score? — see what drove the D+ grade
The composite is a weighted blend of 9 inputs, each scored 0–100. Each bar is that input's sub-score; the figure is the points it added to the 100-point composite (weight × sub-score).
- Cash flow +14.9/30.0
- ARV discount +11.9/15.0
- DSCR +4.6/10.0
- Rent growth +3.7/5.0
- Livability +3.6/5.0
- 1% rule +3.2/10.0
- Schools +2.6/10.0
- Condition / age +2.5/5.0
- Appreciation +0.0/10.0
$159,900
🖨 Deal sheet (PDF) 📄 Offer letter ✓ Due diligence
Listing remarks
Check out this super adorable 3-bedroom, 2-bath home conveniently located in Southeast Decatur, just minutes from Point Mallard Park, Decatur Morgan Hospital, and vibrant downtown Decatur. This charming home is full of character and warmth, offering the perfect blend of comfort and convenience. Whether you're a first-time homebuyer, downsizing, or looking for your next investment, this cute and cozy home is ready to welcome its next owner!
Key facts
- Point mallard park
- Southeast decatur
- Downtown decatur
Tags
Property features AI
Finance
- Other: Subdivision: Dli&F Co Add 3
- Financial info: No financial or investment details provided
- HOA & community: No homeowners association
Exterior
- Parking: Concrete driveway
- Security: No security features provided
- Utilities: Public water; Public sewer; Electric service (standard)
- Home design: Single-family residence; One level; Built in 1957; Living area approximately 1,305 square feet
- Construction: Vinyl siding exterior
- Exterior features: Public water; Public sewer
Interior
- Kitchen: No kitchen appliance details provided
- Bedrooms: Information on bedroom count or levels not provided
- Flooring: No flooring details provided
- Bathrooms: 2 full bathrooms
- Heating & cooling: Central heating; Central cooling
- Interior features: Crawl space basement; One fireplace
- Laundry & utility: No laundry or utility room details provided
Neighborhood map
What this means for you Summary
Snapshot
- This is a 3-bed/1.0-bath single-family listed at $160k.
Deal economics
- At list price, monthly cash flow is $47 ($562/yr) — positive.
- The deal already cash-flows at list — no discount required.
- To meet the 1% rule (rent ≥ 1% of price), the offer needs to be $132k (17.7% below list).
- Recommended offer: $132k (17.7% below list) — sets the bar for 1% rule.
- Cap rate 6.6% vs local median 4.0% in Decatur — top-decile yield for the area; either an underpriced asset or a hidden risk that comps aren't pricing in. Stress-test before assuming the spread holds.
Location & tenants
- Location reads 72/100 on livability (#28 in AL) — a middle-class / working-renter tenant base. Strengths: cost of living A+, housing A+, health & safety A+; Watch: employment D+, crime F, amenities F.
- Decatur City (urban): math 22% / reading 40% proficiency, ranked #66 of 129 in AL (top 51%) — families likely to look elsewhere, expect single-tenant / working-renter base with shorter leases.
- Zoned schools: Bankscaddell Elementary School (math 16% / reading 30%, grade F, #431 of 627 statewide, top 69%, 453 students, 88% FRL); Decatur Middle School (math 17% / reading 36%, grade F, #150 of 257 statewide, top 60%, 815 students, 77% FRL); Decatur High School (math 27% / reading 27%, grade F, #90 of 305 statewide, top 35%, 1,040 students, 67% FRL) — zoned schools average 77% FRL vs 57% district-wide (21 pts higher); higher-poverty schools than district average — tighter screening recommended.
- Market conditions: Rents rising fast (+4.7%/yr); 225 active listings in the ZIP; 25 comparable units currently listed for rent nearby; rentals lingering (median 46d on market — plan ~5-8 weeks vacancy on turnover, expect pricing pressure); 76% of comp listings sitting > 30 days — soft ceiling on asking rent; 231 units permitted in Morgan County in 2024 (0 in 5+ unit buildings).
- This rent runs 31% of the median local income ($51k/yr) — at the standard rent-burdened threshold; future hikes will face affordability resistance.
Forward outlook
- Local home prices are declining (-3.0%/yr); year-one equity from $1k of loan paydown is wiped out by about $5k of value loss. Plan a longer hold.
- Morgan County population projected at -11% by 2050 — secular population decline; favor cash flow + early exit over multi-decade hold.
Negotiation context
- It's been on market 32 days — a 3% lower offer ($155k) is reasonable based on typical stale-listing flexibility.
- Current owner paid $85k; list at $160k implies a 88% gain — meaningful room to come down on a strong offer.
Risks & watch-outs
- Watch-outs: built in 1957 — expect roof / HVAC / electrical / plumbing capex.
- Climate carrying-cost: moderate flood risk; extreme-heat days projected 7→19/yr by 2055 (HVAC capex compounding) — expect insurance premiums to compound above CPI over the hold.
Questions for the listing agent
- It's been on market 32 days. Have you received any prior offers? Is the seller open to a 18% concession, seller financing, or rate buy-down credit?
- Built in 1957 — when were the roof, HVAC, electrical panel, plumbing, and water heater last replaced?
- Is there a deadline driving the sale (1031 exchange, divorce, estate, relocation)? That informs how much negotiation room exists.
- Crime grade is F in this area — have there been break-ins, vandalism, or insurance claims at this property in the last 3 years? What carrier currently insures it and at what premium?
- The area grade is low — what's the realistic commute time and amenity access for the typical tenant pool here? Any planned neighborhood developments (good or bad) we should know about?
- What's the average days-on-market for RENTAL listings here right now (not sales)? A rising rental-DOM trend means longer vacancies and softer asking-rent achievability than the comps imply.
- What's the recent tenant-quality profile in this submarket — average credit score on applications, eviction rate, late-payment / NSF rate, and stable-employment percentage? A property-management company in the area should have these aggregated.
- How much new for-sale + rental construction is in the pipeline within 1–3 miles? Heavy new supply typically softens prices + rents 12–24 months out; constrained supply supports both.
Investment metrics
- 1% rule
- 0.82% ✗
- Cap rate
- 6.64%
- Cash-on-cash
- 1.25%
- DSCR
- 1.06
- GRM
- 10.1
CMA / ARV
- ARV (on-the-fly)
- $177,112
- Comps found
- 12
Show comp detail 12 sales within ~0.75 mi
| Address | Dist | Beds/Ba | Sqft | Sold | Price | $/sf | Match |
|---|---|---|---|---|---|---|---|
| 1112 9th Ave SE | 0.14mi | 3/1.5 | 1,295 (-4%) | 3mo | $157,000 | $121 | 82 |
| 1213 SE 8th Ave | 0.15mi | 2/2.0 (-1) | 1,411 (+4%) | 5mo | $125,000 | $89 | 73 |
| 909 7th Ave SE | 0.25mi | 4/1.0 (+1) | 1,404 (+4%) | 6mo | $115,000 | $82 | 72 |
| 1419 10th Ave SE | 0.45mi | 3/1.5 | 1,320 (-2%) | 2mo | $175,000 | $133 | 71 |
| 909 9th St SE | 0.27mi | 2/1.0 (-1) | 1,230 (-9%) | 2mo | $182,000 | $148 | 66 |
| 1002 7th Ave SE | 0.16mi | 3/2.0 | 1,172 (-13%) | 2mo | $153,000 | $131 | 65 |
| 211 Prospect Dr SE | 0.61mi | 2/1.5 (-1) | 1,330 (-2%) | 3mo | $160,000 | $120 | 59 |
| 819 3rd Ave SE | 0.46mi | 3/2.0 | 1,232 (-9%) | 3mo | $184,000 | $149 | 57 |
| 1512 10th Ave SE | 0.57mi | 3/2.0 | 1,430 (+6%) | 6mo | $155,000 | $108 | 55 |
| 1409 8th Ave SE | 0.37mi | 4/2.0 (+1) | 1,512 (+12%) | 1mo | $222,000 | $147 | 53 |
| 809 13th Ave SE | 0.53mi | 3/2.0 | 1,511 (+12%) | 2mo | $219,000 | $145 | 50 |
| 120 SW Cecil St | 0.63mi | 3/1.5 | 1,528 (+13%) | 2mo | $185,000 | $121 | 45 |
Match score weights: distance 35% · size 25% · config 20% · recency 20%. Top-matched comps best support the ARV.
Projected returns pro-forma
-3.0% appreciation · 4.67% rent growth · sell at horizon
- IRR
- -12.7%
- Equity multiple
- 0.54×
- Total profit
- $-20,729
- Equity at exit
- $23,842
- IRR
- -1.5%
- Equity multiple
- 0.89×
- Total profit
- $-4,863
- Equity at exit
- $13,825
Cash invested: $44,772 (down + closing). Projections, not guarantees.
Landlord ↔ Tenant lean methodology
- Overall (STATE)
- 90 Strongly Landlord-Friendly
- State Alabama
- 90 Strongly Landlord-Friendly · R+15
- County
- — inherits STATE
- City
- — inherits STATE
ZIP-level market 35601
- Home prices YoY
- -26.5%
- Rents YoY
- 4.7%
- Active inventory
- 225
- Price-to-rent
- 10.1×
Monthly cashflow live
- Estimated rent
- $1,316 high interval (Pro) →
- Mortgage (P&I)
- −$839
- Tax from tax record
- −$88 /mo · $1,055/yr
- Insurance
- −$67
- HOA
- −$0
- Lot rent
- −$0
- Vacancy / Maint / Mgmt
- −$276
- Net cashflow
- $47
Break-even live
Sensitivity live
| Price | -10% $137 | -5% $92 | +0% $47 | +5% $2 | +10% $-44 |
|---|---|---|---|---|---|
| Rent | -10% $-57 | -5% $-5 | +0% $47 | +5% $99 | +10% $151 |
| Rate | -1.0pp $127 | -0.5pp $87 | base $47 | +0.5pp $5 | +1.0pp $-37 |
UW: 25.0% down · 7.5% · 30yr · 1.5% tax · 5.0% vac · 8.0% maint · 8.0% mgmt
Financing live
Cash to close
- Down payment
- $39,975
- Closing costs
- $4,797
- Reserves months
- —
- Total cash needed
- —
Loan-product check · same deal, 3 products live
Conventional
25% down · 7.5% · 30yr
- Down + closing
- —
- Monthly P&I
- —
- Monthly cashflow
- —
- DSCR
- —
- Eligible?
- —
Personal DTI + credit; lowest rate.
DSCR
20% down · 8.5% · 30yr
- Down + closing
- —
- Monthly P&I
- —
- Monthly cashflow
- —
- DSCR
- —
- Eligible?
- —
No personal income docs; deal must DSCR.
Hard money
10% down · 12.0% · 12mo
- Down + closing
- —
- Monthly P&I
- —
- Monthly cashflow
- —
- DSCR
- —
- Eligible?
- —
Short-term bridge; refi at stabilization.
Rent comps 25 comps
| Address | Beds | Baths | Sqft | Rent | $/sqft | DOM | Units | Dist |
|---|---|---|---|---|---|---|---|---|
| 603 Prospect Dr SE Decatur, AL | 3.0 | 1.0 | 1362 | $1,795 | $1.32 | 46d | 1 | 0.46mi |
| 818 Grant St SE Decatur, AL | 2.0 | 1.0 | 910 | $1,300 | $1.43 | 46d | 1 | 0.76mi |
| 1707 Buena Vista Cir SE Decatur, AL | 3.0 | 2.0 | 1756 | $1,350 | $0.77 | 46d | 1 | 0.77mi |
| 1628 8th St SE Decatur, AL | 2.0 | 1.0 | 1012 | $1,200 | $1.19 | 46d | 1 | 0.77mi |
| 315 Hillside Rd SW Decatur, AL | 3.0 | 1.5 | 1344 | $1,400 | $1.04 | 46d | 1 | 0.79mi |
| 1018 Grant St SE Unit 1026-4 Decatur, AL | 2.0 | 1.0 | 890 | $800 | $0.90 | 46d | 1 | 0.79mi |
| 1018 Grant St SE Unit 1018-4 Decatur, AL | 2.0 | 1.0 | 890 | $775 | $0.87 | 46d | 1 | 0.80mi |
| 1801 7th St SE Decatur, AL | 4.0 | 2.0 | 1475 | $1,550 | $1.05 | 46d | 1 | 0.82mi |
| 1221 North St SE Decatur, AL | 2.0 | 1.0 | 937 | $775 | $0.83 | 46d | 2 | 0.85mi |
| 1821 7th St SE Decatur, AL | 3.0 | 1.0 | 908 | $1,100 | $1.21 | 25d | 1 | 0.88mi |
| 1205 Broadus Ave SE Decatur, AL | 3.0 | 2.0 | 1306 | $1,195 | $0.92 | 46d | 1 | 0.98mi |
| 1602 Brookridge Dr SW Decatur, AL | 1.0–2.0 | 1.0–2.0 | 797 | $1,174 | $1.47 | 46d | 13 | 1.01mi |
| 102 Elm Ct NE Decatur, AL | 3.0 | 1.0 | 1216 | $1,450 | $1.19 | 25d | 1 | 1.01mi |
| 609 7th Ave SW Decatur, AL | 4.0 | 2.0 | 1380 | $1,425 | $1.03 | 46d | 1 | 1.18mi |
| 516 Ferry St NE Decatur, AL | 2.0 | 1.0 | 900 | $1,150 | $1.28 | 25d | 1 | 1.21mi |
| 1314 Pennylane SE Decatur, AL | 3.0 | 1.5 | 1100 | $1,198 | $1.09 | 25d | 1 | 1.23mi |
| 2136 Eastbrook SE Decatur, AL | 2.0 | 2.0 | 1400 | $1,495 | $1.07 | 46d | 1 | 1.28mi |
| 2115 Central Pkwy SW Decatur, AL | 1.0–3.0 | 1.0 | 821 | $950 | $1.16 | 46d | 1 | 1.33mi |
| 201 Bluebird Ln SW Decatur, AL | 2.0 | 1.0 | 950 | $898 | $0.94 | 46d | 11 | 1.40mi |
| 225 5th Ave NW Decatur, AL | 3.0 | 2.0 | 1496 | $1,300 | $0.87 | 46d | 1 | 1.42mi |
| 206 Larkwood Dr SW Decatur, AL | 4.0 | 2.0 | 1630 | $1,500 | $0.92 | 46d | 1 | 1.44mi |
| 213 Wilson St NE Unit 2 Decatur, AL | 2.0 | 1.0 | 975 | $875 | $0.90 | 25d | 1 | 1.45mi |
| 213 Wilson St NE Unit 4 Decatur, AL | 2.0 | 1.0 | 975 | $700 | $0.72 | 25d | 1 | 1.45mi |
| 14 Walnut St NE Decatur, AL | 3.0 | 2.5 | 1430 | $1,700 | $1.19 | 46d | 1 | 1.47mi |
| 1805 8th Ave SW Decatur, AL | 3.0 | 2.0 | 1725 | $1,750 | $1.01 | 46d | 1 | 1.47mi |
Listing history 21 events
-
2026-06-22days on market $159,900 Active 32 DOM
-
2026-06-21pricedays on market $159,900 Active 31 DOM
-
2026-06-19days on market $169,900 Active 29 DOM
-
2026-06-18days on market $169,900 Active 28 DOM
-
2026-06-17days on market $169,900 Active 27 DOM
-
2026-06-16days on market $169,900 Active 26 DOM
-
2026-06-15days on market $169,900 Active 25 DOM
-
2026-06-14days on market $169,900 Active 23 DOM
-
2026-06-13days on market $169,900 Active 22 DOM
-
2026-06-10days on market $169,900 Active 20 DOM
-
2026-06-09days on market $169,900 Active 19 DOM
-
2026-06-08days on market $169,900 Active 18 DOM
-
2026-06-07days on market $169,900 Active 17 DOM
-
2026-06-05days on market $169,900 Active 14 DOM
-
2026-06-03days on market $169,900 Active 13 DOM
-
2026-06-02days on market $169,900 Active 12 DOM
-
2026-06-01days on market $169,900 Active 11 DOM
-
2026-05-31days on market $169,900 Active 10 DOM
-
2026-05-30days on market $169,900 Active 9 DOM
-
2026-05-21$169,900 Active
-
2006-10-20soldstatus $85,000
ⓘ Source: listings_history table (triggers on properties + properties_extension) + one-shot
backfill from property_details.listing_events for pre-trigger history.
Tax reassessment forecast AL · Resets to sale price
- Current annual tax
- $1,055 · $88/mo
- Projected year-2 tax
- $1,055 · $88/mo
- Expected delta
- $0/yr ($0/mo · 0.0%)
ⓘ Screening estimate from a state-policy table — verify with the county assessor before closing.
Climate risk First Street
- Flood 5/10 Major FEMA zone X (unshaded) · 66% chance over 30 yrs
- Wildfire 1/10 Low
- Heat 6/10 Major 7 d/yr ≥106°F today · 19 d/yr by 30 yrs out
- Wind 4/10 Moderate 21% chance of damaging wind over 30 yrs
- Air quality 2/10 Low 1 unhealthy d/yr today · 1 by 30 yrs out
Nearby sold comps map
Loading sold comps map…
Walkable amenities ~0.75 mi
Loading nearby amenities…
Taxation est. · year 1
- Rental income
- $15,795
- − Mortgage interest
- −$8,957
- − Property taxes
- −$1,055
- − Insurance
- −$800
- − Repairs & maintenance
- −$1,264
- − Management
- −$1,264
- − Depreciation
- −$4,652
- Taxable loss
- −$2,195
- Est. tax savings @ 24.0%
- +$527
- After-tax cash flow
- $1,089/yr
For passive investors: Depreciation is non-cash, so a rental often shows a tax loss while cash-flowing — sheltering income. Rental losses are passive: they offset passive income freely, and up to $25,000/yr can offset ordinary (W-2) income if you actively participate and your MAGI is under $100k (phasing out to $0 by $150k); unused losses carry forward. On sale, claimed depreciation is recaptured at up to 25%, and gains may owe capital-gains tax (a 1031 exchange can defer both). Figures are a year-1 estimate at your 24.0% rate — not tax advice; consult a CPA.
Schools (NCES district)
- District
- Decatur City
- NCES district ID
- 0101170
- Math proficiency
- 22% ▼ -27.00%
- Reading proficiency
- 40% ▼ -1.00%
- Median HH income
- $42,170
- Composite
- 26.21/100
- National rank
- #7261
- State rank
- #66 of 129 in AL
Livability — Decatur
- Score
- 72/100
- State rank
- #28
- US rank
- #5989
Category grades
Schools grade is shown separately in the Schools card above.
Census & demographics
- Census place
- Decatur, AL
- County
- Morgan County · 67,628 people
- City population
- 67,628
- Metro
- Decatur, AL
- Population (ZIP)
- 35,449
- Household income
- $51,429
- Rent vs Own
- Severe rent burden
- 1386.0
Population outlook (Morgan County) Hauer SSP2
- Today (2025)
- 118,775 people
- By 2030
- 116,979 · -1.5%
- By 2040
- 111,800 · -5.9%
- By 2050
- 105,181 · -11.4%
- By 2075
- 87,736 · -26.1%
- By 2100
- 67,624 · -43.1%
Race, ethnicity, and origin ACS 2023
- Neighborhood character
- Diverse neighborhood (Simpson 0.66)
- Race & ethnicity
- White 47% Hispanic / Latino 24% Black 24% Two or more races 10% Native American 2%
- Hispanic origin (detail)
- Mexican 15% Puerto Rican 2%
- Common ancestry
- Slovak 1% Italian 1% Lithuanian 1%
- Foreign-born
- 10% · Canada
- Languages at home
- 81% English-only · Spanish 18%
Political lean MEDSL · Morgan
- 2024 margin
- Solid R (+52.6) · D 23.2% · R 75.8%
- 2008→2024 swing
- -8.8pp toward R · 2008: -43.8pp · 2024: -52.6pp
- All cycles
- 2024: R+52.6 2020: R+49.2 2016: R+52.4 2012: R+44.5 2008: R+43.8
Not yet ingested
- Civics
- —
Market trends
- HPI YoY
- ▼ -89.26%
- Current HPI
- 247.8437
- Rent YoY
- ▲ 4.67%
- Metro
- Decatur, AL
- State GDP YoY
- ▲ 2.94%
- F500 in state
- 4
Industry mix (Fortune 500 HQ in AL)
| Industry | F500 HQs | Revenue |
|---|---|---|
| Financial Services | 1 | $8B |
|
||
| Healthcare | 1 | $5B |
|
||
Price history
+88.1% since first listed3 events — show timeline
- 2026-06-19 Price Changed $159,900 VMLS
- 2026-05-21 Listed $169,900 VMLS
- 2006-10-20 Sold (Public Records) $85,000 Public Records
Property tax history
+11.8%/yrLatest (2025): $1,055 · +7.0% YoY. Source: county tax records.
Cash-flow waterfall
monthlySold comps — $/sqft
last 12 mo · ≤1 miLoading sold comps…