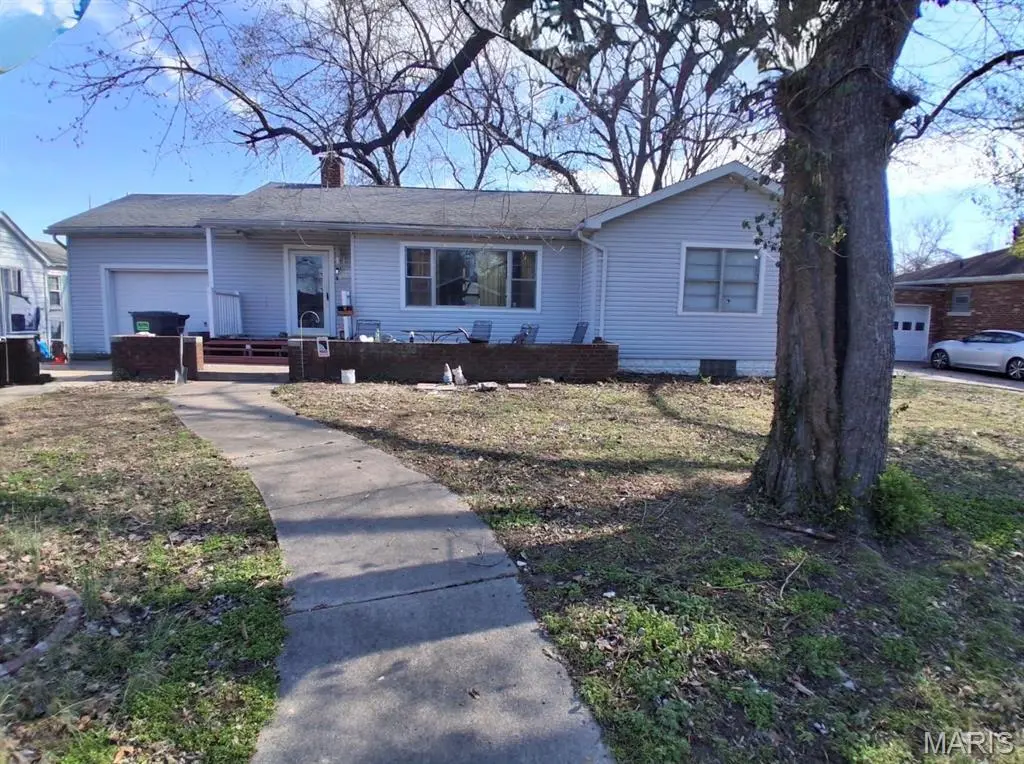
7305 Northern Dr · Belleville, IL
Flood risk 1/10 · Minimal
- FEMA flood zone
- X
- Chance of flooding over 30 yrs
- 0.0%
- Est. flood insurance / yr
- $473 – $860
Fire risk 1/10 · Minimal
- Est. fire insurance / yr
- $804 – $1,492
Heat risk 5/10 · Moderate
- Hot days now (above 107°F)
- 7 days/yr
- Hot days in 30 yrs
- 21 days/yr
Wind risk 2/10 · Minimal
- Chance of severe wind over 30 yrs
- 1.0%
Air-quality risk 3/10 · Minor
- Unhealthy air days now
- 2 days/yr
- Unhealthy air days in 30 yrs
- 4 days/yr
Risk factors via First Street. Map © Google.
Why this score? — see what drove the C+ grade
The composite is a weighted blend of 9 inputs, each scored 0–100. Each bar is that input's sub-score; the figure is the points it added to the 100-point composite (weight × sub-score).
- ARV discount +15.0/15.0
- Cash flow +14.8/30.0
- Appreciation +9.8/10.0
- 1% rule +5.1/10.0
- DSCR +4.5/10.0
- Livability +3.9/5.0
- Rent growth +2.5/5.0
- Condition / age +2.5/5.0
- Schools +2.2/10.0
$130,000
🖨 Deal sheet 📄 Offer letter ✓ Due diligence
Listing remarks MLS
Charming 2-bedroom 1.5 bath home with a full unfinished basement. The home features a spacious living & dining room, hardwood flooring, and new flooring in the kitchen. The full basement could double your living space offering excellent added value and includes an additional bathroom that was just updated. The property also includes a 1-car attached garage and a large fenced backyard complete with a versatile workshop building, ideal for hobbies, storage, or workspace. The workshop is equipped with electric. Conveniently located near the St. Clair County Country Club, this home offers great potential. Call today to schedule your appt.
Key facts
- Hardwood flooring
- Newer roof
- Dual closets
Tags
Property features AI
Finance
- Other: Possession: Close plus 15 days; Earnest money is held
- Financial info: Special service area: No
- HOA & community: No master association fee required
Exterior
- Parking: Attached garage (1 garage space); Total parking for 4 vehicles
- Utilities: Public water; Public sewer
- Home design: Detached single-family home; One-story layout; Built approximately 71–80 years ago; Built before 1978
- Construction: Vinyl siding exterior; Unfinished full basement; Structure age: 71–80 years
- Exterior features: Lot dimensions approximately 78 x 145; Lot roughly 0.25–0.49 acre; Vinyl siding
Interior
- Kitchen: Kitchen on main level — 9 x 13, vinyl flooring
- Bedrooms: Master bedroom (main level) — 15 x 15, hardwood flooring; Bedroom 2 (main level) — 12 x 10, hardwood flooring; Additional bedrooms listed
- Flooring: Hardwood flooring in living areas and bedrooms; Vinyl flooring in kitchen
- Bathrooms: 2 full bathrooms; Basement bathroom present
- Heating & cooling: Natural gas forced-air heating; Central air conditioning
- Interior features: 5 total rooms; Unfinished full basement
- Laundry & utility: Main-level laundry room
Neighborhood map
What this means for you Summary
Snapshot
- This is a 2-bed/2.0-bath single-family listed at $130k.
Deal economics
- At list price, monthly cash flow is $35 ($417/yr) — positive.
- The deal already cash-flows at list — no discount required.
- Meets the 1% rule at list price ($1k rent vs $130k).
Location & tenants
- Location reads 78/100 on livability (#142 in IL, #2,604 nationally) — a middle-class / working-renter tenant base. Strengths: commute A+, cost of living A+, housing A+; Watch: crime F, amenities D-.
- Belleville Twp Hsd 201 (suburban): math 21% / reading 28% proficiency, ranked #308 of 620 in IL (top 50%) — low school quality limits family demand, transient renter base, plan for 1-2y turnover.
- Market conditions: 103 active listings in the ZIP; 4 comparable units currently listed for rent nearby; rentals leasing fast (median 12d on market — plan ~1-2 weeks tenant-placement turnaround); 783 units permitted in St. Clair County in 2024 (378 in 5+ unit buildings).
Forward outlook
- In year one you build about $13k of equity ($899 loan paydown + $12k appreciation (9.5% local appreciation)).
- St. Clair County population projected at -23% by 2050 — secular population decline; favor cash flow + early exit over multi-decade hold.
- At projected returns (9.5% appreciation + 3.0% rent growth), your $36k cash investment doubles in ~3 years — after that, you're playing with house money.
- By year 3, paydown + projected appreciation supports a ~$33k cash-out refi (75% LTV) — recoverable capital for the next deal without selling this one.
Negotiation context
- Only 2 days on market — expect competitive offers; lowballing is unlikely to land.
- 2 sale attempts with the ask held roughly flat each time — persistent listings suggest the price (not the market) is what's stuck; bring a comps-based counter.
- Current owner paid $61k; list at $130k implies a 113% gain — meaningful room to come down on a strong offer.
Risks & watch-outs
- Watch-outs: built in 1950 — expect roof / HVAC / electrical / plumbing capex.
- Climate carrying-cost: extreme-heat days projected 7→21/yr by 2055 (HVAC capex compounding) — expect insurance premiums to compound above CPI over the hold.
Questions for the listing agent
- Built in 1950 — when were the roof, HVAC, electrical panel, plumbing, and water heater last replaced?
- Is there a deadline driving the sale (1031 exchange, divorce, estate, relocation)? That informs how much negotiation room exists.
- Crime grade is F in this area — have there been break-ins, vandalism, or insurance claims at this property in the last 3 years? What carrier currently insures it and at what premium?
- What's the average days-on-market for RENTAL listings here right now (not sales)? A rising rental-DOM trend means longer vacancies and softer asking-rent achievability than the comps imply.
- What's the recent tenant-quality profile in this submarket — average credit score on applications, eviction rate, late-payment / NSF rate, and stable-employment percentage? A property-management company in the area should have these aggregated.
- How much new for-sale + rental construction is in the pipeline within 1–3 miles? Heavy new supply typically softens prices + rents 12–24 months out; constrained supply supports both.
Investment metrics
- 1% rule
- 1.01% ✓
- Cap rate
- 6.61%
- Cash-on-cash
- 1.15%
- DSCR
- 1.05
- GRM
- 8.3
CMA / ARV
- ARV (on-the-fly)
- $166,992
- Comps found
- 12
Show comp detail 12 sales within ~0.75 mi
| Address | Dist | Beds/Ba | Sqft | Sold | Price | $/sf | Match |
|---|---|---|---|---|---|---|---|
| 233 Sunset Dr | 0.17mi | 3/1.0 (+1) | 1,183 (+4%) | 0mo | $159,900 | $135 | 76 |
| 245 Oliver Lee Dr | 0.18mi | 2/1.0 | 1,245 (+10%) | 3mo | $20,000 | $16 | 69 |
| 7522 Claymont Ct #3 | 0.16mi | 3/2.0 (+1) | 1,260 (+11%) | 2mo | $149,500 | $119 | 67 |
| 13 Chamberlain Ct | 0.68mi | 2/1.0 | 1,110 (-2%) | 1mo | $165,000 | $149 | 60 |
| 204 Whitehall Ct | 0.60mi | 3/2.0 (+1) | 1,184 (+4%) | 5mo | $149,900 | $127 | 56 |
| 311 Chevy Chase Dr | 0.70mi | 3/2.5 (+1) | 1,176 (+4%) | 1mo | $245,000 | $208 | 54 |
| 905 Blue Ridge Dr | 0.63mi | 3/1.0 (+1) | 1,152 (+1%) | 6mo | $181,500 | $158 | 54 |
| 408 Southgate Dr | 0.65mi | 2/1.0 | 1,068 (-6%) | 2mo | $159,500 | $149 | 54 |
| 23 Windsor Dr | 0.66mi | 2/1.0 | 1,198 (+6%) | 5mo | $155,000 | $129 | 52 |
| 108 Lakeview Dr | 0.53mi | 3/1.0 (+1) | 1,040 (-8%) | 1mo | $165,000 | $159 | 52 |
| 45 Sherwood Frst | 0.74mi | 2/1.5 | 966 (-15%) | 8mo | $110,000 | $114 | 32 |
| 408 Blue Ridge Dr | 0.70mi | 3/1.0 (+1) | 1,296 (+14%) | 9mo | $190,000 | $147 | 27 |
Match score weights: distance 35% · size 25% · config 20% · recency 20%. Top-matched comps best support the ARV.
Projected returns pro-forma
9.5% appreciation · 3.0% rent growth · sell at horizon
- IRR
- 24.1%
- Equity multiple
- 2.89×
- Total profit
- $68,665
- Equity at exit
- $112,399
- IRR
- 21.5%
- Equity multiple
- 6.48×
- Total profit
- $199,565
- Equity at exit
- $237,544
Cash invested: $36,400 (down + closing). Projections, not guarantees.
Landlord ↔ Tenant lean methodology
- Overall (STATE)
- 43 Moderately Tenant-Leaning
- State Illinois
- 43 Moderately Tenant-Leaning · D+7
- County
- — inherits STATE
- City
- — inherits STATE
ZIP-level market 62223
- Home prices YoY
- 3.8%
- Active inventory
- 103
- Price-to-rent
- 8.3×
Monthly cashflow live
- Estimated rent
- $1,309 medium interval (Pro) →
- Mortgage (P&I)
- −$682
- Tax from tax record
- −$263 /mo · $3,157/yr
- Insurance
- −$54
- HOA
- −$0
- Vacancy / Maint / Mgmt
- −$275
- Net cashflow
- $35
Break-even live
UW: 25.0% down · 7.5% · 30yr · 1.5% tax · 5.0% vac · 8.0% maint · 8.0% mgmt
Financing live
Cash to close
- Down payment
- $32,500
- Closing costs
- $3,900
- Reserves months
- —
- Total cash needed
- —
Loan-product check · same deal, 3 products live
Conventional
25% down · 7.5% · 30yr
- Down + closing
- —
- Monthly P&I
- —
- Monthly cashflow
- —
- DSCR
- —
- Eligible?
- —
Personal DTI + credit; lowest rate.
DSCR
20% down · 8.5% · 30yr
- Down + closing
- —
- Monthly P&I
- —
- Monthly cashflow
- —
- DSCR
- —
- Eligible?
- —
No personal income docs; deal must DSCR.
Hard money
10% down · 12.0% · 12mo
- Down + closing
- —
- Monthly P&I
- —
- Monthly cashflow
- —
- DSCR
- —
- Eligible?
- —
Short-term bridge; refi at stabilization.
Rent comps 4 comps
| Address | Beds | Baths | Sqft | Rent | $/sqft | DOM | Units | Dist |
|---|---|---|---|---|---|---|---|---|
| 920 S 74th St Belleville, IL | 2.0 | 1.0 | 1300 | $1,400 | $1.08 | 12d | 1 | 0.63mi |
| 6105 W Washington St Belleville, IL | 3.0 | 1.5 | 1120 | $1,575 | $1.41 | 23d | 1 | 0.69mi |
| 7235 Westfield Plaza Dr Belleville, IL | 1.0–2.0 | 1.0 | 795 | $975 | $1.23 | 2d | 1 | 1.17mi |
| 5784 Brett Michael Ln Belleville, IL | 1.0–2.0 | 1.0–2.0 | 801 | $1,195 | $1.49 | 7d | 7 | 1.30mi |
Listing history 16 events
-
2026-06-18days on market $130,000 Active 2 DOM
-
2026-06-16remarks 699-char remark
-
2026-06-16days on market $130,000 Active 1 DOM
-
2026-06-08days on market $130,000 Active 77 DOM
-
2026-06-07days on market $130,000 Active 76 DOM
-
2026-06-03days on market $130,000 Active 72 DOM
-
2026-06-02days on market $130,000 Active 71 DOM
-
2026-06-01days on market $130,000 Active 70 DOM
-
2026-05-31days on market $130,000 Active 69 DOM
-
2026-04-15price $130,000
-
2026-04-14$130,000 Active 646-char remark
Show marketing remark (646 chars)
Charming 2-bedroom 1.5 bath home with a full unfinished basement. The home features a spacious living & dining room, hardwood flooring, and new flooring in the kitchen. The full basement could double your living space offering excellent added value and includes an additional bathroom that was just updated. The property also includes a 1-car attached garage and a large fenced backyard complete with a versatile workshop building, ideal for hobbies, storage, or workspace. The workshop is equipped with electric. Conveniently located near the St. Clair County Country Club, this home offers great potential. Call today to schedule your appt.
-
2026-03-22$135,000 Active
-
1992-04-20soldstatus $61,000
-
1992-04-20soldstatus $61,000
-
1991-03-18soldstatus $60,000
-
1991-03-18soldstatus $60,000
ⓘ Source: listings_history table (triggers on properties + properties_extension) + one-shot
backfill from property_details.listing_events for pre-trigger history.
Tax reassessment forecast IL · Partial reset (capped growth)
- Current annual tax
- $3,157 · $263/mo
- Projected year-2 tax
- $3,157 · $263/mo
- Expected delta
- $0/yr ($0/mo · 0.0%)
ⓘ Screening estimate from a state-policy table — verify with the county assessor before closing.
Climate risk First Street
- Flood 1/10 Low FEMA zone X · 0% chance over 30 yrs
- Wildfire 1/10 Low
- Heat 5/10 Major 7 d/yr ≥107°F today · 21 d/yr by 30 yrs out
- Wind 2/10 Low 100% chance of damaging wind over 30 yrs
- Air quality 3/10 Moderate 2 unhealthy d/yr today · 4 by 30 yrs out
Nearby sold comps map
Loading sold comps map…
Walkable amenities ~0.75 mi
Loading nearby amenities…
Taxation est. · year 1
- Rental income
- $15,702
- − Mortgage interest
- −$7,282
- − Property taxes
- −$3,157
- − Insurance
- −$650
- − Repairs & maintenance
- −$1,256
- − Management
- −$1,256
- − Depreciation
- −$3,782
- Taxable loss
- −$1,681
- Est. tax savings @ 24.0%
- +$403
- After-tax cash flow
- $821/yr
For passive investors: Depreciation is non-cash, so a rental often shows a tax loss while cash-flowing — sheltering income. Rental losses are passive: they offset passive income freely, and up to $25,000/yr can offset ordinary (W-2) income if you actively participate and your MAGI is under $100k (phasing out to $0 by $150k); unused losses carry forward. On sale, claimed depreciation is recaptured at up to 25%, and gains may owe capital-gains tax (a 1031 exchange can defer both). Figures are a year-1 estimate at your 24.0% rate — not tax advice; consult a CPA.
Schools (NCES district)
- District
- Belleville Twp Hsd 201
- NCES district ID
- 1705640
- Math proficiency
- 21% ▼ -8.00%
- Reading proficiency
- 28% ▼ -3.00%
- Median HH income
- $58,064
- Composite
- 22.39/100
- National rank
- #8115
- State rank
- #308 of 620 in IL
Livability — Belleville
- Score
- 78/100
- State rank
- #142
- US rank
- #2604
Category grades
Schools grade is shown separately in the Schools card above.
Census & demographics
- County
- Saint Clair County · 169,691 people
- City population
- 47,407
- Metro
- St. Louis, MO-IL
- Population (ZIP)
- 16,269
- Household income
- $73,700
- Rent vs Own
- Severe rent burden
- 656.0
Population outlook (St. Clair County) Hauer SSP2
- Today (2025)
- 250,366 people
- By 2030
- 240,511 · -3.9%
- By 2040
- 217,391 · -13.2%
- By 2050
- 192,699 · -23.0%
- By 2075
- 140,637 · -43.8%
- By 2100
- 100,499 · -59.9%
Race, ethnicity, and origin ACS 2023
- Neighborhood character
- Majority White (62%)
- Race & ethnicity
- White 62% Black 27% Two or more races 9% Hispanic / Latino 4%
- Common ancestry
- Romanian 3% Lithuanian 3% Slovak 2%
- Foreign-born
- 2% · Canada, Guatemala
- Languages at home
- 96% English-only · Spanish 2%
Political lean MEDSL · St. Clair
- 2024 margin
- Lean D (+7.9) · D 53.0% · R 45.1% · Other 1.8%
- 2008→2024 swing
- -14.6pp toward R · 2008: 22.4pp · 2024: 7.9pp
- All cycles
- 2024: D+7.9 2020: D+8.7 2016: D+5.6 2012: D+14.5 2008: D+22.4
Not yet ingested
- Civics
- —
Market trends
- HPI YoY
- ▲ 9.50%
- Current HPI
- 259.15
- Rent YoY
- —
- Metro
- St. Louis, MO-IL
- State GDP YoY
- ▲ 1.59%
- F500 in state
- 60
Industry mix (Fortune 500 HQ in IL)
| Industry | F500 HQs | Revenue |
|---|---|---|
| Insurance | 4 | $201B |
|
||
| Consumer Goods | 4 | $87B |
|
||
| Industrial Machinery | 3 | $64B |
|
||
| Healthcare | 2 | $55B |
|
||
| Retail / Pharmacy | 1 | $148B |
|
||
| Agriculture / Food | 1 | $86B |
|
||
Price history
+116.7% since first listed7 events — show timeline
- 2026-04-15 Price Changed $130,000 MRED as Distributed by MLS Grid
- 2026-04-14 Listed $130,000 MARIS as Distributed by MLS Grid
- 2026-03-22 Listed $135,000 MRED as Distributed by MLS Grid
- 1992-04-20 Sold (Public Records) $61,000 Public Records
- 1992-04-20 Sold (Public Records) $61,000 Public Records
- 1991-03-18 Sold (Public Records) $60,000 Public Records
- 1991-03-18 Sold (Public Records) $60,000 Public Records
Property tax history
+3.6%/yrLatest (2024): $3,157 · +7.1% YoY. Source: county tax records.
Cash-flow waterfall
monthlySold comps — $/sqft
last 12 mo · ≤1 miLoading sold comps…