 Triplex
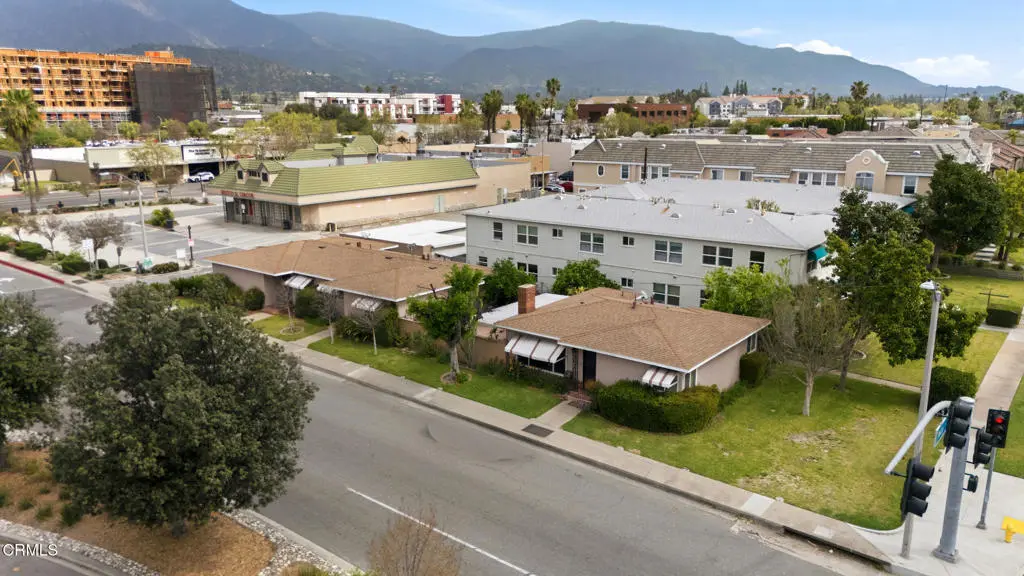
16-20 S Santa Anita Ave · Arcadia, CA
Flood risk 4/10 · Minor
- FEMA flood zone
- X (unshaded)
- Chance of flooding over 30 yrs
- 0.26%
- Est. flood insurance / yr
- $507 – $1,088
Fire risk 4/10 · Minor
- Est. fire insurance / yr
- $659 – $1,223
Heat risk 7/10 · Major
- Hot days now (above 99°F)
- 7 days/yr
- Hot days in 30 yrs
- 19 days/yr
Wind risk 1/10 · Minimal
- Chance of severe wind over 30 yrs
- —
Air-quality risk 7/10 · Major
- Unhealthy air days now
- 12 days/yr
- Unhealthy air days in 30 yrs
- 14 days/yr
Risk factors via First Street. Map © Google.
Why this score? — see what drove the C grade
The composite is a weighted blend of 9 inputs, each scored 0–100. Each bar is that input's sub-score; the figure is the points it added to the 100-point composite (weight × sub-score).
- Cash flow +26.1/30.0
- DSCR +8.8/10.0
- Schools +6.1/10.0
- 1% rule +5.8/10.0
- Livability +3.9/5.0
- ARV discount +3.3/15.0
- Condition / age +2.5/5.0
- Rent growth +2.4/5.0
- Appreciation +0.0/10.0
$1,280,000
🖨 Deal sheet 📄 Offer letter ✓ Due diligence
Multi-family units
County records classify this as Multi-Family (2-4 Unit). Listing-text estimate: 3 units. confirmed
Listing remarks MLS
Excellent opportunity for investors, owner-users seeking supplemental income, or those looking for a multi-generational living setup. Offered for the first time since 1986, this well-located triplex sits directly across from the Santa Anita Golf Course and Arcadia County Park, with access to tennis courts, pickleball, lawn bowling, and more. Just a couple of blocks away are popular local favorites including Claro's Italian Market, All India Cafe, Tori Tori Shabu & Sushi, Tekosu Cafe, Villa Catrina, and Maki & Sushi. The property also enjoys close proximity to Westfield Santa Anita, the Santa Anita Racetrack, the Arboretum, biking and hiking trails, and convenient access to the 210, 10, and 605 freeways. Local hiking trails in the neighborhood include Mount Wilson Trail, Bailey Canyon and Sturtevant Falls, just to name a few! Unit 16 offers 1 bedroom, 1 bathroom, and laundry hookups in the kitchen (approx. 600 sq ft). Unit 18 includes 1 bedroom, 1 bathroom (approx. 600 sq ft), and features sliding doors from the living room to a large private patio with a lemon tree. Unit 20 features 2 bedrooms, 1 bathroom (approx. 800 sq ft), a fireplace, updated kitchen with dining area, separate laundry room, and sliding doors opening to a spacious and private covered patio. Appliances in all units are tenant-owned. Each unit is separately metered for gas and electricity. The property includes four single-car garages. All units have wall heaters and window air conditioning. Tenants are long-term and currently on month-to-month agreements. The property offers a shared fenced backyard with two lemon trees and one orange tree, plus a front yard with automatic sprinklers. The Trustee believes a new roof layer was installed in 2025. Please do not disturb tenants. A rare opportunity with strong potential.
Key facts
- Access to pickleball
- Two lemon trees
- 7,859 sq ft lot
Tags
Neighborhood map
What this means for you Summary
Snapshot
- This is a 3 × 4-bed/3.0-bath units multifamily listed at $1.28M.
Deal economics
- At list price, monthly cash flow is $3k ($39k/yr) — positive. Per door: $1k/mo.
- The deal already cash-flows at list — no discount required.
- Meets the 1% rule at list price ($14k rent vs $1.28M).
- Recommended offer: $1.16M (9.0% below list) — sets the bar for market timing.
- Cap rate 9.3% vs local median 0.9% in Arcadia — top-decile yield for the area; either an underpriced asset or a hidden risk that comps aren't pricing in. Stress-test before assuming the spread holds.
Location & tenants
- Location reads 77/100 on livability (#84 in CA, #3,116 nationally) — a middle-class / working-renter tenant base. Strengths: schools A+, amenities A+, commute A+; Watch: health & safety D+, cost of living F.
- Arcadia Unified (urban): math 67% / reading 69% proficiency, ranked #53 of 517 in CA (top 10%) — acceptable for families but not a draw, mixed tenant base, ~2y average lease; only 14% free/reduced lunch — higher-income household profile.
- Market conditions: Rents soft (-0.2%/yr); 120 active listings in the ZIP; 25 comparable units currently listed for rent nearby; rentals at typical pace (median 19d on market — plan ~3-4 weeks tenant-placement turnaround); high-income renter base; 19,697 units permitted in Los Angeles County in 2024 (9,426 in 5+ unit buildings).
- At $13,796/mo this rent would consume 134% of the median local household income ($124k/yr) (locally 888% of renters already pay >50% of income on rent) — very limited rent-growth headroom before tenants either downsize or default.
Forward outlook
- Local home prices are declining (-3.0%/yr); year-one equity from $9k of loan paydown is wiped out by about $38k of value loss. Plan a longer hold.
- Los Angeles County population projected at +9% by 2050 — modest demand growth; plan on rents tracking national, not racing it.
Negotiation context
- It's been on market 91 days — a 9% lower offer ($1.16M) is reasonable based on typical stale-listing flexibility.
- Current owner paid $180k; list at $1.28M implies a 611% gain — meaningful room to come down on a strong offer.
Risks & watch-outs
- Watch-outs: built in 1958 — expect roof / HVAC / electrical / plumbing capex.
- Climate carrying-cost: extreme-heat days projected 7→19/yr by 2055 (HVAC capex compounding) — expect insurance premiums to compound above CPI over the hold.
Questions for the listing agent
- It's been on market 91 days. Have you received any prior offers? Is the seller open to a 9% concession, seller financing, or rate buy-down credit?
- Can we see the unit-by-unit rent roll, current vacancy, and any below-market leases? What's the average tenancy length?
- What capital expenditures (roof, boiler, parking lot, exteriors) have been made in the last 5 years, and what's planned in the next 2?
- Built in 1958 — when were the roof, HVAC, electrical panel, plumbing, and water heater last replaced?
- Why hasn't it sold? Are there any deal-killer items the seller is aware of (foundation, flood, title, zoning, code violations)?
- Is there a deadline driving the sale (1031 exchange, divorce, estate, relocation)? That informs how much negotiation room exists.
- Schools are A-rated — typically a magnet for longer-tenancy family renters. What's the average tenant stay here, and is there a school-zone premium baked into asking?
- What's the average days-on-market for RENTAL listings here right now (not sales)? A rising rental-DOM trend means longer vacancies and softer asking-rent achievability than the comps imply.
- What's the recent tenant-quality profile in this submarket — average credit score on applications, eviction rate, late-payment / NSF rate, and stable-employment percentage? A property-management company in the area should have these aggregated.
- How much new apartment / multifamily construction is in the pipeline within 1–3 miles? Heavy new supply (>2% of stock underway) typically softens rents 12–24 months out; light construction supports rent growth.
Investment metrics
- 1% rule
- 1.08% ✓
- Cap rate
- 9.33%
- Cash-on-cash
- 10.84%
- DSCR
- 1.48
- GRM
- 7.7
CMA / ARV
- ARV (median comp)
- $1,169,710
- List price
- $1,280,000
- Delta
- 9.43%
- Verdict
- FAIR
- Comps
- 15 within 1.0 mi
Projected returns pro-forma
-3.0% appreciation · 0.0% rent growth · sell at horizon
- IRR
- -3.2%
- Equity multiple
- 0.88×
- Total profit
- $-42,202
- Equity at exit
- $190,852
- IRR
- 3.1%
- Equity multiple
- 1.20×
- Total profit
- $70,359
- Equity at exit
- $110,671
Cash invested: $358,400 (down + closing). Projections, not guarantees.
Landlord ↔ Tenant lean methodology
- Overall (STATE)
- 18 Strongly Tenant-Friendly
- State California
- 18 Strongly Tenant-Friendly · D+13
- County
- — inherits STATE
- City
- — inherits STATE
ZIP-level market 91006
- Rents YoY
- -0.2%
- Active inventory
- 120
- Price-to-rent
- 23.2×
Monthly cashflow live
- Estimated rent
- $13,796 medium interval (Pro) →
- Mortgage (P&I)
- −$6,712
- Tax from tax record
- −$416 /mo · $4,993/yr
- Insurance
- −$533
- HOA
- −$0
- Vacancy / Maint / Mgmt
- −$2,897
- Net cashflow
- $3,237
Break-even live
3-unit breakdown (identical units grouped — click to expand)
| Units | Beds | Baths | Est. rent |
|---|---|---|---|
| 3× units | 4 | 3 | $13,797 |
| #1 | 4 | 3 | $4,599 |
| #2 | 4 | 3 | $4,599 |
| #3 | 4 | 3 | $4,599 |
| Total (3 units) | $13,796 | ||
UW: 25.0% down · 7.5% · 30yr · 1.5% tax · 5.0% vac · 8.0% maint · 8.0% mgmt
Financing live
Cash to close
- Down payment
- $320,000
- Closing costs
- $38,400
- Reserves months
- —
- Total cash needed
- —
Loan-product check · same deal, 3 products live
Conventional
25% down · 7.5% · 30yr
- Down + closing
- —
- Monthly P&I
- —
- Monthly cashflow
- —
- DSCR
- —
- Eligible?
- —
Personal DTI + credit; lowest rate.
DSCR
20% down · 8.5% · 30yr
- Down + closing
- —
- Monthly P&I
- —
- Monthly cashflow
- —
- DSCR
- —
- Eligible?
- —
No personal income docs; deal must DSCR.
Hard money
10% down · 12.0% · 12mo
- Down + closing
- —
- Monthly P&I
- —
- Monthly cashflow
- —
- DSCR
- —
- Eligible?
- —
Short-term bridge; refi at stabilization.
Rent comps 25 comps
| Address | Beds | Baths | Sqft | Rent | $/sqft | DOM | Units | Dist |
|---|---|---|---|---|---|---|---|---|
| 162 California St Arcadia, CA | 3.0 | 2.5 | 1589 | $3,700 | $2.33 | 19d | 1 | 0.35mi |
| 203 S 3rd Ave Unit B Arcadia, CA | 3.0 | 2.5 | 2350 | $4,200 | $1.79 | 18d | 1 | 0.41mi |
| 110 Santa Ynez Dr Arcadia, CA | 4.0 | 2.0 | 1855 | $5,900 | $3.18 | 44d | 1 | 0.45mi |
| 503 N Santa Anita Ave Arcadia, CA | 3.0 | 3.0 | 1960 | $4,500 | $2.30 | 25d | 1 | 0.46mi |
| 505 N Santa Anita Ave Unit A Arcadia, CA | 3.0 | 3.0 | 1890 | $4,850 | $2.57 | 25d | 1 | 0.48mi |
| 511 N Santa Anita Ave Arcadia, CA | 3.0 | 3.0 | 1690 | $4,400 | $2.60 | 10d | 1 | 0.48mi |
| 137 Genoa St Unit A Arcadia, CA | 3.0 | 2.5 | 2292 | $4,950 | $2.16 | 15d | 1 | 0.51mi |
| 605 S 2nd Ave Arcadia, CA | 3.0 | 2.5 | 1400 | $3,200 | $2.29 | 25d | 1 | 0.51mi |
| 612 S 2nd Ave Arcadia, CA | 4.0 | 4.0 | 2012 | $4,500 | $2.24 | 44d | 1 | 0.54mi |
| 422 California St Unit F Arcadia, CA | 3.0 | 2.5 | 2002 | $4,000 | $2.00 | 1d | 1 | 0.59mi |
| 901 S 1st Ave Arcadia, CA | 3.0 | 2.0 | 2303 | $4,000 | $1.74 | 44d | 1 | 0.61mi |
| 519 Santa Maria Rd Arcadia, CA | 4.0 | 2.0 | 1775 | $4,500 | $2.54 | 2d | 1 | 0.72mi |
| 407 E Duarte Rd Unit C Arcadia, CA | 4.0 | 3.0 | 1968 | $4,600 | $2.34 | 1d | 1 | 0.75mi |
| 1516 Encino Ave Unit B Monrovia, CA | 3.0 | 2.5 | 1662 | $3,775 | $2.27 | 25d | 1 | 0.84mi |
| 118 W Magna Vista Ave Arcadia, CA | 3.0 | 2.0 | 1779 | $4,000 | $2.25 | 21d | 1 | 0.87mi |
| 809 W Duarte Rd Unit C Monrovia, CA | 4.0 | 2.5 | 1871 | $3,900 | $2.08 | 3d | 1 | 0.97mi |
| 18 Woodland Ln Arcadia, CA | 3.0 | 2.0 | 2418 | $6,600 | $2.73 | 1d | 1 | 1.01mi |
| 1228 S 5th Ave Arcadia, CA | 3.0 | 3.0 | 2007 | $4,380 | $2.18 | 13d | 1 | 1.09mi |
| 103 W Santa Anita Ter Arcadia, CA | 3.0 | 3.0 | 2261 | $4,500 | $1.99 | 19d | 1 | 1.14mi |
| 601 Camino Grove Ave Arcadia, CA | 4.0 | 3.5 | 1496 | $3,980 | $2.66 | 2d | 1 | 1.17mi |
| 61 E Orange Grove Ave Arcadia, CA | 3.0 | 2.5 | 2411 | $6,250 | $2.59 | 1d | 1 | 1.25mi |
| 523 Fairview Ave Arcadia, CA | 3.0 | 3.0 | 1842 | $3,600 | $1.95 | 44d | 1 | 1.31mi |
| 609 Fairview Ave #2 Arcadia, CA | 3.0 | 3.5 | 2249 | $3,700 | $1.65 | 44d | 1 | 1.37mi |
| 1351 S Magnolia Ave Monrovia, CA | 4.0 | 2.5 | 1658 | $4,300 | $2.59 | 44d | 1 | 1.45mi |
| 1625 S Magnolia Ave Monrovia, CA | 1.0–3.0 | 1.0–2.0 | 1094 | $5,480 | $5.01 | 1d | 48 | 1.49mi |
Listing history 17 events
-
2026-06-18days on market $1,280,000 Active 91 DOM
-
2026-06-17days on market $1,280,000 Active 90 DOM
-
2026-06-16days on market $1,280,000 Active 89 DOM
-
2026-06-15days on market $1,280,000 Active 88 DOM
-
2026-06-13days on market $1,280,000 Active 86 DOM
-
2026-06-13days on market $1,280,000 Active 85 DOM
-
2026-06-09days on market $1,280,000 Active 82 DOM
-
2026-06-08days on market $1,280,000 Active 81 DOM
-
2026-06-07days on market $1,280,000 Active 80 DOM
-
2026-06-04days on market $1,280,000 Active 77 DOM
-
2026-06-03days on market $1,280,000 Active 76 DOM
-
2026-06-02days on market $1,280,000 Active 75 DOM
-
2026-06-02price $1,280,000 Active 74 DOM
-
2026-06-01days on market $1,328,000 Active 74 DOM
-
2026-05-31days on market $1,328,000 Active 73 DOM
-
2026-03-20$1,328,000 Active 1827-char remark
Show marketing remark (1827 chars)
Excellent opportunity for investors, owner-users seeking supplemental income, or those looking for a multi-generational living setup. Offered for the first time since 1986, this well-located triplex sits directly across from the Santa Anita Golf Course and Arcadia County Park, with access to tennis courts, pickleball, lawn bowling, and more. Just a couple of blocks away are popular local favorites including Claro's Italian Market, All India Cafe, Tori Tori Shabu & Sushi, Tekosu Cafe, Villa Catrina, and Maki & Sushi. The property also enjoys close proximity to Westfield Santa Anita, the Santa Anita Racetrack, the Arboretum, biking and hiking trails, and convenient access to the 210, 10, and 605 freeways. Local hiking trails in the neighborhood include Mount Wilson Trail, Bailey Canyon and Sturtevant Falls, just to name a few! Unit 16 offers 1 bedroom, 1 bathroom, and laundry hookups in the kitchen (approx. 600 sq ft). Unit 18 includes 1 bedroom, 1 bathroom (approx. 600 sq ft), and features sliding doors from the living room to a large private patio with a lemon tree. Unit 20 features 2 bedrooms, 1 bathroom (approx. 800 sq ft), a fireplace, updated kitchen with dining area, separate laundry room, and sliding doors opening to a spacious and private covered patio. Appliances in all units are tenant-owned. Each unit is separately metered for gas and electricity. The property includes four single-car garages. All units have wall heaters and window air conditioning. Tenants are long-term and currently on month-to-month agreements. The property offers a shared fenced backyard with two lemon trees and one orange tree, plus a front yard with automatic sprinklers. The Trustee believes a new roof layer was installed in 2025. Please do not disturb tenants. A rare opportunity with strong potential.
-
1986-12-31soldstatus $180,000
ⓘ Source: listings_history table (triggers on properties + properties_extension) + one-shot
backfill from property_details.listing_events for pre-trigger history.
Tax reassessment forecast CA · Resets to sale price
- Current annual tax
- $4,993 · $416/mo
- Projected year-2 tax
- $9,728 · $811/mo
- Expected delta
- +$4,735/yr (+$395/mo · 94.8%)
ⓘ Screening estimate from a state-policy table — verify with the county assessor before closing.
Climate risk First Street
- Flood 4/10 Moderate FEMA zone X (unshaded) · 26% chance over 30 yrs
- Wildfire 4/10 Moderate
- Heat 7/10 Severe 7 d/yr ≥99°F today · 19 d/yr by 30 yrs out
- Wind 1/10 Low
- Air quality 7/10 Severe 12 unhealthy d/yr today · 14 by 30 yrs out
Nearby sold comps map
Loading sold comps map…
Walkable amenities ~0.75 mi
Loading nearby amenities…
Taxation est. · year 1
- Rental income
- $165,552
- − Mortgage interest
- −$71,700
- − Property taxes
- −$4,993
- − Insurance
- −$6,400
- − Repairs & maintenance
- −$13,244
- − Management
- −$13,244
- − Depreciation
- −$37,236
- Taxable income
- $18,734
- Est. tax owed @ 24.0%
- −$4,496
- After-tax cash flow
- $34,347/yr
For passive investors: Depreciation is non-cash, so a rental often shows a tax loss while cash-flowing — sheltering income. Rental losses are passive: they offset passive income freely, and up to $25,000/yr can offset ordinary (W-2) income if you actively participate and your MAGI is under $100k (phasing out to $0 by $150k); unused losses carry forward. On sale, claimed depreciation is recaptured at up to 25%, and gains may owe capital-gains tax (a 1031 exchange can defer both). Figures are a year-1 estimate at your 24.0% rate — not tax advice; consult a CPA.
Schools (NCES district)
- District
- Arcadia Unified
- NCES district ID
- 0602970
- Math proficiency
- 67% ▼ -8.00%
- Reading proficiency
- 69% ▼ -8.00%
- Median HH income
- $82,234
- Composite
- 60.79/100
- National rank
- #821
- State rank
- #53 of 517 in CA
Livability — Arcadia
- Score
- 77/100
- State rank
- #84
- US rank
- #3116
Category grades
Schools grade is shown separately in the Schools card above.
Census & demographics
- Census place
- Arcadia, CA
- County
- Los Angeles County · 9,444,647 people
- City population
- 64,611
- Metro
- Los Angeles-Long Beach-Anaheim, CA
- Population (ZIP)
- 31,582
- Household income
- $123,533
- Rent vs Own
- Severe rent burden
- 888.0
Population outlook (Los Angeles County) Hauer SSP2
- Today (2025)
- 10,940,515 people
- By 2030
- 11,256,481 · +2.9%
- By 2040
- 11,729,929 · +7.2%
- By 2050
- 11,948,407 · +9.2%
- By 2075
- 11,818,114 · +8.0%
- By 2100
- 10,842,928 · -0.9%
Race, ethnicity, and origin ACS 2023
- Neighborhood character
- Diverse neighborhood (Simpson 0.61)
- Race & ethnicity
- Asian 56% Hispanic / Latino 20% White 18% Two or more races 11%
- Hispanic origin (detail)
- Mexican 14%
- Common ancestry
- Romanian 1% Lithuanian 1% Scotch-Irish 1%
- Foreign-born
- 44% · China, Canada, Vietnam
- Languages at home
- 40% English-only · Chinese 35% Spanish 12% Other Indo-European 4%
Political lean MEDSL · Los Angeles
- 2024 margin
- Solid D (+32.9) · D 64.8% · R 31.9% · Other 3.3%
- 2008→2024 swing
- -7.4pp toward R · 2008: 40.4pp · 2024: 32.9pp
- All cycles
- 2024: D+32.9 2020: D+44.2 2016: D+48.0 2012: D+40.0 2008: D+40.4
Not yet ingested
- Civics
- —
Market trends
- HPI YoY
- ▼ -1197.04%
- Current HPI
- 365.9347
- Rent YoY
- ▼ -0.23%
- Metro
- Los Angeles-Long Beach-Anaheim, CA
- State GDP YoY
- ▲ 3.21%
- F500 in state
- 116
Industry mix (Fortune 500 HQ in CA)
| Industry | F500 HQs | Revenue |
|---|---|---|
| Technology | 27 | $1,492B |
|
||
| Financial Services | 3 | $174B |
|
||
| Retail | 3 | $44B |
|
||
| Insurance | 3 | $26B |
|
||
| Media / Entertainment | 2 | $115B |
|
||
| Pharmaceuticals / Biotech | 2 | $62B |
|
||
Price history
+637.8% since first listed2 events — show timeline
- 2026-03-20 Listed $1,328,000 CRMLS
- 1986-12-31 Sold (Public Records) $180,000 Public Records
Property tax history
+2.4%/yrLatest (2025): $4,993 · +6.0% YoY. Source: county tax records.
Cash-flow waterfall
monthlySold comps — $/sqft
last 12 mo · ≤1 miLoading sold comps…