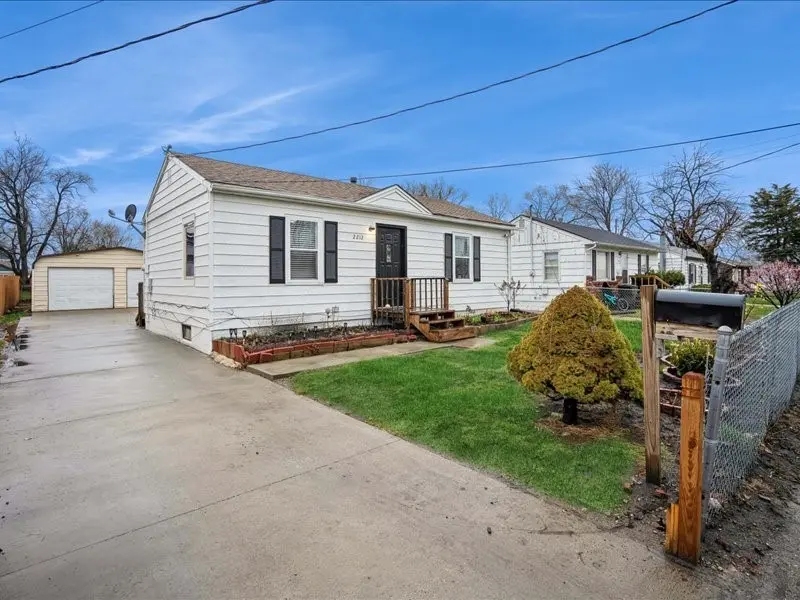
2212 Tichenor St · Des Moines, IA
Flood risk 1/10 · Minimal
- FEMA flood zone
- X (unshaded)
- Chance of flooding over 30 yrs
- 0.0%
- Est. flood insurance / yr
- $473 – $860
Fire risk 1/10 · Minimal
- Est. fire insurance / yr
- $902 – $1,676
Heat risk 3/10 · Minor
- Hot days now (above 103°F)
- 7 days/yr
- Hot days in 30 yrs
- 15 days/yr
Wind risk 2/10 · Minimal
- Chance of severe wind over 30 yrs
- —
Air-quality risk 2/10 · Minimal
- Unhealthy air days now
- 1 days/yr
- Unhealthy air days in 30 yrs
- 2 days/yr
Risk factors via First Street. Map © Google.
Why this score? — see what drove the F grade
The composite is a weighted blend of 9 inputs, each scored 0–100. Each bar is that input's sub-score; the figure is the points it added to the 100-point composite (weight × sub-score).
- Cash flow +4.3/30.0
- ARV discount +4.0/15.0
- Livability +4.0/5.0
- Schools +3.8/10.0
- Rent growth +3.1/5.0
- Condition / age +2.5/5.0
- 1% rule +0.2/10.0
- DSCR +0.0/10.0
- Appreciation +0.0/10.0
$169,000
🖨 Deal sheet (PDF) 📄 Offer letter ✓ Due diligence
Listing remarks
Welcome to this 4 bedroom, two-bath ranch-style home. The functional layout features a cozy living room, dinning area and two bedrooms on the main level, and an inviting/spacious kitchen. This home also offers new laminate floors and newer blinds throughout. Downstairs you will find two large and comfortable bedrooms and a bathroom, offering extra living space and flexibility. Step outside to enjoy the large deck that provides the perfect space for relaxation, the back yard is ideal for grilling and gardening, along with a large two-car garage. This home is conveniently located near parks, schools and shopping centers. Don't wait any longer and make this house yours! Call your favorite a
Key facts
- 6,050 sq ft lot
- 2 garage spots
- Built 1953
Neighborhood map
What this means for you Summary
Snapshot
- This is a 2-bed/1.0-bath single-family listed at $169k.
Deal economics
- At list price, monthly cash flow is $-448 ($-5k/yr) — negative.
- To cash-flow at today's rent, offer at most $90k (46.9% below list).
- To meet the 1% rule (rent ≥ 1% of price), the offer needs to be $87k (48.3% below list).
- Recommended offer: $87k (48.3% below list) — sets the bar for 1% rule.
Location & tenants
- Location reads 81/100 on livability (#63 in IA, #1,432 nationally) — a professional / high-income tenant draw. Strengths: commute A+, cost of living A+, housing A+; Watch: employment C-, crime F.
- Des Moines Independent Community School District (urban): math 43% / reading 46% proficiency, ranked #289 of 289 in IA (top 100%) — families likely to look elsewhere, expect single-tenant / working-renter base with shorter leases; 63% free/reduced lunch — lower-income household profile, screen leases tightly.
- Zoned schools: Garton Elementary (math 47% / reading 31%, grade F, #586 of 616 statewide, top 95%, 455 students, 88% FRL); Harding Middle School (math 31% / reading 30%, grade F, #245 of 246 statewide, top 100%, 655 students, 90% FRL); North High School (math 33% / reading 45%, grade F, #326 of 336 statewide, top 97%, 1,458 students, 87% FRL) — zoned schools average 88% FRL vs 63% district-wide (25 pts higher); higher-poverty schools than district average — tighter screening recommended.
- Market conditions: Rents rising (+2.3%/yr); 362 active listings in the ZIP; 5 comparable units currently listed for rent nearby; rentals at typical pace (median 23d on market — plan ~3-4 weeks tenant-placement turnaround); 40% of comp listings sitting > 30 days — soft ceiling on asking rent; 2,953 units permitted in Polk County in 2024 (540 in 5+ unit buildings).
- This rent is only 16% of the median local income ($66k/yr) — well below the 30% rent-burden line; pricing power to push rent on renewal without tenant pushback.
Forward outlook
- Local home prices are declining (-3.0%/yr); year-one equity from $1k of loan paydown is wiped out by about $5k of value loss. Plan a longer hold.
- Polk County population projected at +37% by 2050 — long-run rental-demand tailwind backs the buy-and-hold thesis.
Negotiation context
- Only 9 days on market — expect competitive offers; lowballing is unlikely to land.
Risks & watch-outs
- Watch-outs: built in 1953 — expect roof / HVAC / electrical / plumbing capex.
Questions for the listing agent
- What do current leases actually rent for vs. the listed asking? Can we see a recent rent roll and the last 12 months of T-12 income?
- Built in 1953 — when were the roof, HVAC, electrical panel, plumbing, and water heater last replaced?
- Is there a deadline driving the sale (1031 exchange, divorce, estate, relocation)? That informs how much negotiation room exists.
- Schools are D-rated, which usually means shorter tenancies and higher turnover. Who's the typical renter profile here, and what's been the actual vacancy rate?
- Crime grade is F in this area — have there been break-ins, vandalism, or insurance claims at this property in the last 3 years? What carrier currently insures it and at what premium?
- The area grade is low — what's the realistic commute time and amenity access for the typical tenant pool here? Any planned neighborhood developments (good or bad) we should know about?
- What's the average days-on-market for RENTAL listings here right now (not sales)? A rising rental-DOM trend means longer vacancies and softer asking-rent achievability than the comps imply.
- What's the recent tenant-quality profile in this submarket — average credit score on applications, eviction rate, late-payment / NSF rate, and stable-employment percentage? A property-management company in the area should have these aggregated.
- How much new for-sale + rental construction is in the pipeline within 1–3 miles? Heavy new supply typically softens prices + rents 12–24 months out; constrained supply supports both.
Investment metrics
- 1% rule
- 0.52% ✗
- Cap rate
- 3.11%
- Cash-on-cash
- -11.37%
- DSCR
- 0.49
- GRM
- 16.1
CMA / ARV
- ARV (on-the-fly)
- $156,800
- Comps found
- 12
Show comp detail 12 sales within ~0.75 mi
| Address | Dist | Beds/Ba | Sqft | Sold | Price | $/sf | Match |
|---|---|---|---|---|---|---|---|
| 2113 E 21st St | 0.08mi | 2/2.0 | 640 (0%) | 3mo | $129,400 | $202 | 89 |
| 2105 E 23rd St | 0.25mi | 2/1.0 | 672 (+5%) | 8mo | $170,000 | $253 | 74 |
| 2021 E 25th St | 0.44mi | 2/1.0 | 635 (-1%) | 6mo | $124,900 | $197 | 73 |
| 2216 Lay St | 0.34mi | 2/1.0 | 675 (+6%) | 8mo | $170,000 | $252 | 69 |
| 2204 Lay St | 0.34mi | 2/1.0 | 690 (+8%) | 4mo | $189,900 | $275 | 68 |
| 1603 E 22nd St | 0.46mi | 3/1.0 (+1) | 672 (+5%) | 1mo | $174,000 | $259 | 65 |
| 1517 Delaware Ave | 0.51mi | 2/1.0 | 600 (-6%) | 3mo | $99,000 | $165 | 64 |
| 1349 De Wolf St | 0.74mi | 2/1.0 | 640 (0%) | 3mo | $70,000 | $109 | 63 |
| 2028 Searle St | 0.18mi | 2/1.0 | 728 (+14%) | 9mo | $175,000 | $240 | 62 |
| 1603 Searle St | 0.48mi | 2/1.0 | 698 (+9%) | 4mo | $82,500 | $118 | 59 |
| 2112 E 23rd St | 0.21mi | 3/2.0 (+1) | 720 (+12%) | 9mo | $215,000 | $299 | 53 |
| 1904 E 27th St | 0.74mi | 2/2.0 | 572 (-11%) | 1mo | $139,900 | $245 | 43 |
Match score weights: distance 35% · size 25% · config 20% · recency 20%. Top-matched comps best support the ARV.
Projected returns pro-forma
-3.0% appreciation · 2.29% rent growth · sell at horizon
- IRR
- -37.8%
- Equity multiple
- -0.20×
- Total profit
- $-56,559
- Equity at exit
- $25,198
- IRR
- -60.9%
- Equity multiple
- -0.87×
- Total profit
- $-88,540
- Equity at exit
- $14,612
Cash invested: $47,320 (down + closing). Projections, not guarantees.
Landlord ↔ Tenant lean methodology
- Overall (STATE)
- 83 Strongly Landlord-Friendly
- State Iowa
- 83 Strongly Landlord-Friendly · R+6
- County
- — inherits STATE
- City
- — inherits STATE
ZIP-level market 50317
- Rents YoY
- 2.3%
- Active inventory
- 362
- Price-to-rent
- 16.1×
Monthly cashflow live
- Estimated rent
- $874 high interval (Pro) →
- Mortgage (P&I)
- −$886
- Tax from tax record
- −$182 /mo · $2,182/yr
- Insurance
- −$70
- HOA
- −$0
- Vacancy / Maint / Mgmt
- −$183
- Net cashflow
- $-448
Break-even live
Sensitivity live
| Price | -10% $-353 | -5% $-400 | +0% $-448 | +5% $-496 | +10% $-544 |
|---|---|---|---|---|---|
| Rent | -10% $-517 | -5% $-483 | +0% $-448 | +5% $-414 | +10% $-379 |
| Rate | -1.0pp $-363 | -0.5pp $-405 | base $-448 | +0.5pp $-492 | +1.0pp $-537 |
UW: 25.0% down · 7.5% · 30yr · 1.5% tax · 5.0% vac · 8.0% maint · 8.0% mgmt
Financing live
Cash to close
- Down payment
- $42,250
- Closing costs
- $5,070
- Reserves months
- —
- Total cash needed
- —
Loan-product check · same deal, 3 products live
Conventional
25% down · 7.5% · 30yr
- Down + closing
- —
- Monthly P&I
- —
- Monthly cashflow
- —
- DSCR
- —
- Eligible?
- —
Personal DTI + credit; lowest rate.
DSCR
20% down · 8.5% · 30yr
- Down + closing
- —
- Monthly P&I
- —
- Monthly cashflow
- —
- DSCR
- —
- Eligible?
- —
No personal income docs; deal must DSCR.
Hard money
10% down · 12.0% · 12mo
- Down + closing
- —
- Monthly P&I
- —
- Monthly cashflow
- —
- DSCR
- —
- Eligible?
- —
Short-term bridge; refi at stabilization.
Rent comps 5 comps
| Address | Beds | Baths | Sqft | Rent | $/sqft | DOM | Units | Dist |
|---|---|---|---|---|---|---|---|---|
| 2555 Wedgewood Rd Des Moines, IA | 1.0 | 1.0 | 650 | $750 | $1.15 | 16d | 1 | 0.98mi |
| 3315 E 15th St Des Moines, IA | 1.0 | 1.0 | 610 | $785 | $1.29 | 23d | 2 | 1.23mi |
| 2342 E 13th St Unit C Des Moines, IA | 1.0 | 1.0 | 450 | $700 | $1.56 | 45d | 1 | 1.26mi |
| 2938 E Euclid Ave Unit 2 Des Moines, IA | 2.0 | 1.0 | 575 | $650 | $1.13 | 16d | 1 | 1.40mi |
| 2303 E 9th St Des Moines, IA | 1.0 | 1.0 | 500 | $675 | $1.35 | 45d | 1 | 1.42mi |
Listing history 2 events
-
2026-04-15status Pending
-
2026-04-06$169,000 Active
ⓘ Source: listings_history table (triggers on properties + properties_extension) + one-shot
backfill from property_details.listing_events for pre-trigger history.
Tax reassessment forecast IA · Partial reset (capped growth)
- Current annual tax
- $2,182 · $182/mo
- Projected year-2 tax
- $2,418 · $201/mo
- Expected delta
- +$236/yr (+$20/mo · 10.8%)
ⓘ Screening estimate from a state-policy table — verify with the county assessor before closing.
Climate risk First Street
- Flood 1/10 Low FEMA zone X (unshaded) · 0% chance over 30 yrs
- Wildfire 1/10 Low
- Heat 3/10 Moderate 7 d/yr ≥103°F today · 15 d/yr by 30 yrs out
- Wind 2/10 Low
- Air quality 2/10 Low 1 unhealthy d/yr today · 2 by 30 yrs out
Nearby sold comps map
Loading sold comps map…
Walkable amenities ~0.75 mi
Loading nearby amenities…
Taxation est. · year 1
- Rental income
- $10,485
- − Mortgage interest
- −$9,467
- − Property taxes
- −$2,182
- − Insurance
- −$845
- − Repairs & maintenance
- −$839
- − Management
- −$839
- − Depreciation
- −$4,916
- Taxable loss
- −$8,603
- Est. tax savings @ 24.0%
- +$2,065
- After-tax cash flow
- $-3,314/yr
For passive investors: Depreciation is non-cash, so a rental often shows a tax loss while cash-flowing — sheltering income. Rental losses are passive: they offset passive income freely, and up to $25,000/yr can offset ordinary (W-2) income if you actively participate and your MAGI is under $100k (phasing out to $0 by $150k); unused losses carry forward. On sale, claimed depreciation is recaptured at up to 25%, and gains may owe capital-gains tax (a 1031 exchange can defer both). Figures are a year-1 estimate at your 24.0% rate — not tax advice; consult a CPA.
Schools (NCES district)
- District
- Des Moines Independent Community School District
- NCES district ID
- 1908970
- Math proficiency
- 43% ▼ -6.00%
- Reading proficiency
- 46% ▼ -1.00%
- Median HH income
- $45,905
- Composite
- 37.83/100
- National rank
- #4331
- State rank
- #289 of 289 in IA
Livability — Des Moines
- Score
- 81/100
- State rank
- #63
- US rank
- #1432
Category grades
Schools grade is shown separately in the Schools card above.
Census & demographics
- Census place
- Des Moines, IA
- County
- Polk County · 453,298 people
- City population
- 203,612
- Metro
- Des Moines-West Des Moines, IA
- Population (ZIP)
- 36,548
- Household income
- $65,617
- Rent vs Own
- Severe rent burden
- 716.0
Population outlook (Polk County) Hauer SSP2
- Today (2025)
- 548,042 people
- By 2030
- 588,557 · +7.4%
- By 2040
- 670,629 · +22.4%
- By 2050
- 752,830 · +37.4%
- By 2075
- 955,069 · +74.3%
- By 2100
- 1,115,436 · +103.5%
Race, ethnicity, and origin ACS 2023
- Neighborhood character
- Majority White (65%)
- Race & ethnicity
- White 65% Hispanic / Latino 19% Two or more races 10% Black 10% Asian 3%
- Hispanic origin (detail)
- Mexican 15% Puerto Rican 1%
- Common ancestry
- Portuguese 3% Iranian 2% Swiss 1%
- Foreign-born
- 12% · Canada
- Languages at home
- 80% English-only · Spanish 13% Other Asian/Pacific 2%
Political lean MEDSL · Polk
- 2024 margin
- D (+10.9) · D 54.8% · R 43.9% · Other 1.3%
- 2008→2024 swing
- -3.7pp toward R · 2008: 14.6pp · 2024: 10.9pp
- All cycles
- 2024: D+10.9 2020: D+15.2 2016: D+11.5 2012: D+14.2 2008: D+14.6
Not yet ingested
- Civics
- —
Market trends
- HPI YoY
- ▼ -235.00%
- Current HPI
- 281.7409
- Rent YoY
- ▲ 2.29%
- Metro
- Des Moines-West Des Moines, IA
- State GDP YoY
- ▲ 2.48%
- F500 in state
- 4
Industry mix (Fortune 500 HQ in IA)
| Industry | F500 HQs | Revenue |
|---|---|---|
| Financial Services | 1 | $16B |
|
||
| Retail / Convenience | 1 | $15B |
|
||
Price history
2 events — show timeline
- 2026-04-15 Pending — DMMLS
- 2026-04-06 Listed $169,000 DMMLS
Property tax history
+1.7%/yrLatest (2025): $2,182 · +2.1% YoY. Source: county tax records.
Cash-flow waterfall
monthlySold comps — $/sqft
last 12 mo · ≤1 miLoading sold comps…