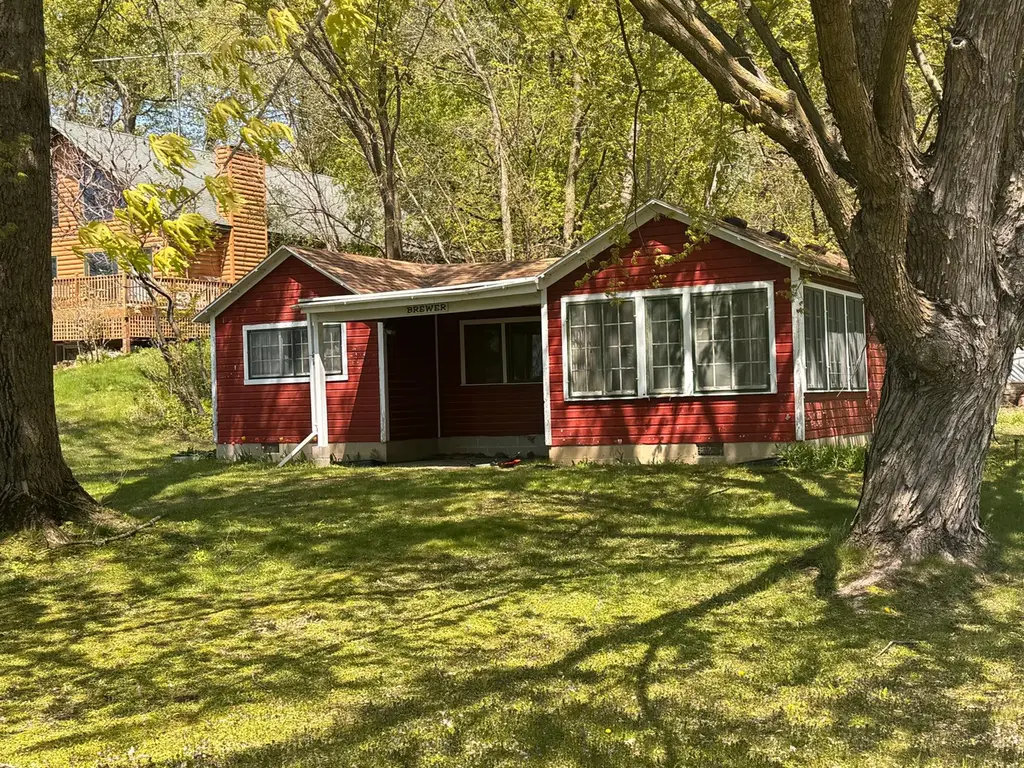
6205 French Lake Way · Faribault, MN
Flood risk 1/10 · Minimal
- FEMA flood zone
- X (unshaded)
- Chance of flooding over 30 yrs
- 0.0%
- Est. flood insurance / yr
- $507 – $1,088
Fire risk 2/10 · Minimal
- Est. fire insurance / yr
- $888 – $1,650
Heat risk 2/10 · Minimal
- Hot days now (above 100°F)
- 7 days/yr
- Hot days in 30 yrs
- 15 days/yr
Wind risk 2/10 · Minimal
- Chance of severe wind over 30 yrs
- —
Air-quality risk 2/10 · Minimal
- Unhealthy air days now
- 0 days/yr
- Unhealthy air days in 30 yrs
- 1 days/yr
Risk factors via First Street. Map © Google.
Why this score? — see what drove the C- grade
The composite is a weighted blend of 9 inputs, each scored 0–100. Each bar is that input's sub-score; the figure is the points it added to the 100-point composite (weight × sub-score).
- Cash flow +21.3/30.0
- ARV discount +7.5/15.0
- DSCR +6.8/10.0
- 1% rule +4.9/10.0
- Livability +3.8/5.0
- Rent growth +2.5/5.0
- Condition / age +2.5/5.0
- Schools +2.3/10.0
- Appreciation +0.0/10.0
$139,900
🖨 Deal sheet 📄 Offer letter ✓ Due diligence
Listing remarks
Lake living. Welcome to your cabin in the woods. Two bedroom cabin offer a ton of potential for lake life. Off the beaten path, but still close enough. Come enjoy this rustic cabin in the woods.
Key facts
- Lake living
- Rustic cabin
- Cabin in the woods
Tags
Property features AI
Finance
- Financial info: Property is free and clear
- HOA & community: Association maintained road
Exterior
- Parking: Gravel, open parking
- Utilities: Well water; Septic tank with drainage field; Propane fuel; Electric service with circuit breakers (Xcel Energy)
- Home design: Residential single-story home; Entry level: Main; Above-grade finished living area 1,140 (main level only)
- Construction: Block foundation; Foundation dimensions approximately 30x38; Roof replaced or installed within the last 8 years; Built with wood exterior
- Exterior features: Wood exterior; Accessible shoreline; Corner lot; Medium tree coverage
Interior
- Kitchen: Range; Refrigerator
- Bedrooms: Two bedrooms on the main level (9x11 each)
- Bathrooms: One half-bath on the main level
- Heating & cooling: Wood stove heating; No central air
- Interior features: All living facilities on one level; Breakfast bar
- Laundry & utility: No laundry room
Neighborhood map
What this means for you Summary
Snapshot
- This is a 2-bed/1.0-bath single-family listed at $140k.
Deal economics
- At list price, monthly cash flow is $205 ($2k/yr) — positive.
- The deal already cash-flows at list — no discount required.
- To meet the 1% rule (rent ≥ 1% of price), the offer needs to be $138k (1.5% below list).
- Recommended offer: $138k (1.5% below list) — sets the bar for market timing.
- Cap rate 8.1% vs local median 4.1% in Faribault — top-decile yield for the area; either an underpriced asset or a hidden risk that comps aren't pricing in. Stress-test before assuming the spread holds.
Location & tenants
- Location reads 76/100 on livability (#158 in MN, #3,440 nationally) — a middle-class / working-renter tenant base. Strengths: cost of living A+, housing A+, health & safety A+; Watch: schools C-, employment C-, commute F.
- Faribault Public School District (town): math 17% / reading 34% proficiency, ranked #275 of 301 in MN (top 91%) — low school quality limits family demand, transient renter base, plan for 1-2y turnover.
- Market conditions: 165 active listings in the ZIP; 93 units permitted in Rice County in 2024 (0 in 5+ unit buildings).
Forward outlook
- Local home prices are declining (-3.0%/yr); year-one equity from $967 of loan paydown is wiped out by about $4k of value loss. Plan a longer hold.
Negotiation context
- It's been on market 30 days — a 2% lower offer ($138k) is reasonable based on typical stale-listing flexibility.
- 2 sale attempts with the ask held roughly flat each time — persistent listings suggest the price (not the market) is what's stuck; bring a comps-based counter.
Risks & watch-outs
- Watch-outs: built in 1948 — expect roof / HVAC / electrical / plumbing capex.
Questions for the listing agent
- Built in 1948 — when were the roof, HVAC, electrical panel, plumbing, and water heater last replaced?
- Is there a deadline driving the sale (1031 exchange, divorce, estate, relocation)? That informs how much negotiation room exists.
- What's the average days-on-market for RENTAL listings here right now (not sales)? A rising rental-DOM trend means longer vacancies and softer asking-rent achievability than the comps imply.
- What's the recent tenant-quality profile in this submarket — average credit score on applications, eviction rate, late-payment / NSF rate, and stable-employment percentage? A property-management company in the area should have these aggregated.
- How much new for-sale + rental construction is in the pipeline within 1–3 miles? Heavy new supply typically softens prices + rents 12–24 months out; constrained supply supports both.
Investment metrics
- 1% rule
- 0.99% ✗
- Cap rate
- 8.05%
- Cash-on-cash
- 6.29%
- DSCR
- 1.28
- GRM
- 8.5
CMA / ARV
No comps found within radius.
Projected returns pro-forma
-3.0% appreciation · 3.0% rent growth · sell at horizon
- IRR
- -6.6%
- Equity multiple
- 0.75×
- Total profit
- $-9,632
- Equity at exit
- $20,860
- IRR
- 3.0%
- Equity multiple
- 1.21×
- Total profit
- $8,316
- Equity at exit
- $12,096
Cash invested: $39,172 (down + closing). Projections, not guarantees.
Landlord ↔ Tenant lean methodology
- Overall (STATE)
- 46 Balanced
- State Minnesota
- 46 Balanced · D+2
- County
- — inherits STATE
- City
- — inherits STATE
ZIP-level market 55021
- Home prices YoY
- -26.9%
- Active inventory
- 165
- Price-to-rent
- 8.5×
Monthly cashflow live
- Estimated rent
- $1,378 medium interval (Pro) →
- Mortgage (P&I)
- −$734
- Tax from tax record
- −$92 /mo · $1,102/yr
- Insurance
- −$58
- HOA
- −$0
- Vacancy / Maint / Mgmt
- −$289
- Net cashflow
- $205
Break-even live
UW: 25.0% down · 7.5% · 30yr · 1.5% tax · 5.0% vac · 8.0% maint · 8.0% mgmt
Financing live
Cash to close
- Down payment
- $34,975
- Closing costs
- $4,197
- Reserves months
- —
- Total cash needed
- —
Loan-product check · same deal, 3 products live
Conventional
25% down · 7.5% · 30yr
- Down + closing
- —
- Monthly P&I
- —
- Monthly cashflow
- —
- DSCR
- —
- Eligible?
- —
Personal DTI + credit; lowest rate.
DSCR
20% down · 8.5% · 30yr
- Down + closing
- —
- Monthly P&I
- —
- Monthly cashflow
- —
- DSCR
- —
- Eligible?
- —
No personal income docs; deal must DSCR.
Hard money
10% down · 12.0% · 12mo
- Down + closing
- —
- Monthly P&I
- —
- Monthly cashflow
- —
- DSCR
- —
- Eligible?
- —
Short-term bridge; refi at stabilization.
Listing history 7 events
-
2026-06-09status $139,900 Pending 30 DOM
-
2026-06-08days on market $139,900 Active 30 DOM
-
2026-06-07days on market $139,900 Active 29 DOM
-
2026-06-05status $139,900 Active 26 DOM
-
2026-05-30statusdays on market $139,900 Pending 26 DOM
-
2026-05-09historical Contingent - Inspection 194-char remark
-
2026-05-04$139,900 Active 194-char remark
ⓘ Source: listings_history table (triggers on properties + properties_extension) + one-shot
backfill from property_details.listing_events for pre-trigger history.
Tax reassessment forecast MN · Partial reset (capped growth)
- Current annual tax
- $1,102 · $92/mo
- Projected year-2 tax
- $1,334 · $111/mo
- Expected delta
- +$232/yr (+$19/mo · 21.1%)
ⓘ Screening estimate from a state-policy table — verify with the county assessor before closing.
Climate risk First Street
- Flood 1/10 Low FEMA zone X (unshaded) · 0% chance over 30 yrs
- Wildfire 2/10 Low
- Heat 2/10 Low 7 d/yr ≥100°F today · 15 d/yr by 30 yrs out
- Wind 2/10 Low
- Air quality 2/10 Low 0 unhealthy d/yr today · 1 by 30 yrs out
Nearby sold comps map
Loading sold comps map…
Walkable amenities ~0.75 mi
Loading nearby amenities…
Taxation est. · year 1
- Rental income
- $16,541
- − Mortgage interest
- −$7,837
- − Property taxes
- −$1,102
- − Insurance
- −$700
- − Repairs & maintenance
- −$1,323
- − Management
- −$1,323
- − Depreciation
- −$4,070
- Taxable income
- $187
- Est. tax owed @ 24.0%
- −$45
- After-tax cash flow
- $2,417/yr
For passive investors: Depreciation is non-cash, so a rental often shows a tax loss while cash-flowing — sheltering income. Rental losses are passive: they offset passive income freely, and up to $25,000/yr can offset ordinary (W-2) income if you actively participate and your MAGI is under $100k (phasing out to $0 by $150k); unused losses carry forward. On sale, claimed depreciation is recaptured at up to 25%, and gains may owe capital-gains tax (a 1031 exchange can defer both). Figures are a year-1 estimate at your 24.0% rate — not tax advice; consult a CPA.
Schools (NCES district)
- District
- Faribault Public School District
- NCES district ID
- 2711760
- Math proficiency
- 17% ▼ -18.00%
- Reading proficiency
- 34% ▼ -8.00%
- Median HH income
- $54,584
- Composite
- 22.85/100
- National rank
- #8011
- State rank
- #275 of 301 in MN
Livability — Faribault
- Score
- 76/100
- State rank
- #158
- US rank
- #3440
Category grades
Schools grade is shown separately in the Schools card above.
Census & demographics
- County
- Rice County · 56,558 people
- City population
- 30,908
- Metro
- Faribault-Northfield, MN
- Population (ZIP)
- 30,908
- Household income
- $68,820
- Rent vs Own
- Severe rent burden
- 755.0
Population outlook (Rice County) Hauer SSP2
- Today (2025)
- 66,716 people
- By 2030
- 67,352 · +1.0%
- By 2040
- 67,595 · +1.3%
- By 2050
- 67,074 · +0.5%
- By 2075
- 66,641 · -0.1%
- By 2100
- 66,205 · -0.8%
Race, ethnicity, and origin ACS 2023
- Neighborhood character
- Predominantly White (71%)
- Race & ethnicity
- White 71% Black 13% Hispanic / Latino 12% Two or more races 6% Asian 1%
- Hispanic origin (detail)
- Mexican 9%
- Common ancestry
- Portuguese 9% Lithuanian 3% Romanian 2%
- Foreign-born
- 11% · Canada
- Languages at home
- 82% English-only · Spanish 9% Other Asian/Pacific 1%
Political lean MEDSL · Rice
- 2024 margin
- Toss-up / Even · D 47.8% · R 50.3% · Other 1.8%
- 2008→2024 swing
- -14.0pp toward R · 2008: 11.5pp · 2024: -2.5pp
- All cycles
- 2024: R+2.5 2020: R+0.2 2016: R+3.1 2012: D+8.3 2008: D+11.5
Not yet ingested
- Civics
- —
Market trends
- HPI YoY
- ▼ -93.12%
- Current HPI
- 253.3996
- Rent YoY
- —
- Metro
- Faribault-Northfield, MN
- State GDP YoY
- ▲ 2.41%
- F500 in state
- 34
Industry mix (Fortune 500 HQ in MN)
| Industry | F500 HQs | Revenue |
|---|---|---|
| Healthcare | 2 | $407B |
|
||
| Retail | 2 | $150B |
|
||
| Consumer Goods | 2 | $32B |
|
||
| Industrial Machinery | 2 | $6B |
|
||
| Agriculture | 1 | $40B |
|
||
| Healthcare / Medical Devices | 1 | $32B |
|
||
Price history
5 events — show timeline
- 2026-06-08 Pending — NORTHSTARMLS as Distributed by MLS Grid
- 2026-06-04 Relisted — NORTHSTARMLS as Distributed by MLS Grid
- 2026-05-30 Pending — NORTHSTARMLS as Distributed by MLS Grid
- 2026-05-09 Contingent — NORTHSTARMLS as Distributed by MLS Grid
- 2026-05-04 Listed $139,900 NORTHSTARMLS as Distributed by MLS Grid
Property tax history
+3.3%/yrLatest (2025): $1,102 · +4.0% YoY. Source: county tax records.
Cash-flow waterfall
monthlySold comps — $/sqft
last 12 mo · ≤1 miLoading sold comps…