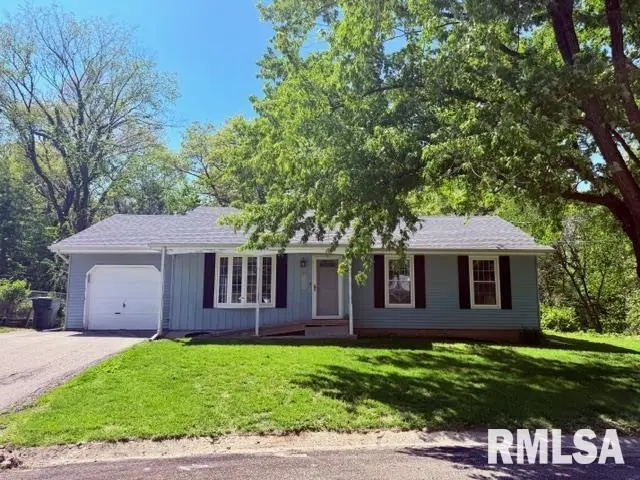
1321 N Schneblin Ct · Bellevue, IL
Flood risk 1/10 · Minimal
- FEMA flood zone
- X
- Chance of flooding over 30 yrs
- 0.0%
- Est. flood insurance / yr
- $473 – $860
Fire risk 1/10 · Minimal
- Est. fire insurance / yr
- $804 – $1,492
Heat risk 3/10 · Minor
- Hot days now (above 104°F)
- 7 days/yr
- Hot days in 30 yrs
- 18 days/yr
Wind risk 2/10 · Minimal
- Chance of severe wind over 30 yrs
- 1.0%
Air-quality risk 3/10 · Minor
- Unhealthy air days now
- 1 days/yr
- Unhealthy air days in 30 yrs
- 3 days/yr
Risk factors via First Street. Map © Google.
Why this score? — see what drove the D grade
The composite is a weighted blend of 9 inputs, each scored 0–100. Each bar is that input's sub-score; the figure is the points it added to the 100-point composite (weight × sub-score).
- ARV discount +12.0/15.0
- Cash flow +10.9/30.0
- 1% rule +4.2/10.0
- DSCR +3.2/10.0
- Livability +3.2/5.0
- Rent growth +3.1/5.0
- Schools +2.9/10.0
- Condition / age +2.5/5.0
- Appreciation +0.0/10.0
$118,000
🖨 Deal sheet 📄 Offer letter ✓ Due diligence
Listing remarks
A wooded backdrop with mature trees creates a peaceful setting behind this 3-bedroom, 1-bath home located on a quiet cul-de-sac with a private backyard. The property includes a partially finished basement providing additional living or storage space and flexibility for future use. An above-ground pool adds seasonal enjoyment to the outdoor area. Conveniently located near an elementary school this home offers a desirable neighborhood setting with easy access to local amenities. The layout provides a functional foundation and solid potential for updates and personalization throughout. This home is being sold "as-is" making it a great opportunity for buyers looking to invest, renovat
Key facts
- Wooded backdrop
- Private backyard
- Above-ground pool
Tags
Property features AI
Exterior
- Parking: Attached parking garage (1-car)
- Utilities: Public water; Public sewer
- Home design: Single family residence; Built in 1977
- Construction: Shingle roof
- Exterior features: Fenced yard; Above-ground pool; Lot on a cul-de-sac with ravine and wooded areas; Paved road access
Interior
- Kitchen: Refrigerator included
- Bedrooms: 3 bedrooms (main level bedrooms present; at least one bedroom has egress window)
- Flooring: Laminate flooring in some rooms; Carpet in some bedrooms and basement rooms; Vinyl flooring in kitchen and dining areas; Other/utility flooring in laundry and storage areas
- Bathrooms: 1 full bathroom
- Heating & cooling: Central air conditioning; Electric forced-air heating
- Interior features: Partially finished basement; No fireplaces reported
- Laundry & utility: Washer and dryer included; Electric water heater
Neighborhood map
What this means for you Summary
Snapshot
- This is a 3-bed/1.0-bath single-family listed at $118k.
Deal economics
- At list price, monthly cash flow is $-51 ($-611/yr) — negative.
- To cash-flow at today's rent, offer at most $109k (7.6% below list).
- To meet the 1% rule (rent ≥ 1% of price), the offer needs to be $108k (8.3% below list).
- Recommended offer: $108k (8.3% below list) — sets the bar for 1% rule.
Location & tenants
- Location reads 65/100 on livability (#601 in IL) — a middle-class / working-renter tenant base. Strengths: crime A+, cost of living A+, housing A+; Watch: employment C-, amenities F, commute F.
- Limestone Chsd 310 (rural): math 25% / reading 35% proficiency, ranked #486 of 919 in IL (top 53%) — families likely to look elsewhere, expect single-tenant / working-renter base with shorter leases.
- Zoned schools: Limestone Community High School (math 17% / reading 22%, grade F, #397 of 693 statewide, top 61%, 924 students, 0% FRL).
- Market conditions: Rents rising (+2.3%/yr); 180 active listings in the ZIP; 3 comparable units currently listed for rent nearby; rentals leasing fast (median 13d on market — plan ~1-2 weeks tenant-placement turnaround); 73 units permitted in Peoria County in 2024 (0 in 5+ unit buildings).
Forward outlook
- Local home prices are declining (-3.0%/yr); year-one equity from $816 of loan paydown is wiped out by about $4k of value loss. Plan a longer hold.
- Peoria County population projected at -11% by 2050 — secular population decline; favor cash flow + early exit over multi-decade hold.
Negotiation context
- It's been on market 46 days — a 3% lower offer ($114k) is reasonable based on typical stale-listing flexibility.
Questions for the listing agent
- What do current leases actually rent for vs. the listed asking? Can we see a recent rent roll and the last 12 months of T-12 income?
- It's been on market 46 days. Have you received any prior offers? Is the seller open to a 8% concession, seller financing, or rate buy-down credit?
- Built in 1977 — when were the roof, HVAC, electrical panel, plumbing, and water heater last replaced?
- Is there a deadline driving the sale (1031 exchange, divorce, estate, relocation)? That informs how much negotiation room exists.
- Schools are D-rated, which usually means shorter tenancies and higher turnover. Who's the typical renter profile here, and what's been the actual vacancy rate?
- The area grade is low — what's the realistic commute time and amenity access for the typical tenant pool here? Any planned neighborhood developments (good or bad) we should know about?
- What's the average days-on-market for RENTAL listings here right now (not sales)? A rising rental-DOM trend means longer vacancies and softer asking-rent achievability than the comps imply.
- What's the recent tenant-quality profile in this submarket — average credit score on applications, eviction rate, late-payment / NSF rate, and stable-employment percentage? A property-management company in the area should have these aggregated.
- How much new for-sale + rental construction is in the pipeline within 1–3 miles? Heavy new supply typically softens prices + rents 12–24 months out; constrained supply supports both.
Investment metrics
- 1% rule
- 0.92% ✗
- Cap rate
- 5.77%
- Cash-on-cash
- -1.85%
- DSCR
- 0.92
- GRM
- 9.1
CMA / ARV
- ARV (on-the-fly)
- $131,272
- Comps found
- 7
Show comp detail 7 sales within ~0.75 mi
| Address | Dist | Beds/Ba | Sqft | Sold | Price | $/sf | Match |
|---|---|---|---|---|---|---|---|
| 1118 Schneblin Ln | 0.20mi | 3/1.0 | 1,116 (+4%) | 10mo | $136,500 | $122 | 76 |
| 1134 N Coronado Dr | 0.23mi | 3/1.0 | 1,008 (-6%) | 11mo | $111,000 | $110 | 70 |
| 4610 W Merol Ct | 0.15mi | 3/1.0 | 1,200 (+12%) | 10mo | $115,000 | $96 | 66 |
| 4714 W Merol Ct | 0.17mi | 3/1.0 | 1,008 (-6%) | 21mo | $45,000 | $45 | 64 |
| 822 N Fernwood Cir | 0.46mi | 3/1.0 | 1,053 (-2%) | 14mo | $140,000 | $133 | 64 |
| 4928 W Farmington Rd | 0.49mi | 3/1.0 | 1,124 (+4%) | 11mo | $136,990 | $122 | 61 |
| 1408 N Autumn Ln | 0.05mi | 2/1.0 (-1) | 1,176 (+9%) | 20mo | $157,900 | $134 | 60 |
Match score weights: distance 35% · size 25% · config 20% · recency 20%. Top-matched comps best support the ARV.
Projected returns pro-forma
-3.0% appreciation · 2.3% rent growth · sell at horizon
- IRR
- -20.2%
- Equity multiple
- 0.30×
- Total profit
- $-23,051
- Equity at exit
- $17,594
- IRR
- -14.8%
- Equity multiple
- 0.18×
- Total profit
- $-27,021
- Equity at exit
- $10,202
Cash invested: $33,040 (down + closing). Projections, not guarantees.
Landlord ↔ Tenant lean methodology
- Overall (STATE)
- 43 Moderately Tenant-Leaning
- State Illinois
- 43 Moderately Tenant-Leaning · D+7
- County
- — inherits STATE
- City
- — inherits STATE
ZIP-level market 61604
- Home prices YoY
- -24.6%
- Rents YoY
- 2.3%
- Active inventory
- 180
- Price-to-rent
- 9.1×
Monthly cashflow live
- Estimated rent
- $1,082 medium interval (Pro) →
- Mortgage (P&I)
- −$619
- Tax from tax record
- −$238 /mo · $2,853/yr
- Insurance
- −$49
- HOA
- −$0
- Vacancy / Maint / Mgmt
- −$227
- Net cashflow
- $-51
Break-even live
UW: 25.0% down · 7.5% · 30yr · 1.5% tax · 5.0% vac · 8.0% maint · 8.0% mgmt
Financing live
Cash to close
- Down payment
- $29,500
- Closing costs
- $3,540
- Reserves months
- —
- Total cash needed
- —
Loan-product check · same deal, 3 products live
Conventional
25% down · 7.5% · 30yr
- Down + closing
- —
- Monthly P&I
- —
- Monthly cashflow
- —
- DSCR
- —
- Eligible?
- —
Personal DTI + credit; lowest rate.
DSCR
20% down · 8.5% · 30yr
- Down + closing
- —
- Monthly P&I
- —
- Monthly cashflow
- —
- DSCR
- —
- Eligible?
- —
No personal income docs; deal must DSCR.
Hard money
10% down · 12.0% · 12mo
- Down + closing
- —
- Monthly P&I
- —
- Monthly cashflow
- —
- DSCR
- —
- Eligible?
- —
Short-term bridge; refi at stabilization.
Rent comps 3 comps
| Address | Beds | Baths | Sqft | Rent | $/sqft | DOM | Units | Dist |
|---|---|---|---|---|---|---|---|---|
| 2109 N Abbey Cir Peoria, IL | 3.0 | 2.0 | 1088 | $1,009 | $0.93 | 13d | 1 | 1.23mi |
| 2600 N Lavalle Ct Peoria, IL | 1.0–3.0 | 1.0–2.0 | 803 | $1,150 | $1.43 | 13d | 26 | 1.44mi |
| 5917 W Plank Rd Apt 3 Bellevue, IL | 2.0 | 1.0 | 700 | $775 | $1.11 | 13d | 1 | 1.49mi |
Listing history 17 events
-
2026-06-19days on market $118,000 Under Contract 46 DOM
-
2026-06-18days on market $118,000 Under Contract 45 DOM
-
2026-06-17days on market $118,000 Under Contract 44 DOM
-
2026-06-16days on market $118,000 Under Contract 43 DOM
-
2026-06-15days on market $118,000 Under Contract 42 DOM
-
2026-06-14days on market $118,000 Under Contract 40 DOM
-
2026-06-13days on market $118,000 Under Contract 39 DOM
-
2026-06-10days on market $118,000 Under Contract 37 DOM
-
2026-06-09days on market $118,000 Under Contract 36 DOM
-
2026-06-08days on market $118,000 Under Contract 35 DOM
-
2026-06-07days on market $118,000 Under Contract 34 DOM
-
2026-06-03days on market $118,000 Under Contract 30 DOM
-
2026-06-02days on market $118,000 Under Contract 29 DOM
-
2026-06-01days on market $118,000 Under Contract 28 DOM
-
2026-05-31statusdays on market $118,000 Under Contract 27 DOM
-
2026-05-30days on market $118,000 Active 26 DOM
-
2026-05-04$126,000 Active
ⓘ Source: listings_history table (triggers on properties + properties_extension) + one-shot
backfill from property_details.listing_events for pre-trigger history.
Tax reassessment forecast IL · Partial reset (capped growth)
- Current annual tax
- $2,853 · $238/mo
- Projected year-2 tax
- $2,853 · $238/mo
- Expected delta
- $0/yr ($0/mo · 0.0%)
ⓘ Screening estimate from a state-policy table — verify with the county assessor before closing.
Climate risk First Street
- Flood 1/10 Low FEMA zone X · 0% chance over 30 yrs
- Wildfire 1/10 Low
- Heat 3/10 Moderate 7 d/yr ≥104°F today · 18 d/yr by 30 yrs out
- Wind 2/10 Low 100% chance of damaging wind over 30 yrs
- Air quality 3/10 Moderate 1 unhealthy d/yr today · 3 by 30 yrs out
Nearby sold comps map
Loading sold comps map…
Walkable amenities ~0.75 mi
Loading nearby amenities…
Taxation est. · year 1
- Rental income
- $12,984
- − Mortgage interest
- −$6,610
- − Property taxes
- −$2,853
- − Insurance
- −$590
- − Repairs & maintenance
- −$1,039
- − Management
- −$1,039
- − Depreciation
- −$3,433
- Taxable loss
- −$2,579
- Est. tax savings @ 24.0%
- +$619
- After-tax cash flow
- $8/yr
For passive investors: Depreciation is non-cash, so a rental often shows a tax loss while cash-flowing — sheltering income. Rental losses are passive: they offset passive income freely, and up to $25,000/yr can offset ordinary (W-2) income if you actively participate and your MAGI is under $100k (phasing out to $0 by $150k); unused losses carry forward. On sale, claimed depreciation is recaptured at up to 25%, and gains may owe capital-gains tax (a 1031 exchange can defer both). Figures are a year-1 estimate at your 24.0% rate — not tax advice; consult a CPA.
Schools (NCES district)
- District
- Limestone Chsd 310
- NCES district ID
- 1722950
- Math proficiency
- 25% ▲ 5.00%
- Reading proficiency
- 35% ▲ 4.00%
- Median HH income
- $49,759
- Composite
- 28.99/100
- National rank
- #11932
- State rank
- #486 of 919 in IL
Livability — Bellevue
- Score
- 65/100
- State rank
- #601
- US rank
- #12423
Category grades
Schools grade is shown separately in the Schools card above.
Census & demographics
- County
- Peoria County · 120,495 people
- Metro
- Peoria, IL
- Population (ZIP)
- 28,313
- Household income
- $52,414
- Rent vs Own
- Severe rent burden
- 815.0
Population outlook (Peoria County) Hauer SSP2
- Today (2025)
- 183,007 people
- By 2030
- 179,643 · -1.8%
- By 2040
- 171,782 · -6.1%
- By 2050
- 163,508 · -10.7%
- By 2075
- 140,178 · -23.4%
- By 2100
- 114,493 · -37.4%
Race, ethnicity, and origin ACS 2023
- Neighborhood character
- Diverse neighborhood (Simpson 0.61)
- Race & ethnicity
- White 55% Black 29% Two or more races 10% Hispanic / Latino 7% Asian 2%
- Hispanic origin (detail)
- Mexican 5%
- Common ancestry
- Italian 2% Slovak 1% Iranian 1%
- Foreign-born
- 6% · Canada, China
- Languages at home
- 92% English-only · Spanish 4% Chinese 1% French/Haitian/Cajun 1%
Political lean MEDSL · Peoria
- 2024 margin
- Toss-up / Even · D 51.5% · R 46.9% · Other 1.6%
- 2008→2024 swing
- -9.2pp toward R · 2008: 13.9pp · 2024: 4.7pp
- All cycles
- 2024: D+4.7 2020: D+6.3 2016: D+2.8 2012: D+4.4 2008: D+13.9
Not yet ingested
- Civics
- —
Market trends
- HPI YoY
- ▼ -54.15%
- Current HPI
- 165.8838
- Rent YoY
- ▲ 2.30%
- Metro
- Peoria, IL
- State GDP YoY
- ▲ 1.59%
- F500 in state
- 60
Industry mix (Fortune 500 HQ in IL)
| Industry | F500 HQs | Revenue |
|---|---|---|
| Insurance | 4 | $201B |
|
||
| Consumer Goods | 4 | $87B |
|
||
| Industrial Machinery | 3 | $64B |
|
||
| Healthcare | 2 | $55B |
|
||
| Retail / Pharmacy | 1 | $148B |
|
||
| Agriculture / Food | 1 | $86B |
|
||
Price history
1 event — show timeline
- 2026-05-04 Listed $126,000 RMLSA as Distributed by MLS Grid
Property tax history
+1.3%/yrLatest (2024): $2,853 · +8.8% YoY. Source: county tax records.
Cash-flow waterfall
monthlySold comps — $/sqft
last 12 mo · ≤1 miLoading sold comps…