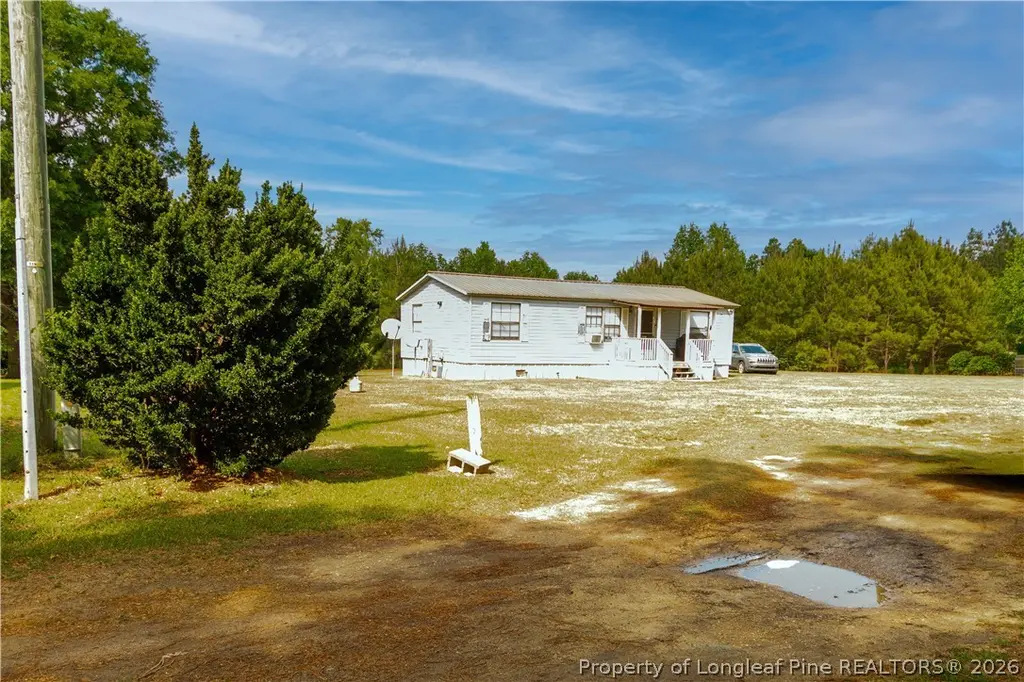
231 Knight Ln · Roseboro, NC
Flood risk 1/10 · Minimal
- FEMA flood zone
- X (unshaded)
- Chance of flooding over 30 yrs
- 0.0%
- Est. flood insurance / yr
- $507 – $1,088
Fire risk 5/10 · Moderate
- Est. fire insurance / yr
- $906 – $1,684
Heat risk 7/10 · Major
- Hot days now (above 106°F)
- 7 days/yr
- Hot days in 30 yrs
- 16 days/yr
Wind risk 8/10 · Major
- Chance of severe wind over 30 yrs
- 80.0%
Air-quality risk 1/10 · Minimal
- Unhealthy air days now
- 0 days/yr
- Unhealthy air days in 30 yrs
- 0 days/yr
Risk factors via First Street. Map © Google.
Why this score? — see what drove the B+ grade
The composite is a weighted blend of 9 inputs, each scored 0–100. Each bar is that input's sub-score; the figure is the points it added to the 100-point composite (weight × sub-score).
- Cash flow +30.0/30.0
- 1% rule +10.0/10.0
- DSCR +10.0/10.0
- ARV discount +7.5/15.0
- Appreciation +6.1/10.0
- Schools +3.4/10.0
- Livability +3.1/5.0
- Rent growth +2.5/5.0
- Condition / age +2.5/5.0
$89,900
🖨 Deal sheet 📄 Offer letter ✓ Due diligence
Listing remarks
Investor Special on Over an Acre! - Opportunity awaits at 231 Knight Ln in Autryville! This 3-bedroom, 2-bath manufactured home sits on a spacious 1.15-acre lot, offering privacy and plenty of room to expand, garden, or create your ideal outdoor space. The home features approximately 960 square feet with a functional layout and solid potential for the right buyer. Property is being sold * * AS-IS * * and is priced accordingly — * * HVAC System is currently non-functional * * and updates/repairs will be needed, making this an excellent option for investors, flippers, or buyers looking to customize a home to their liking. Enjoy country living while still being conveniently locat
Key facts
- 1.15 acre lot
- Built 1987
- Listed 42 days
Property features AI
Finance
- Other: Directions: From Fayetteville take NC-24 E toward Autryville for ~22 miles, left on Bullard Road for about 1.5 miles, then right onto Knight Lane
Exterior
- Utilities: Public water; Septic system with holding tank option
- Home design: Manufactured home; Residential property
- Construction: Vinyl siding
- Exterior features: Covered porch/patio; Lot is cleared
Interior
- Bathrooms: 2 full bathrooms
- Heating & cooling: Central air conditioning
- Interior features: One fireplace; Basement: None; Total of 5 rooms
Neighborhood map
What this means for you Summary
Snapshot
- This is a 3-bed/2.0-bath manufactured listed at $90k.
Deal economics
- At list price, monthly cash flow is $731 ($9k/yr) — positive.
- The deal already cash-flows at list — no discount required.
- Meets the 1% rule at list price ($2k rent vs $90k).
- Recommended offer: $87k (3.0% below list) — sets the bar for market timing.
- Cap rate 16.1% vs local median 7.6% in Roseboro — top-decile yield for the area; either an underpriced asset or a hidden risk that comps aren't pricing in. Stress-test before assuming the spread holds.
Location & tenants
- Location reads 62/100 on livability (#445 in NC) — a middle-class / working-renter tenant base. Strengths: cost of living A+, crime A, housing A-; Watch: schools D+, amenities F, commute F.
- Sampson County Schools (rural): math 40% / reading 41% proficiency, ranked #114 of 178 in NC (top 64%) — families likely to look elsewhere, expect single-tenant / working-renter base with shorter leases; 74% free/reduced lunch — lower-income household profile, screen leases tightly.
- Market conditions: 43 active listings in the ZIP; 189 units permitted in Sampson County in 2024 (0 in 5+ unit buildings).
Forward outlook
- In year one you build about $3k of equity ($622 loan paydown + $2k appreciation (2.2% local appreciation)).
- Sampson County population projected to shrink 5% by 2050 — rents likely to lag national; underwrite the cash flow, not the appreciation.
- At projected returns (2.2% appreciation + 3.0% rent growth), your $25k cash investment doubles in ~3 years — after that, you're playing with house money.
Negotiation context
- It's been on market 42 days — a 3% lower offer ($87k) is reasonable based on typical stale-listing flexibility.
Risks & watch-outs
- Climate carrying-cost: severe wind risk, 80% chance of damaging wind over 30y; moderate wildfire risk; extreme-heat days projected 7→16/yr by 2055 (HVAC capex compounding) — expect insurance premiums to compound above CPI over the hold.
Questions for the listing agent
- It's been on market 42 days. Have you received any prior offers? Is the seller open to a 3% concession, seller financing, or rate buy-down credit?
- Is there a deadline driving the sale (1031 exchange, divorce, estate, relocation)? That informs how much negotiation room exists.
- Schools are D-rated, which usually means shorter tenancies and higher turnover. Who's the typical renter profile here, and what's been the actual vacancy rate?
- What's the average days-on-market for RENTAL listings here right now (not sales)? A rising rental-DOM trend means longer vacancies and softer asking-rent achievability than the comps imply.
- What's the recent tenant-quality profile in this submarket — average credit score on applications, eviction rate, late-payment / NSF rate, and stable-employment percentage? A property-management company in the area should have these aggregated.
- How much new for-sale + rental construction is in the pipeline within 1–3 miles? Heavy new supply typically softens prices + rents 12–24 months out; constrained supply supports both.
Investment metrics
- 1% rule
- 1.77% ✓
- Cap rate
- 16.06%
- Cash-on-cash
- 34.87%
- DSCR
- 2.55
- GRM
- 4.7
CMA / ARV
No comps found within radius.
Projected returns pro-forma
2.21% appreciation · 3.0% rent growth · sell at horizon
- IRR
- 39.2%
- Equity multiple
- 3.13×
- Total profit
- $53,667
- Equity at exit
- $36,476
- IRR
- 40.0%
- Equity multiple
- 6.18×
- Total profit
- $130,501
- Equity at exit
- $53,318
Cash invested: $25,172 (down + closing). Projections, not guarantees.
Landlord ↔ Tenant lean methodology
- Overall (STATE)
- 85 Strongly Landlord-Friendly
- State North Carolina
- 85 Strongly Landlord-Friendly · R+3
- County
- — inherits STATE
- City
- — inherits STATE
ZIP-level market 28318
- Home prices YoY
- 0.8%
- Active inventory
- 43
- Price-to-rent
- 4.7×
Monthly cashflow live
- Estimated rent
- $1,592 medium interval (Pro) →
- Mortgage (P&I)
- −$471
- Tax from tax record
- −$17 /mo · $209/yr
- Insurance
- −$37
- HOA
- −$0
- Vacancy / Maint / Mgmt
- −$334
- Net cashflow
- $731
Break-even live
UW: 25.0% down · 7.5% · 30yr · 1.5% tax · 5.0% vac · 8.0% maint · 8.0% mgmt
Financing live
Cash to close
- Down payment
- $22,475
- Closing costs
- $2,697
- Reserves months
- —
- Total cash needed
- —
Loan-product check · same deal, 3 products live
Conventional
25% down · 7.5% · 30yr
- Down + closing
- —
- Monthly P&I
- —
- Monthly cashflow
- —
- DSCR
- —
- Eligible?
- —
Personal DTI + credit; lowest rate.
DSCR
20% down · 8.5% · 30yr
- Down + closing
- —
- Monthly P&I
- —
- Monthly cashflow
- —
- DSCR
- —
- Eligible?
- —
No personal income docs; deal must DSCR.
Hard money
10% down · 12.0% · 12mo
- Down + closing
- —
- Monthly P&I
- —
- Monthly cashflow
- —
- DSCR
- —
- Eligible?
- —
Short-term bridge; refi at stabilization.
Listing history 18 events
-
2026-06-18days on market $89,900 Active 42 DOM
-
2026-06-17days on market $89,900 Active 41 DOM
-
2026-06-16days on market $89,900 Active 40 DOM
-
2026-06-15days on market $89,900 Active 39 DOM
-
2026-06-14days on market $89,900 Active 37 DOM
-
2026-06-13days on market $89,900 Active 36 DOM
-
2026-06-10days on market $89,900 Active 34 DOM
-
2026-06-09days on market $89,900 Active 33 DOM
-
2026-06-08days on market $89,900 Active 32 DOM
-
2026-06-07days on market $89,900 Active 31 DOM
-
2026-06-05days on market $89,900 Active 28 DOM
-
2026-06-03days on market $89,900 Active 27 DOM
-
2026-06-02days on market $89,900 Active 26 DOM
-
2026-06-01days on market $89,900 Active 25 DOM
-
2026-05-31days on market $89,900 Active 24 DOM
-
2026-05-30days on market $89,900 Active 23 DOM
-
2026-05-08$89,900 Active
-
2026-05-08historical $89,900
ⓘ Source: listings_history table (triggers on properties + properties_extension) + one-shot
backfill from property_details.listing_events for pre-trigger history.
Tax reassessment forecast NC · Resets to sale price
- Current annual tax
- $209 · $17/mo
- Projected year-2 tax
- $737 · $61/mo
- Expected delta
- +$528/yr (+$44/mo · 252.1%)
ⓘ Screening estimate from a state-policy table — verify with the county assessor before closing.
Climate risk First Street
- Flood 1/10 Low FEMA zone X (unshaded) · 0% chance over 30 yrs
- Wildfire 5/10 Major
- Heat 7/10 Severe 7 d/yr ≥106°F today · 16 d/yr by 30 yrs out
- Wind 8/10 Severe 80% chance of damaging wind over 30 yrs
- Air quality 1/10 Low 0 unhealthy d/yr today · 0 by 30 yrs out
Nearby sold comps map
Loading sold comps map…
Walkable amenities ~0.75 mi
Loading nearby amenities…
Taxation est. · year 1
- Rental income
- $19,105
- − Mortgage interest
- −$5,036
- − Property taxes
- −$209
- − Insurance
- −$450
- − Repairs & maintenance
- −$1,528
- − Management
- −$1,528
- − Depreciation
- −$2,615
- Taxable income
- $7,738
- Est. tax owed @ 24.0%
- −$1,857
- After-tax cash flow
- $6,919/yr
For passive investors: Depreciation is non-cash, so a rental often shows a tax loss while cash-flowing — sheltering income. Rental losses are passive: they offset passive income freely, and up to $25,000/yr can offset ordinary (W-2) income if you actively participate and your MAGI is under $100k (phasing out to $0 by $150k); unused losses carry forward. On sale, claimed depreciation is recaptured at up to 25%, and gains may owe capital-gains tax (a 1031 exchange can defer both). Figures are a year-1 estimate at your 24.0% rate — not tax advice; consult a CPA.
Schools (NCES district)
- District
- Sampson County Schools
- NCES district ID
- 3704140
- Math proficiency
- 40% ▼ -6.00%
- Reading proficiency
- 41% ▼ -6.00%
- Median HH income
- $37,391
- Composite
- 33.71/100
- National rank
- #5379
- State rank
- #114 of 178 in NC
Livability — Roseboro
- Score
- 62/100
- State rank
- #445
- US rank
- #16397
Category grades
Schools grade is shown separately in the Schools card above.
Census & demographics
- Population (ZIP)
- 4,303
Population outlook (Sampson County) Hauer SSP2
- Today (2025)
- 63,499 people
- By 2030
- 62,970 · -0.8%
- By 2040
- 61,609 · -3.0%
- By 2050
- 60,462 · -4.8%
- By 2075
- 60,108 · -5.3%
- By 2100
- 62,120 · -2.2%
Race, ethnicity, and origin ACS 2023
- Neighborhood character
- Predominantly White (69%)
- Race & ethnicity
- White 69% Black 12% Hispanic / Latino 12% Two or more races 2% Asian 2% Native American 1%
- Hispanic origin (detail)
- Mexican 9%
- Common ancestry
- Slovak 2% Serbian 1% Italian 1%
- Foreign-born
- 4% · Canada, China
- Languages at home
- 92% English-only · Spanish 5% Korean 2% Chinese 1%
Political lean MEDSL · Sampson
- 2024 margin
- Strong R (+29.8) · D 34.8% · R 64.6%
- 2008→2024 swing
- -21.3pp toward R · 2008: -8.4pp · 2024: -29.8pp
- All cycles
- 2024: R+29.8 2020: R+22.5 2016: R+16.7 2012: R+11.0 2008: R+8.4
Not yet ingested
- Civics
- —
Market trends
- HPI YoY
- ▲ 2.21%
- Current HPI
- 263.6889
- Rent YoY
- —
- Metro
- —
- State GDP YoY
- ▲ 3.28%
- F500 in state
- 26
Industry mix (Fortune 500 HQ in NC)
| Industry | F500 HQs | Revenue |
|---|---|---|
| Financial Services | 2 | $213B |
|
||
| Retail | 2 | $95B |
|
||
| Industrial Conglomerate | 1 | $38B |
|
||
| Metals / Steel | 1 | $35B |
|
||
| Utilities | 1 | $30B |
|
||
| Industrial Machinery | 1 | $19B |
|
||
Price history
+0.0% since first listed2 events — show timeline
- 2026-05-08 Listed $89,900 LPRMLS
- 2026-05-08 Coming Soon $89,900 LPRMLS
Property tax history
+2.0%/yrLatest (2025): $209 · +10.6% YoY. Source: county tax records.
Cash-flow waterfall
monthlySold comps — $/sqft
last 12 mo · ≤1 miLoading sold comps…