6231 Gribble · Jacksonville, AR
Flood risk No data
- FEMA flood zone
- —
- Chance of flooding over 30 yrs
- —
- Est. flood insurance / yr
- —
Fire risk No data
- Est. fire insurance / yr
- —
Heat risk No data
- Hot days now (above threshold)
- —
- Hot days in 30 yrs
- —
Wind risk No data
- Chance of severe wind over 30 yrs
- —
Air-quality risk No data
- Unhealthy air days now
- —
- Unhealthy air days in 30 yrs
- —
Risk factors via First Street. Map © Google.
Why this score? — see what drove the B- grade
The composite is a weighted blend of 9 inputs, each scored 0–100. Each bar is that input's sub-score; the figure is the points it added to the 100-point composite (weight × sub-score).
- Cash flow +30.0/30.0
- 1% rule +10.0/10.0
- DSCR +10.0/10.0
- ARV discount +7.5/15.0
- Rent growth +3.3/5.0
- Livability +3.1/5.0
- Schools +1.7/10.0
- Condition / age +1.0/5.0
- Appreciation +0.0/10.0
$35,900
🖨 Deal sheet 📄 Offer letter ✓ Due diligence
Listing remarks MLS
Investor Special Property on 0.81 Acre Lot - Bring Your Contractor! Attention rehabbers, flippers, and buy-and-hold investors! This is a true value-add project with upside potential. Situated on a wooded lot with a long driveway, this property offers privacy and a great footprint for a full renovation or redevelopment. The basement provides additional usable space once finished, offering value-add potential. Ideal for investors looking for a project with strong after-repair value (ARV) potential. Interior layout includes multiple bedrooms, bathrooms, living spaces, and a lower level ready to be reimagined. Exterior features include a covered carport, an elevated deck with room to redesign outdoor living spaces. This is a blank slate waiting for the right buyer to bring it back to life! Whether you're planning a fix-and-flip, investment, or long-term rental, the location and lot offer huge potential once renovated. Sold AS-IS. Seller will not make any repairs. Unlock the hidden value in this property and turn it into your next profitable project!
Key facts
- Basement level
- Covered carport
- Long driveway
Tags
Neighborhood map
What this means for you Summary
Snapshot
- This is a 3-bed/1.0-bath single-family listed at $36k. Condition is rated poor.
Deal economics
- At list price, monthly cash flow is $710 ($9k/yr) — positive.
- The deal already cash-flows at list — no discount required.
- Meets the 1% rule at list price ($1k rent vs $36k).
- Recommended offer: $35k (1.5% below list) — sets the bar for market timing.
- Cap rate 30.0% vs local median 5.0% in Jacksonville — top-decile yield for the area; either an underpriced asset or a hidden risk that comps aren't pricing in. Stress-test before assuming the spread holds.
Location & tenants
- Location reads 61/100 on livability (#231 in AR) — a middle-class / working-renter tenant base. Strengths: cost of living A+, housing A+, health & safety A+; Watch: schools F, crime F, amenities F.
- Jacksonville North Pulaski School District (suburban): math 18% / reading 20% proficiency, ranked #211 of 238 in AR (top 89%) — low school quality limits family demand, transient renter base, plan for 1-2y turnover; 66% free/reduced lunch — lower-income household profile, screen leases tightly.
- Market conditions: Rents rising (+3.1%/yr); 154 active listings in the ZIP; 1,006 units permitted in Pulaski County in 2024 (0 in 5+ unit buildings).
Forward outlook
- Local home prices are declining (-3.0%/yr); year-one equity from $248 of loan paydown is wiped out by about $1k of value loss. Plan a longer hold.
- Pulaski County population projected at +6% by 2050 — modest demand growth; plan on rents tracking national, not racing it.
- At projected returns (-3.0% appreciation + 3.1% rent growth), your $10k cash investment doubles in ~2 years — after that, you're playing with house money.
Negotiation context
- It's been on market 22 days — a 2% lower offer ($35k) is reasonable based on typical stale-listing flexibility.
- 7 sale attempts since 7y ago; this cycle's ask has dropped $14k (28%) from the opening price — seller is motivated, your offer sets the floor, not the list.
Risks & watch-outs
- Watch-outs: property tax is 3.6% of price.
Questions for the listing agent
- Have any recent inspections been done? Can we get a copy of the seller's disclosures and any deferred-maintenance estimates?
- Built in 1979 — when were the roof, HVAC, electrical panel, plumbing, and water heater last replaced?
- Property tax is high relative to price — has the assessment been appealed recently, and will the sale trigger a re-assessment?
- Is there a deadline driving the sale (1031 exchange, divorce, estate, relocation)? That informs how much negotiation room exists.
- Schools are F-rated, which usually means shorter tenancies and higher turnover. Who's the typical renter profile here, and what's been the actual vacancy rate?
- Crime grade is F in this area — have there been break-ins, vandalism, or insurance claims at this property in the last 3 years? What carrier currently insures it and at what premium?
- What's the average days-on-market for RENTAL listings here right now (not sales)? A rising rental-DOM trend means longer vacancies and softer asking-rent achievability than the comps imply.
- What's the recent tenant-quality profile in this submarket — average credit score on applications, eviction rate, late-payment / NSF rate, and stable-employment percentage? A property-management company in the area should have these aggregated.
- How much new for-sale + rental construction is in the pipeline within 1–3 miles? Heavy new supply typically softens prices + rents 12–24 months out; constrained supply supports both.
Investment metrics
- 1% rule
- 3.60% ✓
- Cap rate
- 30.02%
- Cash-on-cash
- 84.75%
- DSCR
- 4.77
- GRM
- 2.3
CMA / ARV
- ARV (median comp)
- $150,945
- List price
- $35,900
- Delta
- -66.94%
- Verdict
- UNDERPRICED
- Comps
- 3 within 1.0 mi
Projected returns pro-forma
-3.0% appreciation · 3.07% rent growth · sell at horizon
- IRR
- 85.3%
- Equity multiple
- 4.93×
- Total profit
- $39,549
- Equity at exit
- $5,353
- IRR
- 88.5%
- Equity multiple
- 10.28×
- Total profit
- $93,273
- Equity at exit
- $3,104
Cash invested: $10,052 (down + closing). Projections, not guarantees.
Landlord ↔ Tenant lean methodology
- Overall (STATE)
- 92 Strongly Landlord-Friendly
- State Arkansas
- 92 Strongly Landlord-Friendly · R+14
- County
- — inherits STATE
- City
- — inherits STATE
ZIP-level market 72076
- Home prices YoY
- -30.3%
- Rents YoY
- 3.1%
- Active inventory
- 154
- Price-to-rent
- 2.3×
Monthly cashflow live
- Estimated rent
- $1,292 medium interval (Pro) →
- Mortgage (P&I)
- −$188
- Tax from tax record
- −$108 /mo · $1,294/yr
- Insurance
- −$15
- HOA
- −$0
- Vacancy / Maint / Mgmt
- −$271
- Net cashflow
- $710
Break-even live
UW: 25.0% down · 7.5% · 30yr · 1.5% tax · 5.0% vac · 8.0% maint · 8.0% mgmt
Financing live
Cash to close
- Down payment
- $8,975
- Closing costs
- $1,077
- Reserves months
- —
- Total cash needed
- —
Loan-product check · same deal, 3 products live
Conventional
25% down · 7.5% · 30yr
- Down + closing
- —
- Monthly P&I
- —
- Monthly cashflow
- —
- DSCR
- —
- Eligible?
- —
Personal DTI + credit; lowest rate.
DSCR
20% down · 8.5% · 30yr
- Down + closing
- —
- Monthly P&I
- —
- Monthly cashflow
- —
- DSCR
- —
- Eligible?
- —
No personal income docs; deal must DSCR.
Hard money
10% down · 12.0% · 12mo
- Down + closing
- —
- Monthly P&I
- —
- Monthly cashflow
- —
- DSCR
- —
- Eligible?
- —
Short-term bridge; refi at stabilization.
Listing history 32 events
-
2026-06-18days on market $35,900 Active 22 DOM
-
2026-06-17days on market $35,900 Active 21 DOM
-
2026-06-16days on market $35,900 Active 20 DOM
-
2026-06-15days on market $35,900 Active 19 DOM
-
2026-06-14days on market $35,900 Active 17 DOM
-
2026-06-13days on market $35,900 Active 16 DOM
-
2026-06-10days on market $35,900 Active 14 DOM
-
2026-06-09days on market $35,900 Active 13 DOM
-
2026-06-08days on market $35,900 Active 12 DOM
-
2026-06-07days on market $35,900 Active 11 DOM
-
2026-06-05days on market $35,900 Active 8 DOM
-
2026-06-03statusdays on market $35,900 Active 7 DOM
-
2026-06-02days on market $35,900 New Listing 6 DOM
-
2026-06-01days on market $35,900 New Listing 5 DOM
-
2026-05-31days on market $35,900 New Listing 4 DOM
-
2026-05-31days on market $35,900 New Listing 3 DOM
-
2025-12-01$49,900 New Listing 1062-char remark
Show marketing remark (1062 chars)
Investor Special Property on 0.81 Acre Lot - Bring Your Contractor! Attention rehabbers, flippers, and buy-and-hold investors! This is a true value-add project with upside potential. Situated on a wooded lot with a long driveway, this property offers privacy and a great footprint for a full renovation or redevelopment. The basement provides additional usable space once finished, offering value-add potential. Ideal for investors looking for a project with strong after-repair value (ARV) potential. Interior layout includes multiple bedrooms, bathrooms, living spaces, and a lower level ready to be reimagined. Exterior features include a covered carport, an elevated deck with room to redesign outdoor living spaces. This is a blank slate waiting for the right buyer to bring it back to life! Whether you're planning a fix-and-flip, investment, or long-term rental, the location and lot offer huge potential once renovated. Sold AS-IS. Seller will not make any repairs. Unlock the hidden value in this property and turn it into your next profitable project!
-
2021-04-15historical
-
2021-01-13status Back on Market
-
2021-01-05historical Take Backups
-
2020-12-04$55,900 New Listing
-
2020-07-01historical
-
2020-02-13$57,000 New Listing
-
2020-02-11historical
-
2020-01-09price $34,500
-
2020-01-08status Price Change
-
2019-11-02status Under Contract
-
2019-10-22historical Take Backups
-
2019-10-13historical
-
2019-09-07$29,000 New Listing
-
2019-07-31historical
-
2019-04-26$108,000 New Listing
ⓘ Source: listings_history table (triggers on properties + properties_extension) + one-shot
backfill from property_details.listing_events for pre-trigger history.
Tax reassessment forecast AR · Resets to sale price
- Current annual tax
- $1,294 · $108/mo
- Projected year-2 tax
- $1,294 · $108/mo
- Expected delta
- $0/yr ($0/mo · 0.0%)
ⓘ Screening estimate from a state-policy table — verify with the county assessor before closing.
Nearby sold comps map
Loading sold comps map…
Walkable amenities ~0.75 mi
Loading nearby amenities…
Taxation est. · year 1
- Rental income
- $15,508
- − Mortgage interest
- −$2,011
- − Property taxes
- −$1,294
- − Insurance
- −$180
- − Repairs & maintenance
- −$1,241
- − Management
- −$1,241
- − Depreciation
- −$1,044
- Taxable income
- $8,499
- Est. tax owed @ 24.0%
- −$2,040
- After-tax cash flow
- $6,480/yr
For passive investors: Depreciation is non-cash, so a rental often shows a tax loss while cash-flowing — sheltering income. Rental losses are passive: they offset passive income freely, and up to $25,000/yr can offset ordinary (W-2) income if you actively participate and your MAGI is under $100k (phasing out to $0 by $150k); unused losses carry forward. On sale, claimed depreciation is recaptured at up to 25%, and gains may owe capital-gains tax (a 1031 exchange can defer both). Figures are a year-1 estimate at your 24.0% rate — not tax advice; consult a CPA.
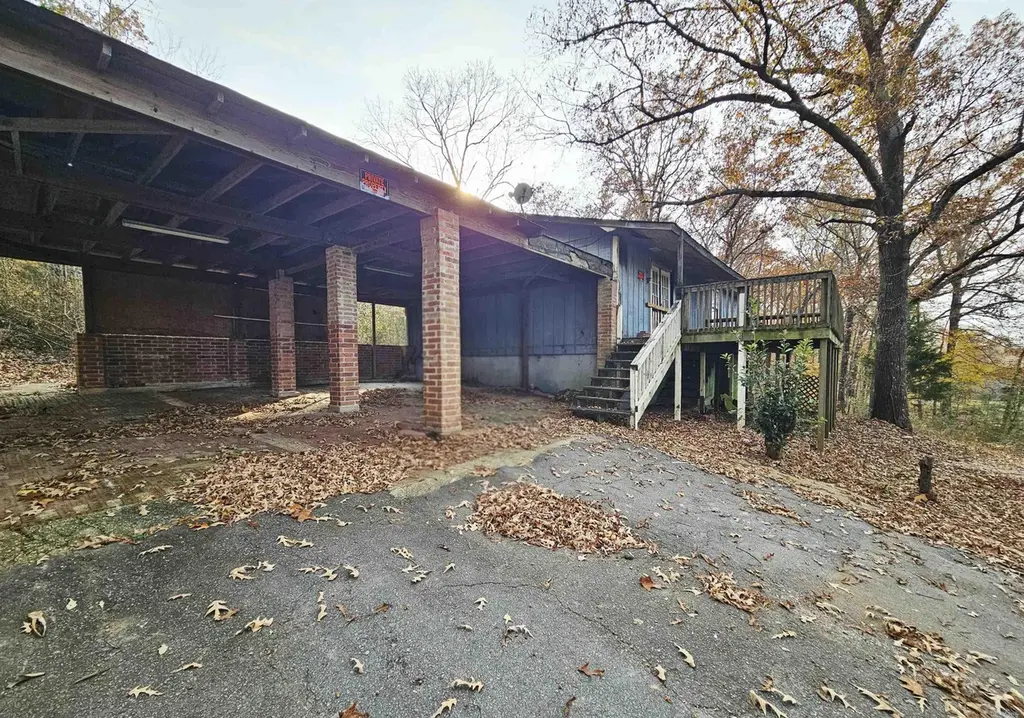
Condition & rehab AI · 1 photo
This property requires extensive repairs and updates to become move-in ready. Significant structural and exterior issues need addressing to increase its value.
Repairs flagged
- Major Exposed beams on roof — Structural damage
- Major Weathered siding — Significant deterioration
- Major Exposed brick — Structural damage
- Major Concrete driveway — Cracks and potential settling
Value-add opportunities
- Both Landscaping and curb appeal — Enhances curb appeal and property value
- Both Exterior repairs and repainting — Improves property appearance and value
- Both Interior repairs and updates — Enhances living space and value
Renovation cost estimate screening
| Repair item | Severity | Est. cost |
|---|---|---|
| Exposed beams on roof · Structural damage | Major | $15,000–50,000 |
| Weathered siding · Significant deterioration | Major | $15,000–50,000 |
| Exposed brick · Structural damage | Major | $15,000–50,000 |
| Concrete driveway · Cracks and potential settling | Major | $15,000–50,000 |
| Total estimated repair cost · 4 items | $60,000–200,000 |
Value-add ROI direction
- Both Landscaping and curb appeal — Enhances curb appeal and property value ↑
- Both Exterior repairs and repainting — Improves property appearance and value ↑
- Both Interior repairs and updates — Enhances living space and value ↑
ⓘ Cost ranges are severity-bucket heuristics (US national rule-of-thumb). Get contractor quotes + a written scope before underwriting a rehab budget.
Schools (NCES district)
- District
- Jacksonville North Pulaski School District
- NCES district ID
- 0500419
- Math proficiency
- 18% ▼ -7.00%
- Reading proficiency
- 20% ▼ -5.00%
- Median HH income
- $50,869
- Composite
- 17.16/100
- National rank
- #9110
- State rank
- #211 of 238 in AR
Livability — Jacksonville
- Score
- 61/100
- State rank
- #231
- US rank
- #17378
Category grades
Schools grade is shown separately in the Schools card above.
Census & demographics
- County
- Pulaski County · 372,764 people
- City population
- 38,437
- Metro
- Little Rock-North Little Rock-Conway, AR
- Population (ZIP)
- 38,437
- Household income
- $54,379
- Rent vs Own
- Severe rent burden
- 1733.0
Population outlook (Pulaski County) Hauer SSP2
- Today (2025)
- 415,378 people
- By 2030
- 423,720 · +2.0%
- By 2040
- 435,182 · +4.8%
- By 2050
- 440,904 · +6.1%
- By 2075
- 445,521 · +7.3%
- By 2100
- 419,173 · +0.9%
Race, ethnicity, and origin ACS 2023
- Neighborhood character
- Diverse neighborhood (Simpson 0.63)
- Race & ethnicity
- White 47% Black 38% Hispanic / Latino 8% Two or more races 8% Asian 1%
- Hispanic origin (detail)
- Mexican 6%
- Common ancestry
- Slovak 2% Italian 2% Serbian 1%
- Foreign-born
- 4% · Canada
- Languages at home
- 94% English-only · Spanish 4% Tagalog/Filipino 1%
Political lean MEDSL · Pulaski
- 2024 margin
- Strong D (+22.1) · D 59.8% · R 37.7% · Other 2.5%
- 2008→2024 swing
- +10.6pp toward D · 2008: 11.6pp · 2024: 22.1pp
- All cycles
- 2024: D+22.1 2020: D+22.5 2016: D+17.9 2012: D+11.4 2008: D+11.6
Not yet ingested
- Civics
- —
Market trends
- HPI YoY
- ▼ -87.51%
- Current HPI
- 201.6405
- Rent YoY
- ▲ 3.07%
- Metro
- Little Rock-North Little Rock-Conway, AR
- State GDP YoY
- ▲ 3.80%
- F500 in state
- 10
Industry mix (Fortune 500 HQ in AR)
| Industry | F500 HQs | Revenue |
|---|---|---|
| Retail | 1 | $681B |
|
||
| Food / Agriculture | 1 | $53B |
|
||
| Retail / Energy | 1 | $22B |
|
||
| Transportation / Logistics | 1 | $12B |
|
||
| Energy | 1 | $4B |
|
||
Price history
-53.8% since first listed16 events — show timeline
- 2025-12-01 Listed $49,900 CARMLS
- 2021-04-15 Listing Removed — CARMLS
- 2021-01-13 Relisted — CARMLS
- 2021-01-05 Contingent — CARMLS
- 2020-12-04 Listed $55,900 CARMLS
- 2020-07-01 Listing Removed — CARMLS
- 2020-02-13 Listed $57,000 CARMLS
- 2020-02-11 Listing Removed — CARMLS
- 2020-01-09 Price Changed $34,500 CARMLS
- 2020-01-08 Relisted — CARMLS
- 2019-11-02 Pending — CARMLS
- 2019-10-22 Contingent — CARMLS
- 2019-10-13 Listing Removed — CARMLS
- 2019-09-07 Listed $29,000 CARMLS
- 2019-07-31 Listing Removed — CARMLS
- 2019-04-26 Listed $108,000 CARMLS
Property tax history
+9.6%/yrLatest (2025): $1,294 · +7.1% YoY. Source: county tax records.
Cash-flow waterfall
monthlySold comps — $/sqft
last 12 mo · ≤1 miLoading sold comps…