 Multi-family
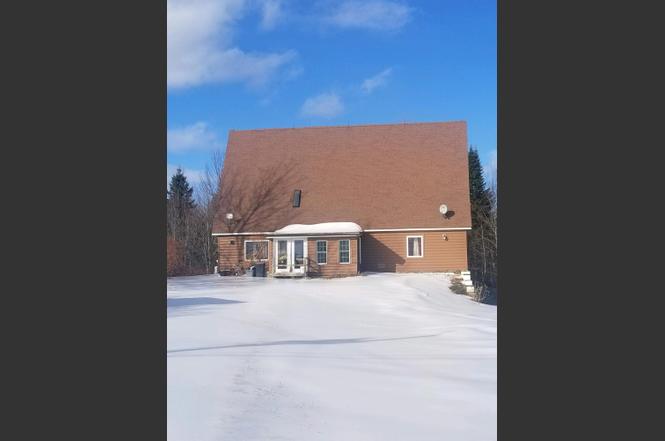
240 Hersom Rd · Mars Hill, ME
Flood risk 1/10 · Minimal
- FEMA flood zone
- X
- Chance of flooding over 30 yrs
- 0.0%
- Est. flood insurance / yr
- $507 – $1,088
Fire risk 3/10 · Minor
- Est. fire insurance / yr
- $669 – $1,243
Heat risk 1/10 · Minimal
- Hot days now (above 86°F)
- 6 days/yr
- Hot days in 30 yrs
- 12 days/yr
Wind risk 4/10 · Minor
- Chance of severe wind over 30 yrs
- 13.0%
Air-quality risk 1/10 · Minimal
- Unhealthy air days now
- 0 days/yr
- Unhealthy air days in 30 yrs
- 0 days/yr
Risk factors via First Street. Map © Google.
Why this score? — see what drove the D grade
The composite is a weighted blend of 9 inputs, each scored 0–100. Each bar is that input's sub-score; the figure is the points it added to the 100-point composite (weight × sub-score).
- Cash flow +8.7/30.0
- ARV discount +7.5/15.0
- Appreciation +6.1/10.0
- Schools +4.8/10.0
- 1% rule +3.9/10.0
- Livability +3.6/5.0
- Rent growth +2.5/5.0
- Condition / age +2.5/5.0
- DSCR +2.4/10.0
$155,000
🖨 Deal sheet (PDF) 📄 Offer letter ✓ Due diligence
Multi-family units
County records classify this as Multi-Family (2-4 Unit). Listing-text estimate: 1 unit. estimate disagrees with records
Listing remarks
This A-Frame style home was built in 2007 and needs some things finished and some redone. The seller will leave whatever building supplies are at the property to the new owner. The home has a nice flow to it and many pleasing features, the house plans are available. Come finish off things to your liking and have a wonderful home in the country. The taxes shown are for the home and 20 acres, 15 was previously sold off, therefore the taxes will be cheaper. INSIDE PICTURES WILL BE COMING SOON!
Key facts
- 5 acre lot
- 2 garage spots
- Built 2007
Property features AI
Exterior
- Parking: Attached 2-car garage; Gravel parking, 1–4 spaces
- Utilities: Well water; Sewer: unknown; Electric with generator hookup and circuit breakers; Electric water heater
- Home design: Single family residence; Built in 2007
- Construction: Vinyl siding and wood frame construction; Shingle roof; Concrete perimeter foundation
- Exterior features: Rolling/sloping, open and wooded 5-acre lot; Rural setting; Residential zoning
Interior
- Kitchen: Refrigerator; Gas range; Cooktop
- Bedrooms: Bedroom 1 on the first floor; Bedroom 2 on the second floor; Bedroom 3 on the second floor
- Flooring: Wood; Tile; Laminate
- Bathrooms: One full bathroom; One half bathroom
- Heating & cooling: Wood stove; Radiant heat; Baseboard heat
- Interior features: First-floor bedroom; Generator; 6 total rooms
- Laundry & utility: Laundry room on the first floor
Neighborhood map
What this means for you Summary
Snapshot
- This is a 3-bed/1.5-bath multifamily listed at $155k.
Deal economics
- At list price, monthly cash flow is $-131 ($-2k/yr) — negative.
- To cash-flow at today's rent, offer at most $132k (15.0% below list).
- To meet the 1% rule (rent ≥ 1% of price), the offer needs to be $137k (11.4% below list).
- Recommended offer: $132k (15.0% below list) — sets the bar for cash-flow.
Location & tenants
- Location reads 71/100 on livability (#67 in ME) — a middle-class / working-renter tenant base. Strengths: cost of living A+, health & safety A+, housing A; Watch: amenities F, commute F, employment D-.
- Easton Public Schools (rural): math 45% / reading 65% proficiency, ranked #39 of 185 in ME (top 21%) — acceptable for families but not a draw, mixed tenant base, ~2y average lease.
- Zoned schools: Easton Elementary School (math 87% / reading 87%, grade A+, #77 of 294 statewide, top 33%, 115 students, 36% FRL); Easton Junior-Senior High Sch (math 95% / reading 95%, grade A+, #12 of 108 statewide, top 15%, 93 students, 29% FRL) — zoned schools at 32% FRL track the district average.
- Zoned-school proficiency averages 91% at this address vs 55% district-wide (+36 pts) — the actual schools serving this property are materially stronger than the Easton Public Schools average implies; a family-tenant draw the district grade alone would hide.
- Market conditions: 7 active listings in the ZIP; 112 units permitted in Aroostook County in 2024 (45 in 5+ unit buildings).
Forward outlook
- In year one you build about $4k of equity ($1k loan paydown + $3k appreciation (2.1% local appreciation)).
- Aroostook County population projected at -33% by 2050 — secular population decline; favor cash flow + early exit over multi-decade hold.
- By year 8, paydown + projected appreciation supports a ~$33k cash-out refi (75% LTV) — recoverable capital for the next deal without selling this one.
Negotiation context
- It's been on market 101 days — a 9% lower offer ($141k) is reasonable based on typical stale-listing flexibility.
Risks & watch-outs
- Watch-outs: property tax is 2.6% of price.
Questions for the listing agent
- What do current leases actually rent for vs. the listed asking? Can we see a recent rent roll and the last 12 months of T-12 income?
- It's been on market 101 days. Have you received any prior offers? Is the seller open to a 15% concession, seller financing, or rate buy-down credit?
- Property tax is high relative to price — has the assessment been appealed recently, and will the sale trigger a re-assessment?
- Why hasn't it sold? Are there any deal-killer items the seller is aware of (foundation, flood, title, zoning, code violations)?
- Is there a deadline driving the sale (1031 exchange, divorce, estate, relocation)? That informs how much negotiation room exists.
- Schools are D-rated, which usually means shorter tenancies and higher turnover. Who's the typical renter profile here, and what's been the actual vacancy rate?
- The area grade is low — what's the realistic commute time and amenity access for the typical tenant pool here? Any planned neighborhood developments (good or bad) we should know about?
- What's the average days-on-market for RENTAL listings here right now (not sales)? A rising rental-DOM trend means longer vacancies and softer asking-rent achievability than the comps imply.
- What's the recent tenant-quality profile in this submarket — average credit score on applications, eviction rate, late-payment / NSF rate, and stable-employment percentage? A property-management company in the area should have these aggregated.
- How much new apartment / multifamily construction is in the pipeline within 1–3 miles? Heavy new supply (>2% of stock underway) typically softens rents 12–24 months out; light construction supports rent growth.
Investment metrics
- 1% rule
- 0.89% ✗
- Cap rate
- 5.28%
- Cash-on-cash
- -3.63%
- DSCR
- 0.84
- GRM
- 9.4
CMA / ARV
No comps found within radius.
Projected returns pro-forma
2.13% appreciation · 3.0% rent growth · sell at horizon
- IRR
- 1.5%
- Equity multiple
- 1.08×
- Total profit
- $3,432
- Equity at exit
- $62,263
- IRR
- 5.5%
- Equity multiple
- 1.76×
- Total profit
- $33,120
- Equity at exit
- $90,533
Cash invested: $43,400 (down + closing). Projections, not guarantees.
Landlord ↔ Tenant lean methodology
- Overall (STATE)
- 41 Moderately Tenant-Leaning
- State Maine
- 41 Moderately Tenant-Leaning · D+2
- County
- — inherits STATE
- City
- — inherits STATE
ZIP-level market 04740
- Home prices YoY
- 1.1%
- Active inventory
- 7
- Price-to-rent
- 9.4×
Monthly cashflow live
- Estimated rent
- $1,373 medium interval (Pro) →
- Mortgage (P&I)
- −$813
- Tax from tax record
- −$339 /mo · $4,064/yr
- Insurance
- −$65
- HOA
- −$0
- Vacancy / Maint / Mgmt
- −$288
- Net cashflow
- $-131
Break-even live
Sensitivity live
| Price | -10% $-44 | -5% $-87 | +0% $-131 | +5% $-175 | +10% $-219 |
|---|---|---|---|---|---|
| Rent | -10% $-240 | -5% $-186 | +0% $-131 | +5% $-77 | +10% $-23 |
| Rate | -1.0pp $-53 | -0.5pp $-92 | base $-131 | +0.5pp $-171 | +1.0pp $-212 |
UW: 25.0% down · 7.5% · 30yr · 1.5% tax · 5.0% vac · 8.0% maint · 8.0% mgmt
Financing live
Cash to close
- Down payment
- $38,750
- Closing costs
- $4,650
- Reserves months
- —
- Total cash needed
- —
Loan-product check · same deal, 3 products live
Conventional
25% down · 7.5% · 30yr
- Down + closing
- —
- Monthly P&I
- —
- Monthly cashflow
- —
- DSCR
- —
- Eligible?
- —
Personal DTI + credit; lowest rate.
DSCR
20% down · 8.5% · 30yr
- Down + closing
- —
- Monthly P&I
- —
- Monthly cashflow
- —
- DSCR
- —
- Eligible?
- —
No personal income docs; deal must DSCR.
Hard money
10% down · 12.0% · 12mo
- Down + closing
- —
- Monthly P&I
- —
- Monthly cashflow
- —
- DSCR
- —
- Eligible?
- —
Short-term bridge; refi at stabilization.
Listing history 19 events
-
2026-06-22days on market $155,000 Active 101 DOM
-
2026-06-21days on market $155,000 Active 100 DOM
-
2026-06-21days on market $155,000 Active 99 DOM
-
2026-06-18days on market $155,000 Active 97 DOM
-
2026-06-17days on market $155,000 Active 96 DOM
-
2026-06-16days on market $155,000 Active 95 DOM
-
2026-06-15days on market $155,000 Active 94 DOM
-
2026-06-13days on market $155,000 Active 92 DOM
-
2026-06-12days on market $155,000 Active 91 DOM
-
2026-06-09days on market $155,000 Active 88 DOM
-
2026-06-08days on market $155,000 Active 87 DOM
-
2026-06-07days on market $155,000 Active 86 DOM
-
2026-06-05days on market $155,000 Active 84 DOM
-
2026-06-04days on market $155,000 Active 82 DOM
-
2026-06-02days on market $155,000 Active 81 DOM
-
2026-06-01days on market $155,000 Active 80 DOM
-
2026-05-31days on market $155,000 Active 79 DOM
-
2026-05-31days on market $155,000 Active 78 DOM
-
2026-03-13$155,000 Active
ⓘ Source: listings_history table (triggers on properties + properties_extension) + one-shot
backfill from property_details.listing_events for pre-trigger history.
Tax reassessment forecast ME · Partial reset (capped growth)
- Current annual tax
- $4,064 · $339/mo
- Projected year-2 tax
- $4,064 · $339/mo
- Expected delta
- $0/yr ($0/mo · 0.0%)
ⓘ Screening estimate from a state-policy table — verify with the county assessor before closing.
Climate risk First Street
- Flood 1/10 Low FEMA zone X · 0% chance over 30 yrs
- Wildfire 3/10 Moderate
- Heat 1/10 Low 6 d/yr ≥86°F today · 12 d/yr by 30 yrs out
- Wind 4/10 Moderate 13% chance of damaging wind over 30 yrs
- Air quality 1/10 Low 0 unhealthy d/yr today · 0 by 30 yrs out
Nearby sold comps map
Loading sold comps map…
Walkable amenities ~0.75 mi
Loading nearby amenities…
Taxation est. · year 1
- Rental income
- $16,477
- − Mortgage interest
- −$8,682
- − Property taxes
- −$4,064
- − Insurance
- −$775
- − Repairs & maintenance
- −$1,318
- − Management
- −$1,318
- − Depreciation
- −$4,509
- Taxable loss
- −$4,189
- Est. tax savings @ 24.0%
- +$1,005
- After-tax cash flow
- $-570/yr
For passive investors: Depreciation is non-cash, so a rental often shows a tax loss while cash-flowing — sheltering income. Rental losses are passive: they offset passive income freely, and up to $25,000/yr can offset ordinary (W-2) income if you actively participate and your MAGI is under $100k (phasing out to $0 by $150k); unused losses carry forward. On sale, claimed depreciation is recaptured at up to 25%, and gains may owe capital-gains tax (a 1031 exchange can defer both). Figures are a year-1 estimate at your 24.0% rate — not tax advice; consult a CPA.
Schools (NCES district)
- District
- Easton Public Schools
- NCES district ID
- 2305310
- Math proficiency
- 45% ▬ 0.00%
- Reading proficiency
- 65% ▲ 10.00%
- Median HH income
- $38,868
- Composite
- 47.64/100
- National rank
- #4936
- State rank
- #39 of 185 in ME
Livability — Mars Hill
- Score
- 71/100
- State rank
- #67
- US rank
- #7268
Category grades
Schools grade is shown separately in the Schools card above.
Census & demographics
- Population (ZIP)
- 1,430
Population outlook (Aroostook County) Hauer SSP2
- Today (2025)
- 61,905 people
- By 2030
- 57,815 · -6.6%
- By 2040
- 49,240 · -20.5%
- By 2050
- 41,386 · -33.1%
- By 2075
- 27,664 · -55.3%
- By 2100
- 18,974 · -69.3%
Race, ethnicity, and origin ACS 2023
- Neighborhood character
- Predominantly White (97%)
- Race & ethnicity
- White 97% Native American 2%
- Common ancestry
- Lithuanian 23% German 4% Slovak 3%
- Foreign-born
- 3% · Canada
- Languages at home
- 95% English-only · German/W. Germanic 5% French/Haitian/Cajun 1%
Political lean MEDSL · Aroostook
- 2024 margin
- Strong R (+26.2) · D 36.2% · R 62.4% · Other 1.4%
- 2008→2024 swing
- -35.8pp toward R · 2008: 9.6pp · 2024: -26.2pp
- All cycles
- 2024: R+26.2 2020: R+19.9 2016: R+17.3 2012: D+7.7 2008: D+9.6
Not yet ingested
- Civics
- —
Market trends
- HPI YoY
- ▲ 2.13%
- Current HPI
- 201.6203
- Rent YoY
- —
- Metro
- —
- State GDP YoY
- —
- F500 in state
- 0
Price history
1 event — show timeline
- 2026-03-13 Listed $155,000 MREIS
Property tax history
+11.8%/yrLatest (2025): $4,064 · +54.5% YoY. Source: county tax records.
Cash-flow waterfall
monthlySold comps — $/sqft
last 12 mo · ≤1 miLoading sold comps…