 Triplex
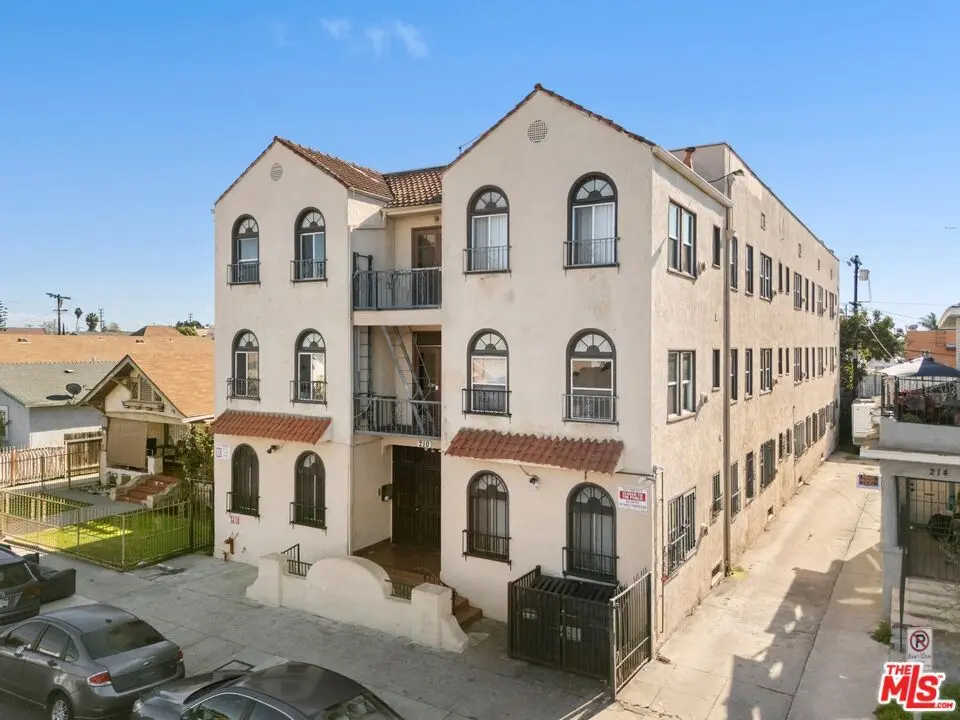
210 W 43rd Pl · Los Angeles, CA
Flood risk 1/10 · Minimal
- FEMA flood zone
- X (shaded)
- Chance of flooding over 30 yrs
- 0.0%
- Est. flood insurance / yr
- $507 – $1,088
Fire risk 1/10 · Minimal
- Est. fire insurance / yr
- $659 – $1,223
Heat risk 6/10 · Moderate
- Hot days now (above 88°F)
- 7 days/yr
- Hot days in 30 yrs
- 22 days/yr
Wind risk 1/10 · Minimal
- Chance of severe wind over 30 yrs
- —
Air-quality risk 5/10 · Moderate
- Unhealthy air days now
- 7 days/yr
- Unhealthy air days in 30 yrs
- 7 days/yr
Risk factors via First Street. Map © Google.
Why this score? — see what drove the F grade
The composite is a weighted blend of 9 inputs, each scored 0–100. Each bar is that input's sub-score; the figure is the points it added to the 100-point composite (weight × sub-score).
- Schools +3.6/10.0
- Livability +3.4/5.0
- Rent growth +2.9/5.0
- Condition / age +2.5/5.0
- Cash flow +0.0/30.0
- 1% rule +0.0/10.0
- DSCR +0.0/10.0
- ARV discount +0.0/15.0
- Appreciation +0.0/10.0
$3,600,000
🖨 Deal sheet 📄 Offer letter ✓ Due diligence
Multi-family units
County records classify this as Multi-Family (5+ Unit). Listing-text estimate: 3 units. estimate disagrees with records
5+ unit building — per-unit beds/baths from public records are typically unavailable; the breakdown below (if shown) is an estimate from the listing text.
Listing remarks MLS
Following its second price reduction, 210 W. 43rd Pl. is now offered at $3,600,000, or $120,000 per unit, positioning a 30-unit asset at a basis that now sits below several recent sales in the immediate area. At the current pricing, the property operates at a 6.81% CAP and 8.56 GRM on in-place rents, combining scale and day-one income in a way that is increasingly difficult to find at this level. The property consists of (30) studio units originally built in 1926. The configuration is straightforward, with a consistent unit mix that simplifies renovation planning and ongoing management. Several units have already been updated with tile flooring, improved cabinetry, gas stoves, wall-mounted A/C units, and ceiling fans, providing a clear path for continued interior upgrades across the remaining units. Two units are currently vacant, allowing a buyer to begin renovations and lease-up immediately and establish updated rent levels early in the hold period. The existing layouts provide practical living space with natural light, creating a repeatable framework for unit turns without requiring reconfiguration. Located in Historic South-Central, 210 W. 43rd Pl. sits within close proximity to USC, Exposition Park, the LA Memorial Coliseum, BMO Stadium, and The Shrine Auditorium. These long-standing institutional anchors continue to support consistent housing demand tied to education, healthcare, and event-driven employment. The property also benefits from direct access to Vermont Ave. and Western Ave. , connecting residents to Downtown Los Angeles and surrounding employment corridors. At $120,000 per unit with a 6.81% CAP and 8.56 GRM on current rents, 210 W. 43rd Pl. offers 30 units of scale at a basis that now sits below recent comparable sales, with a clear path to improving operations through a consistent renovation approach.
Key facts
- Ample cabinetry
- 30 unit multifamily
- Tile flooring
Tags
Neighborhood map
What this means for you Summary
Snapshot
- This is a 3 × ?-bed/1-bath units multifamily listed at $3.60M.
Deal economics
- At list price, monthly cash flow is $-17k ($-204k/yr) — negative. Per door: $-6k/mo.
- To cash-flow at today's rent, offer at most $642k (82.2% below list).
- To meet the 1% rule (rent ≥ 1% of price), the offer needs to be $762k (78.8% below list).
- Recommended offer: $642k (82.2% below list) — sets the bar for cash-flow.
- Cap rate 0.6% vs local median 2.1% in Los Angeles — below-typical yield; the buyer is paying a premium for something (appreciation thesis, condition, location) that the cap rate doesn't capture.
Location & tenants
- Location reads 68/100 on livability (#273 in CA) — a middle-class / working-renter tenant base. Strengths: amenities A+, commute A+, employment B; Watch: health & safety C-, schools D+, crime F.
- Los Angeles Unified (urban): math 29% / reading 54% proficiency, ranked #223 of 517 in CA (top 43%) — families likely to look elsewhere, expect single-tenant / working-renter base with shorter leases; 67% free/reduced lunch — lower-income household profile, screen leases tightly.
- Market conditions: Rents rising (+1.7%/yr); 99 active listings in the ZIP; 19,697 units permitted in Los Angeles County in 2024 (9,426 in 5+ unit buildings).
- At $7,624/mo this rent would consume 159% of the median local household income ($58k/yr) (locally 4200% of renters already pay >50% of income on rent) — very limited rent-growth headroom before tenants either downsize or default.
Forward outlook
- Local home prices are declining (-3.0%/yr); year-one equity from $25k of loan paydown is wiped out by about $108k of value loss. Plan a longer hold.
- Los Angeles County population projected at +9% by 2050 — modest demand growth; plan on rents tracking national, not racing it.
Negotiation context
- It's been on market 156 days — a 12% lower offer ($3.17M) is reasonable based on typical stale-listing flexibility.
- 7 sale attempts since 20y ago; this cycle's ask has dropped $350k (9%) from the opening price — seller is motivated, your offer sets the floor, not the list.
- Current owner paid $1.60M; list at $3.60M implies a 125% gain — meaningful room to come down on a strong offer.
Risks & watch-outs
- Watch-outs: built in 1926 — expect roof / HVAC / electrical / plumbing capex.
- Climate carrying-cost: extreme-heat days projected 7→22/yr by 2055 (HVAC capex compounding) — expect insurance premiums to compound above CPI over the hold.
Questions for the listing agent
- What do current leases actually rent for vs. the listed asking? Can we see a recent rent roll and the last 12 months of T-12 income?
- It's been on market 156 days. Have you received any prior offers? Is the seller open to a 82% concession, seller financing, or rate buy-down credit?
- Can we see the unit-by-unit rent roll, current vacancy, and any below-market leases? What's the average tenancy length?
- What capital expenditures (roof, boiler, parking lot, exteriors) have been made in the last 5 years, and what's planned in the next 2?
- Built in 1926 — when were the roof, HVAC, electrical panel, plumbing, and water heater last replaced?
- Why hasn't it sold? Are there any deal-killer items the seller is aware of (foundation, flood, title, zoning, code violations)?
- Is there a deadline driving the sale (1031 exchange, divorce, estate, relocation)? That informs how much negotiation room exists.
- Schools are D-rated, which usually means shorter tenancies and higher turnover. Who's the typical renter profile here, and what's been the actual vacancy rate?
- Crime grade is F in this area — have there been break-ins, vandalism, or insurance claims at this property in the last 3 years? What carrier currently insures it and at what premium?
- The area grade is low — what's the realistic commute time and amenity access for the typical tenant pool here? Any planned neighborhood developments (good or bad) we should know about?
- What's the average days-on-market for RENTAL listings here right now (not sales)? A rising rental-DOM trend means longer vacancies and softer asking-rent achievability than the comps imply.
- What's the recent tenant-quality profile in this submarket — average credit score on applications, eviction rate, late-payment / NSF rate, and stable-employment percentage? A property-management company in the area should have these aggregated.
- How much new apartment / multifamily construction is in the pipeline within 1–3 miles? Heavy new supply (>2% of stock underway) typically softens rents 12–24 months out; light construction supports rent growth.
Investment metrics
- 1% rule
- 0.21% ✗
- Cap rate
- 0.62%
- Cash-on-cash
- -20.27%
- DSCR
- 0.10
- GRM
- 39.3
CMA / ARV
- ARV (median comp)
- $2,597,758
- List price
- $3,600,000
- Delta
- 38.58%
- Verdict
- OVERPRICED
- Comps
- 8 within 2.0 mi
Projected returns pro-forma
-3.0% appreciation · 1.69% rent growth · sell at horizon
- IRR
- -59.4%
- Equity multiple
- -0.67×
- Total profit
- $-1,678,905
- Equity at exit
- $536,772
- IRR
- —
- Equity multiple
- -1.88×
- Total profit
- $-2,902,325
- Equity at exit
- $311,262
Cash invested: $1,008,000 (down + closing). Projections, not guarantees.
Landlord ↔ Tenant lean methodology
- Overall (CITY)
- 0 Strongly Tenant-Friendly
- State California
- 18 Strongly Tenant-Friendly · D+13
- County
- — inherits STATE
- City Los Angeles
- 0 Strongly Tenant-Friendly · D+22
ZIP-level market 90037
- Rents YoY
- 1.7%
- Active inventory
- 99
- Price-to-rent
- 118.0×
Monthly cashflow live
- Estimated rent
- $7,624 medium interval (Pro) →
- Mortgage (P&I)
- −$18,879
- Tax from tax record
- −$2,674 /mo · $32,085/yr
- Insurance
- −$1,500
- HOA
- −$0
- Vacancy / Maint / Mgmt
- −$1,601
- Net cashflow
- $-17,030
Break-even live
3-unit breakdown (identical units grouped — click to expand)
| Units | Beds | Baths | Est. rent |
|---|---|---|---|
| 3× units | 0 | 1 | $7,623 |
| #1 | 0 | 1 | $2,541 |
| #2 | 0 | 1 | $2,541 |
| #3 | 0 | 1 | $2,541 |
| Total (3 units) | $7,624 | ||
UW: 25.0% down · 7.5% · 30yr · 1.5% tax · 5.0% vac · 8.0% maint · 8.0% mgmt
Financing live
Cash to close
- Down payment
- $900,000
- Closing costs
- $108,000
- Reserves months
- —
- Total cash needed
- —
Loan-product check · same deal, 3 products live
Conventional
25% down · 7.5% · 30yr
- Down + closing
- —
- Monthly P&I
- —
- Monthly cashflow
- —
- DSCR
- —
- Eligible?
- —
Personal DTI + credit; lowest rate.
DSCR
20% down · 8.5% · 30yr
- Down + closing
- —
- Monthly P&I
- —
- Monthly cashflow
- —
- DSCR
- —
- Eligible?
- —
No personal income docs; deal must DSCR.
Hard money
10% down · 12.0% · 12mo
- Down + closing
- —
- Monthly P&I
- —
- Monthly cashflow
- —
- DSCR
- —
- Eligible?
- —
Short-term bridge; refi at stabilization.
Listing history 36 events
-
2026-06-18days on market $3,600,000 Active 156 DOM
-
2026-06-17days on market $3,600,000 Active 155 DOM
-
2026-06-16days on market $3,600,000 Active 154 DOM
-
2026-06-15days on market $3,600,000 Active 153 DOM
-
2026-06-13days on market $3,600,000 Active 151 DOM
-
2026-06-09days on market $3,600,000 Active 147 DOM
-
2026-06-08days on market $3,600,000 Active 146 DOM
-
2026-06-07days on market $3,600,000 Active 145 DOM
-
2026-06-04days on market $3,600,000 Active 142 DOM
-
2026-06-03days on market $3,600,000 Active 141 DOM
-
2026-06-02days on market $3,600,000 Active 140 DOM
-
2026-06-01days on market $3,600,000 Active 139 DOM
-
2026-05-31days on market $3,600,000 Active 138 DOM
-
2026-04-16price $3,600,000 1851-char remark
Show marketing remark (1851 chars)
Following its second price reduction, 210 W. 43rd Pl. is now offered at $3,600,000, or $120,000 per unit, positioning a 30-unit asset at a basis that now sits below several recent sales in the immediate area. At the current pricing, the property operates at a 6.81% CAP and 8.56 GRM on in-place rents, combining scale and day-one income in a way that is increasingly difficult to find at this level. The property consists of (30) studio units originally built in 1926. The configuration is straightforward, with a consistent unit mix that simplifies renovation planning and ongoing management. Several units have already been updated with tile flooring, improved cabinetry, gas stoves, wall-mounted A/C units, and ceiling fans, providing a clear path for continued interior upgrades across the remaining units. Two units are currently vacant, allowing a buyer to begin renovations and lease-up immediately and establish updated rent levels early in the hold period. The existing layouts provide practical living space with natural light, creating a repeatable framework for unit turns without requiring reconfiguration. Located in Historic South-Central, 210 W. 43rd Pl. sits within close proximity to USC, Exposition Park, the LA Memorial Coliseum, BMO Stadium, and The Shrine Auditorium. These long-standing institutional anchors continue to support consistent housing demand tied to education, healthcare, and event-driven employment. The property also benefits from direct access to Vermont Ave. and Western Ave. , connecting residents to Downtown Los Angeles and surrounding employment corridors. At $120,000 per unit with a 6.81% CAP and 8.56 GRM on current rents, 210 W. 43rd Pl. offers 30 units of scale at a basis that now sits below recent comparable sales, with a clear path to improving operations through a consistent renovation approach.
-
2026-02-25price $3,795,000 1851-char remark
Show marketing remark (1851 chars)
Following its second price reduction, 210 W. 43rd Pl. is now offered at $3,600,000, or $120,000 per unit, positioning a 30-unit asset at a basis that now sits below several recent sales in the immediate area. At the current pricing, the property operates at a 6.81% CAP and 8.56 GRM on in-place rents, combining scale and day-one income in a way that is increasingly difficult to find at this level. The property consists of (30) studio units originally built in 1926. The configuration is straightforward, with a consistent unit mix that simplifies renovation planning and ongoing management. Several units have already been updated with tile flooring, improved cabinetry, gas stoves, wall-mounted A/C units, and ceiling fans, providing a clear path for continued interior upgrades across the remaining units. Two units are currently vacant, allowing a buyer to begin renovations and lease-up immediately and establish updated rent levels early in the hold period. The existing layouts provide practical living space with natural light, creating a repeatable framework for unit turns without requiring reconfiguration. Located in Historic South-Central, 210 W. 43rd Pl. sits within close proximity to USC, Exposition Park, the LA Memorial Coliseum, BMO Stadium, and The Shrine Auditorium. These long-standing institutional anchors continue to support consistent housing demand tied to education, healthcare, and event-driven employment. The property also benefits from direct access to Vermont Ave. and Western Ave. , connecting residents to Downtown Los Angeles and surrounding employment corridors. At $120,000 per unit with a 6.81% CAP and 8.56 GRM on current rents, 210 W. 43rd Pl. offers 30 units of scale at a basis that now sits below recent comparable sales, with a clear path to improving operations through a consistent renovation approach.
-
2026-01-13$3,950,000 Active 1851-char remark
Show marketing remark (1851 chars)
Following its second price reduction, 210 W. 43rd Pl. is now offered at $3,600,000, or $120,000 per unit, positioning a 30-unit asset at a basis that now sits below several recent sales in the immediate area. At the current pricing, the property operates at a 6.81% CAP and 8.56 GRM on in-place rents, combining scale and day-one income in a way that is increasingly difficult to find at this level. The property consists of (30) studio units originally built in 1926. The configuration is straightforward, with a consistent unit mix that simplifies renovation planning and ongoing management. Several units have already been updated with tile flooring, improved cabinetry, gas stoves, wall-mounted A/C units, and ceiling fans, providing a clear path for continued interior upgrades across the remaining units. Two units are currently vacant, allowing a buyer to begin renovations and lease-up immediately and establish updated rent levels early in the hold period. The existing layouts provide practical living space with natural light, creating a repeatable framework for unit turns without requiring reconfiguration. Located in Historic South-Central, 210 W. 43rd Pl. sits within close proximity to USC, Exposition Park, the LA Memorial Coliseum, BMO Stadium, and The Shrine Auditorium. These long-standing institutional anchors continue to support consistent housing demand tied to education, healthcare, and event-driven employment. The property also benefits from direct access to Vermont Ave. and Western Ave. , connecting residents to Downtown Los Angeles and surrounding employment corridors. At $120,000 per unit with a 6.81% CAP and 8.56 GRM on current rents, 210 W. 43rd Pl. offers 30 units of scale at a basis that now sits below recent comparable sales, with a clear path to improving operations through a consistent renovation approach.
-
2014-03-31status Backup Offers Accepted
-
2014-03-19status Active
-
2014-03-14price Backup Offers Accepted
-
2014-03-14status Backup Offers Accepted
-
2013-12-03status Pending
-
2013-10-03Active
-
2011-09-14historical Withdrawn
-
2011-09-09Active
-
2009-03-10historical
-
2009-02-07price
-
2009-01-23
-
2008-11-05historical
-
2008-08-04
-
2007-05-07soldstatus $1,600,000
-
2007-05-04soldstatus $1,600,000
-
2007-01-12historical
-
2006-11-13$1,600,000
-
1986-12-19soldstatus $410,000
-
1986-12-19soldstatus $410,000
-
1986-12-09soldstatus $221,000
ⓘ Source: listings_history table (triggers on properties + properties_extension) + one-shot
backfill from property_details.listing_events for pre-trigger history.
Tax reassessment forecast CA · Resets to sale price
- Current annual tax
- $32,085 · $2,674/mo
- Projected year-2 tax
- $32,085 · $2,674/mo
- Expected delta
- $0/yr ($0/mo · 0.0%)
ⓘ Screening estimate from a state-policy table — verify with the county assessor before closing.
Climate risk First Street
- Flood 1/10 Low FEMA zone X (shaded) · 0% chance over 30 yrs
- Wildfire 1/10 Low
- Heat 6/10 Major 7 d/yr ≥88°F today · 22 d/yr by 30 yrs out
- Wind 1/10 Low
- Air quality 5/10 Major 7 unhealthy d/yr today · 7 by 30 yrs out
Nearby sold comps map
Loading sold comps map…
Walkable amenities ~0.75 mi
Loading nearby amenities…
Taxation est. · year 1
- Rental income
- $91,488
- − Mortgage interest
- −$201,656
- − Property taxes
- −$32,085
- − Insurance
- −$18,000
- − Repairs & maintenance
- −$7,319
- − Management
- −$7,319
- − Depreciation
- −$104,727
- Taxable loss
- −$279,618
- Est. tax savings @ 24.0%
- +$67,108
- After-tax cash flow
- $-137,247/yr
For passive investors: Depreciation is non-cash, so a rental often shows a tax loss while cash-flowing — sheltering income. Rental losses are passive: they offset passive income freely, and up to $25,000/yr can offset ordinary (W-2) income if you actively participate and your MAGI is under $100k (phasing out to $0 by $150k); unused losses carry forward. On sale, claimed depreciation is recaptured at up to 25%, and gains may owe capital-gains tax (a 1031 exchange can defer both). Figures are a year-1 estimate at your 24.0% rate — not tax advice; consult a CPA.
Schools (NCES district)
- District
- Los Angeles Unified
- NCES district ID
- 0622710
- Math proficiency
- 29% ▼ -4.00%
- Reading proficiency
- 54% ▲ 10.00%
- Median HH income
- $50,403
- Composite
- 35.67/100
- National rank
- #4875
- State rank
- #223 of 517 in CA
Livability — Los Angeles
- Score
- 68/100
- State rank
- #273
- US rank
- #9237
Category grades
Schools grade is shown separately in the Schools card above.
Census & demographics
- Census place
- Los Angeles, CA
- County
- Los Angeles County · 9,444,647 people
- City population
- 3,838,149
- Metro
- Los Angeles-Long Beach-Anaheim, CA
- Population (ZIP)
- 65,482
- Household income
- $57,622
- Rent vs Own
- Severe rent burden
- 4200.0
Population outlook (Los Angeles County) Hauer SSP2
- Today (2025)
- 10,940,515 people
- By 2030
- 11,256,481 · +2.9%
- By 2040
- 11,729,929 · +7.2%
- By 2050
- 11,948,407 · +9.2%
- By 2075
- 11,818,114 · +8.0%
- By 2100
- 10,842,928 · -0.9%
Race, ethnicity, and origin ACS 2023
- Neighborhood character
- Predominantly Hispanic (80%)
- Race & ethnicity
- Hispanic / Latino 80% Two or more races 15% Black 15% Native American 3% White 2% Asian 1%
- Hispanic origin (detail)
- Mexican 43%
- Common ancestry
- British 1%
- Foreign-born
- 44% · Canada, South Korea
- Languages at home
- 23% English-only · Spanish 74% Korean 1% French/Haitian/Cajun 1%
Political lean MEDSL · Los Angeles
- 2024 margin
- Solid D (+32.9) · D 64.8% · R 31.9% · Other 3.3%
- 2008→2024 swing
- -7.4pp toward R · 2008: 40.4pp · 2024: 32.9pp
- All cycles
- 2024: D+32.9 2020: D+44.2 2016: D+48.0 2012: D+40.0 2008: D+40.4
Not yet ingested
- Civics
- —
Market trends
- HPI YoY
- ▼ -639.09%
- Current HPI
- 467.0371
- Rent YoY
- ▲ 1.69%
- Metro
- Los Angeles-Long Beach-Anaheim, CA
- State GDP YoY
- ▲ 3.21%
- F500 in state
- 116
Industry mix (Fortune 500 HQ in CA)
| Industry | F500 HQs | Revenue |
|---|---|---|
| Technology | 27 | $1,492B |
|
||
| Financial Services | 3 | $174B |
|
||
| Retail | 3 | $44B |
|
||
| Insurance | 3 | $26B |
|
||
| Media / Entertainment | 2 | $115B |
|
||
| Pharmaceuticals / Biotech | 2 | $62B |
|
||
Price history
+1529.0% since first listed23 events — show timeline
- 2026-04-16 Price Changed $3,600,000 TheMLS
- 2026-02-25 Price Changed $3,795,000 TheMLS
- 2026-01-13 Listed $3,950,000 TheMLS
- 2014-03-31 Pending — TheMLS
- 2014-03-19 Relisted — TheMLS
- 2014-03-14 Pending — TheMLS
- 2014-03-14 Price Changed — TheMLS
- 2013-12-03 Pending — TheMLS
- 2013-10-03 Listed — TheMLS
- 2011-09-14 Delisted — TheMLS
- 2011-09-09 Listed — TheMLS
- 2009-03-10 Delisted — TheMLS
- 2009-02-07 Price Changed — TheMLS
- 2009-01-23 Listed — TheMLS
- 2008-11-05 Delisted — TheMLS
- 2008-08-04 Listed — TheMLS
- 2007-05-07 Sold (MLS) $1,600,000 TheMLS
- 2007-05-04 Sold (Public Records) $1,600,000 Public Records
- 2007-01-12 Delisted — TheMLS
- 2006-11-13 Listed $1,600,000 TheMLS
- 1986-12-19 Sold (Public Records) $410,000 Public Records
- 1986-12-19 Sold (Public Records) $410,000 Public Records
- 1986-12-09 Sold (Public Records) $221,000 Public Records
Property tax history
+2.4%/yrLatest (2025): $32,085 · +1.5% YoY. Source: county tax records.
Cash-flow waterfall
monthlySold comps — $/sqft
last 12 mo · ≤1 miLoading sold comps…