 Duplex
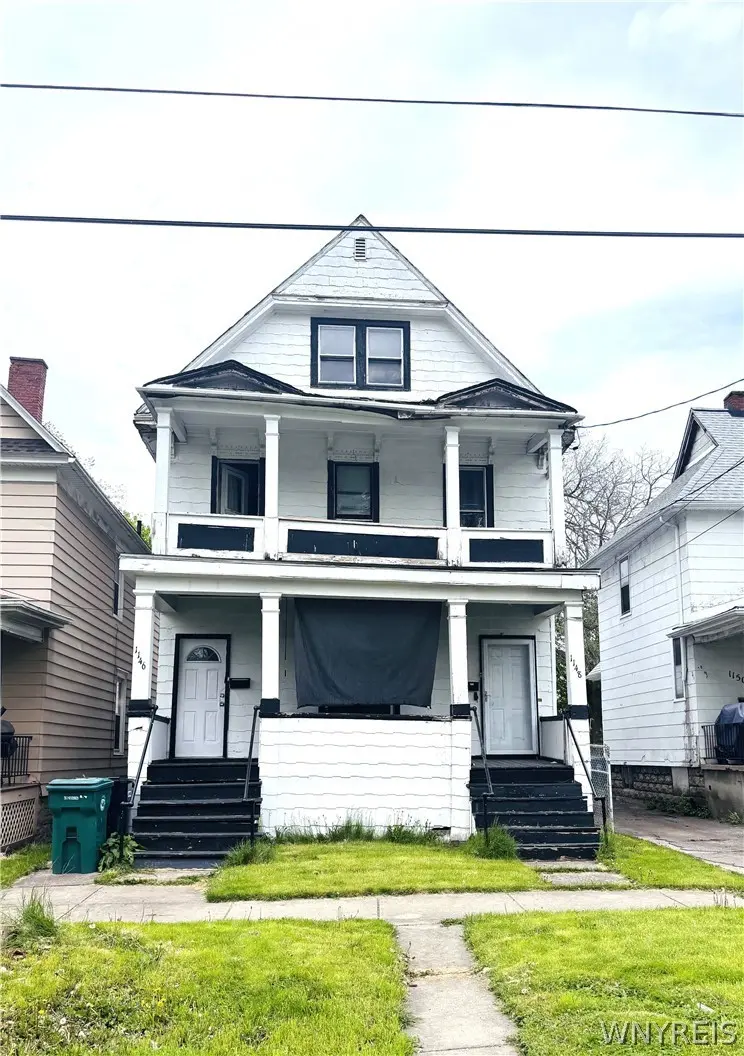
1148 Niagara Ave · Niagara Falls, NY
Flood risk 1/10 · Minimal
- FEMA flood zone
- X (unshaded)
- Chance of flooding over 30 yrs
- 0.0%
- Est. flood insurance / yr
- $473 – $860
Fire risk 2/10 · Minimal
- Est. fire insurance / yr
- $691 – $1,283
Heat risk 2/10 · Minimal
- Hot days now (above 94°F)
- 7 days/yr
- Hot days in 30 yrs
- 15 days/yr
Wind risk 1/10 · Minimal
- Chance of severe wind over 30 yrs
- —
Air-quality risk 3/10 · Minor
- Unhealthy air days now
- 2 days/yr
- Unhealthy air days in 30 yrs
- 3 days/yr
Risk factors via First Street. Map © Google.
Why this score? — see what drove the B+ grade
The composite is a weighted blend of 9 inputs, each scored 0–100. Each bar is that input's sub-score; the figure is the points it added to the 100-point composite (weight × sub-score).
- Cash flow +30.0/30.0
- ARV discount +15.0/15.0
- 1% rule +10.0/10.0
- DSCR +10.0/10.0
- Livability +3.0/5.0
- Rent growth +2.5/5.0
- Schools +2.5/10.0
- Condition / age +2.5/5.0
- Appreciation +0.0/10.0
$99,999
🖨 Deal sheet 📄 Offer letter ✓ Due diligence
Multi-family units
County records classify this as Multi-Family (2-4 Unit). Listing-text estimate: 2 units. confirmed
Listing remarks
Welcome to 1148 Niagara Ave. VR Priced - Seller will consider offers $105,000-$125,000. Very nice 3/3 2 unit. Great investment opportunity or owner occupied situation. One newer furnace and one new hot water tank. Spacious apartments, large parking area, street has many single homes, great location. Full attic, full basement with glass block windows. Do not miss this opportunity!
Key facts
- Newer furnace
- New hot water tank
- Full basement
Tags
Property features AI
Finance
- Financial info: Owner pays water; water is included in rent; Operating expenses include water/sewer; One unit reported leased with $1,000 monthly rent; second unit rent not listed
Exterior
- Parking: Common parking available
- Utilities: Public water connected; Sewer connected
- Home design: Two-story multifamily property (2 units total); Existing/resale property
- Construction: Composite siding; Block and stone foundation
- Exterior features: Rectangular residential lot with city street frontage; Lot dimensions approximately 32 x 134
Interior
- Kitchen: Oven/range; Microwave (in one unit); Eat-in kitchen and formal dining room in each unit
- Bedrooms: Two 3-bedroom units (bedrooms located on respective unit levels)
- Flooring: Carpet; Hardwood; Varies
- Bathrooms: Two full bathrooms and one half bathroom across the property
- Heating & cooling: Gas forced-air heating
- Interior features: Carpet and hardwood flooring; varies by room; Full basement
- Laundry & utility: Gas water heater
Neighborhood map
What this means for you Summary
Snapshot
- This is a 2 × 3-bed/1.2-bath units multifamily listed at $100k.
Deal economics
- At list price, monthly cash flow is $1k ($17k/yr) — positive. Per door: $697/mo.
- The deal already cash-flows at list — no discount required.
- Meets the 1% rule at list price ($3k rent vs $100k).
- Recommended offer: $97k (3.0% below list) — sets the bar for market timing.
- Cap rate 23.0% vs local median 7.7% in Niagara Falls — top-decile yield for the area; either an underpriced asset or a hidden risk that comps aren't pricing in. Stress-test before assuming the spread holds.
Location & tenants
- Location reads 60/100 on livability (#956 in NY) — a middle-class / working-renter tenant base. Strengths: cost of living A+, housing A+; Watch: schools F, crime F, amenities F.
- Niagara Falls City School District (urban): math 26% / reading 34% proficiency, ranked #578 of 590 in NY (top 98%) — families likely to look elsewhere, expect single-tenant / working-renter base with shorter leases; 66% free/reduced lunch — lower-income household profile, screen leases tightly.
- Market conditions: 142 active listings in the ZIP; 2 comparable units currently listed for rent nearby; 167 units permitted in Niagara County in 2024 (0 in 5+ unit buildings).
- At $2,745/mo this rent would consume 65% of the median local household income ($51k/yr) (locally 1095% of renters already pay >50% of income on rent) — very limited rent-growth headroom before tenants either downsize or default.
Forward outlook
- Local home prices are declining (-3.0%/yr); year-one equity from $691 of loan paydown is wiped out by about $3k of value loss. Plan a longer hold.
- Niagara County population projected at -19% by 2050 — secular population decline; favor cash flow + early exit over multi-decade hold.
- At projected returns (-3.0% appreciation + 3.0% rent growth), your $28k cash investment doubles in ~2 years — after that, you're playing with house money.
Negotiation context
- It's been on market 31 days — a 3% lower offer ($97k) is reasonable based on typical stale-listing flexibility.
- Current owner paid $38k; list at $100k implies a 163% gain — meaningful room to come down on a strong offer.
Risks & watch-outs
- Watch-outs: property tax is 2.5% of price; built in 1910 — expect roof / HVAC / electrical / plumbing capex.
Questions for the listing agent
- It's been on market 31 days. Have you received any prior offers? Is the seller open to a 3% concession, seller financing, or rate buy-down credit?
- Can we see the unit-by-unit rent roll, current vacancy, and any below-market leases? What's the average tenancy length?
- What capital expenditures (roof, boiler, parking lot, exteriors) have been made in the last 5 years, and what's planned in the next 2?
- Built in 1910 — when were the roof, HVAC, electrical panel, plumbing, and water heater last replaced?
- Property tax is high relative to price — has the assessment been appealed recently, and will the sale trigger a re-assessment?
- Is there a deadline driving the sale (1031 exchange, divorce, estate, relocation)? That informs how much negotiation room exists.
- Schools are F-rated, which usually means shorter tenancies and higher turnover. Who's the typical renter profile here, and what's been the actual vacancy rate?
- Crime grade is F in this area — have there been break-ins, vandalism, or insurance claims at this property in the last 3 years? What carrier currently insures it and at what premium?
- What's the average days-on-market for RENTAL listings here right now (not sales)? A rising rental-DOM trend means longer vacancies and softer asking-rent achievability than the comps imply.
- What's the recent tenant-quality profile in this submarket — average credit score on applications, eviction rate, late-payment / NSF rate, and stable-employment percentage? A property-management company in the area should have these aggregated.
- How much new apartment / multifamily construction is in the pipeline within 1–3 miles? Heavy new supply (>2% of stock underway) typically softens rents 12–24 months out; light construction supports rent growth.
Investment metrics
- 1% rule
- 2.75% ✓
- Cap rate
- 23.02%
- Cash-on-cash
- 59.73%
- DSCR
- 3.66
- GRM
- 3.0
CMA / ARV
- ARV (on-the-fly)
- $141,764
- Comps found
- 12
Show comp detail 12 sales within ~0.75 mi
| Address | Dist | Beds/Ba | Sqft | Sold | Price | $/sf | Match |
|---|---|---|---|---|---|---|---|
| 1635 South Ave | 0.34mi | 5/2.0 | 2,208 (-5%) | 2mo | $85,000 | $38 | 74 |
| 1145 Willow Ave | 0.38mi | 6/2.0 (+1) | 2,304 (-1%) | 3mo | $53,300 | $23 | 74 |
| 1813 South Ave | 0.43mi | 6/2.0 (+1) | 2,436 (+5%) | 6mo | $137,940 | $57 | 62 |
| 1882 Niagara Ave | 0.53mi | 5/2.5 | 2,527 (+9%) | 0mo | $155,000 | $61 | 58 |
| 814 Willow Ave | 0.48mi | 5/2.0 | 2,072 (-11%) | 2mo | $140,000 | $68 | 58 |
| 1023 15th St | 0.64mi | 5/4.0 | 2,304 (-1%) | 5mo | $190,000 | $82 | 57 |
| 1552 North Ave | 0.32mi | 4/2.0 (-1) | 2,016 (-13%) | 6mo | $155,000 | $77 | 52 |
| 1867 Michigan Ave | 0.57mi | 4/2.0 (-1) | 2,100 (-10%) | 2mo | $87,000 | $41 | 51 |
| 1623 Linwood Ave | 0.42mi | 4/2.0 (-1) | 1,994 (-14%) | 3mo | $100,000 | $50 | 49 |
| 1811 Weston Ave | 0.45mi | 5/3.0 | 1,998 (-14%) | 6mo | $140,000 | $70 | 46 |
| 2208 Weston Ave | 0.60mi | 4/2.0 (-1) | 2,016 (-13%) | 1mo | $55,000 | $27 | 44 |
| 2133 North Ave | 0.58mi | 6/2.0 (+1) | 2,048 (-12%) | 9mo | $170,000 | $83 | 41 |
Match score weights: distance 35% · size 25% · config 20% · recency 20%. Top-matched comps best support the ARV.
Projected returns pro-forma
-3.0% appreciation · 3.0% rent growth · sell at horizon
- IRR
- 58.5%
- Equity multiple
- 3.59×
- Total profit
- $72,652
- Equity at exit
- $14,910
- IRR
- 63.3%
- Equity multiple
- 7.35×
- Total profit
- $177,938
- Equity at exit
- $8,646
Cash invested: $28,000 (down + closing). Projections, not guarantees.
Landlord ↔ Tenant lean methodology
- Overall (STATE)
- 15 Strongly Tenant-Friendly
- State New York
- 15 Strongly Tenant-Friendly · D+10
- County
- — inherits STATE
- City
- — inherits STATE
ZIP-level market 14305
- Home prices YoY
- -10.9%
- Active inventory
- 142
- Price-to-rent
- 6.1×
Monthly cashflow live
- Estimated rent
- $2,745 high interval (Pro) →
- Mortgage (P&I)
- −$524
- Tax from tax record
- −$209 /mo · $2,506/yr
- Insurance
- −$42
- HOA
- −$0
- Vacancy / Maint / Mgmt
- −$576
- Net cashflow
- $1,394
Break-even live
2-unit breakdown (identical units grouped — click to expand)
| Units | Beds | Baths | Est. rent |
|---|---|---|---|
| 2× units | 3 | 1.2 | $2,746 |
| #1 | 3 | 1.2 | $1,373 |
| #2 | 3 | 1.2 | $1,373 |
| Total (2 units) | $2,745 | ||
UW: 25.0% down · 7.5% · 30yr · 1.5% tax · 5.0% vac · 8.0% maint · 8.0% mgmt
Financing live
Cash to close
- Down payment
- $25,000
- Closing costs
- $3,000
- Reserves months
- —
- Total cash needed
- —
Loan-product check · same deal, 3 products live
Conventional
25% down · 7.5% · 30yr
- Down + closing
- —
- Monthly P&I
- —
- Monthly cashflow
- —
- DSCR
- —
- Eligible?
- —
Personal DTI + credit; lowest rate.
DSCR
20% down · 8.5% · 30yr
- Down + closing
- —
- Monthly P&I
- —
- Monthly cashflow
- —
- DSCR
- —
- Eligible?
- —
No personal income docs; deal must DSCR.
Hard money
10% down · 12.0% · 12mo
- Down + closing
- —
- Monthly P&I
- —
- Monthly cashflow
- —
- DSCR
- —
- Eligible?
- —
Short-term bridge; refi at stabilization.
Rent comps 2 comps
| Address | Beds | Baths | Sqft | Rent | $/sqft | DOM | Units | Dist |
|---|---|---|---|---|---|---|---|---|
| 3025 Macklem Ave Niagara Falls, NY | 4.0 | 1.5 | 1750 | $2,200 | $1.26 | 43d | 1 | 0.80mi |
| 2020 Forest Ave Niagara Falls, NY | 4.0 | 2.0 | 1600 | $1,500 | $0.94 | 17d | 1 | 0.85mi |
Listing history 19 events
-
2026-06-18days on market $99,999 Active 31 DOM
-
2026-06-17price $99,999 Active 30 DOM
-
2026-06-17days on market $105,000 Active 30 DOM
-
2026-06-16days on market $105,000 Active 29 DOM
-
2026-06-15days on market $105,000 Active 28 DOM
-
2026-06-13days on market $105,000 Active 26 DOM
-
2026-06-13days on market $105,000 Active 25 DOM
-
2026-06-10days on market $105,000 Active 23 DOM
-
2026-06-09days on market $105,000 Active 22 DOM
-
2026-06-08days on market $105,000 Active 21 DOM
-
2026-06-07days on market $105,000 Active 20 DOM
-
2026-06-03days on market $105,000 Active 16 DOM
-
2026-06-02days on market $105,000 Active 15 DOM
-
2026-06-02remarks 382-char remark
-
2026-06-02price $105,000 Active 14 DOM
-
2026-06-01days on market $125,000 Active 14 DOM
-
2026-05-31days on market $125,000 Active 13 DOM
-
2026-05-18$135,000 Active
-
1997-07-30soldstatus $38,000
ⓘ Source: listings_history table (triggers on properties + properties_extension) + one-shot
backfill from property_details.listing_events for pre-trigger history.
Tax reassessment forecast NY · Partial reset (capped growth)
- Current annual tax
- $2,506 · $209/mo
- Projected year-2 tax
- $2,506 · $209/mo
- Expected delta
- $0/yr ($0/mo · 0.0%)
ⓘ Screening estimate from a state-policy table — verify with the county assessor before closing.
Climate risk First Street
- Flood 1/10 Low FEMA zone X (unshaded) · 0% chance over 30 yrs
- Wildfire 2/10 Low
- Heat 2/10 Low 7 d/yr ≥94°F today · 15 d/yr by 30 yrs out
- Wind 1/10 Low
- Air quality 3/10 Moderate 2 unhealthy d/yr today · 3 by 30 yrs out
Nearby sold comps map
Loading sold comps map…
Walkable amenities ~0.75 mi
Loading nearby amenities…
Taxation est. · year 1
- Rental income
- $32,940
- − Mortgage interest
- −$5,601
- − Property taxes
- −$2,506
- − Insurance
- −$500
- − Repairs & maintenance
- −$2,635
- − Management
- −$2,635
- − Depreciation
- −$2,909
- Taxable income
- $16,153
- Est. tax owed @ 24.0%
- −$3,877
- After-tax cash flow
- $12,847/yr
For passive investors: Depreciation is non-cash, so a rental often shows a tax loss while cash-flowing — sheltering income. Rental losses are passive: they offset passive income freely, and up to $25,000/yr can offset ordinary (W-2) income if you actively participate and your MAGI is under $100k (phasing out to $0 by $150k); unused losses carry forward. On sale, claimed depreciation is recaptured at up to 25%, and gains may owe capital-gains tax (a 1031 exchange can defer both). Figures are a year-1 estimate at your 24.0% rate — not tax advice; consult a CPA.
Schools (NCES district)
- District
- Niagara Falls City School District
- NCES district ID
- 3620820
- Math proficiency
- 26% ▼ -10.00%
- Reading proficiency
- 34% ▲ 3.00%
- Median HH income
- $32,488
- Composite
- 24.5/100
- National rank
- #7655
- State rank
- #578 of 590 in NY
Livability — Niagara Falls
- Score
- 60/100
- State rank
- #956
- US rank
- #18749
Category grades
Schools grade is shown separately in the Schools card above.
Census & demographics
- Census place
- Niagara Falls, NY
- County
- Niagara County · 157,377 people
- City population
- 62,983
- Metro
- Buffalo-Cheektowaga, NY
- Population (ZIP)
- 16,696
- Household income
- $51,004
- Rent vs Own
- Severe rent burden
- 1095.0
Population outlook (Niagara County) Hauer SSP2
- Today (2025)
- 204,149 people
- By 2030
- 197,900 · -3.1%
- By 2040
- 182,239 · -10.7%
- By 2050
- 165,198 · -19.1%
- By 2075
- 129,416 · -36.6%
- By 2100
- 96,222 · -52.9%
Race, ethnicity, and origin ACS 2023
- Neighborhood character
- Diverse neighborhood (Simpson 0.63)
- Race & ethnicity
- White 55% Black 24% Two or more races 13% Hispanic / Latino 8% Asian 1% Native American 1%
- Hispanic origin (detail)
- Puerto Rican 4%
- Common ancestry
- Romanian 6% Slovak 2% Lithuanian 2%
- Foreign-born
- 6% · Canada, Jamaica
- Languages at home
- 93% English-only · Spanish 4% Other Indo-European 1%
Political lean MEDSL · Niagara
- 2024 margin
- R (+14.9) · D 42.5% · R 57.5%
- 2008→2024 swing
- -15.9pp toward R · 2008: 1.0pp · 2024: -14.9pp
- All cycles
- 2024: R+14.9 2020: R+9.7 2016: R+19.0 2012: D+0.6 2008: D+1.0
Not yet ingested
- Civics
- —
Market trends
- HPI YoY
- ▼ -43.08%
- Current HPI
- 350.8741
- Rent YoY
- —
- Metro
- Buffalo-Cheektowaga, NY
- State GDP YoY
- ▲ 2.60%
- F500 in state
- 92
Industry mix (Fortune 500 HQ in NY)
| Industry | F500 HQs | Revenue |
|---|---|---|
| Financial Services | 10 | $950B |
|
||
| Consumer Goods | 9 | $162B |
|
||
| Insurance | 4 | $225B |
|
||
| Telecommunications | 2 | $144B |
|
||
| Pharmaceuticals | 2 | $112B |
|
||
| Media / Entertainment | 2 | $69B |
|
||
Price history
+255.3% since first listed2 events — show timeline
- 2026-05-18 Listed $135,000 WNYREIS
- 1997-07-30 Sold (Public Records) $38,000 Public Records
Property tax history
+14.3%/yrLatest (2025): $2,506 · -30.9% YoY. Source: county tax records.
Cash-flow waterfall
monthlySold comps — $/sqft
last 12 mo · ≤1 miLoading sold comps…