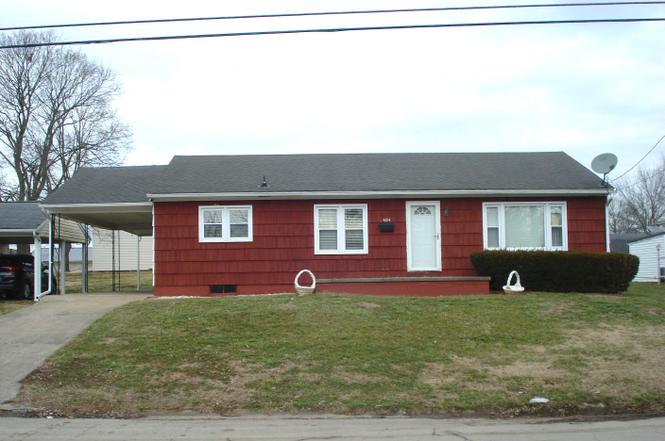
404 Broadway Ave · Cynthiana, KY
Flood risk 1/10 · Minimal
- FEMA flood zone
- X (unshaded)
- Chance of flooding over 30 yrs
- 0.0%
- Est. flood insurance / yr
- $507 – $1,088
Fire risk 1/10 · Minimal
- Est. fire insurance / yr
- $839 – $1,559
Heat risk 4/10 · Minor
- Hot days now (above 104°F)
- 7 days/yr
- Hot days in 30 yrs
- 19 days/yr
Wind risk 2/10 · Minimal
- Chance of severe wind over 30 yrs
- 2.0%
Air-quality risk 2/10 · Minimal
- Unhealthy air days now
- 1 days/yr
- Unhealthy air days in 30 yrs
- 2 days/yr
Risk factors via First Street. Map © Google.
Why this score? — see what drove the C grade
The composite is a weighted blend of 9 inputs, each scored 0–100. Each bar is that input's sub-score; the figure is the points it added to the 100-point composite (weight × sub-score).
- Cash flow +15.0/30.0
- ARV discount +13.7/15.0
- Appreciation +10.0/10.0
- DSCR +4.6/10.0
- Livability +3.7/5.0
- 1% rule +2.8/10.0
- Rent growth +2.5/5.0
- Condition / age +2.5/5.0
- Schools +2.2/10.0
$209,000
🖨 Deal sheet 📄 Offer letter ✓ Due diligence
Listing remarks
Nice home located in Western Hills. 3 bedrooms, 2 full baths and unfinished basement. Enclosed sun-room and attached carport. Nice yard.
Key facts
- Attached carport
- Enclosed sun-room
- Nice yard
Tags
Property features AI
Exterior
- Parking: Attached carport; Driveway; Carport included
- Utilities: Public water; Public sewer; Electricity connected; Natural gas connected; Cable available; Sewer connected; Water connected
- Home design: Single-story house
- Construction: Vinyl siding; Wood siding; Built using block foundation
- Exterior features: Shed(s); Block foundation; Dimensional style roof
Interior
- Kitchen: Refrigerator; Range
- Bedrooms: 7 total rooms (bedroom count not specified)
- Flooring: Carpet; Vinyl
- Bathrooms: 2 full bathrooms
- Heating & cooling: Forced-air heating (natural gas); Central electric air conditioning
- Interior features: Eat-in kitchen; Ceiling fan(s); Insulated windows; Blinds
- Laundry & utility: Washer hookup; Electric dryer hookup; Laundry on main level
Neighborhood map
What this means for you Summary
Snapshot
- This is a 3-bed/1.0-bath single-family listed at $209k.
Deal economics
- At list price, monthly cash flow is $66 ($795/yr) — positive.
- The deal already cash-flows at list — no discount required.
- To meet the 1% rule (rent ≥ 1% of price), the offer needs to be $163k (22.1% below list).
- Recommended offer: $163k (22.1% below list) — sets the bar for 1% rule.
- Cap rate 6.7% vs local median 3.5% in Cynthiana — top-decile yield for the area; either an underpriced asset or a hidden risk that comps aren't pricing in. Stress-test before assuming the spread holds.
Location & tenants
- Location reads 74/100 on livability (#113 in KY, #4,911 nationally) — a middle-class / working-renter tenant base. Strengths: cost of living A+, housing A+, health & safety A+; Watch: amenities F, commute F, employment D-.
- Harrison County (town): math 21% / reading 32% proficiency, ranked #133 of 165 in KY (top 81%) — low school quality limits family demand, transient renter base, plan for 1-2y turnover.
- Zoned schools: Westside Elementary School (math 22% / reading 27%, grade F, #489 of 676 statewide, top 76%, 350 students, 57% FRL); Harrison County Middle School (math 19% / reading 35%, grade F, #172 of 217 statewide, top 80%, 607 students, 58% FRL); Harrison County High School (math 29% / reading 41%, grade F, #74 of 254 statewide, top 29%, 865 students, 46% FRL) — zoned schools at 53% FRL track the district average.
- Market conditions: 95 active listings in the ZIP; 69 units permitted in Harrison County in 2024 (0 in 5+ unit buildings).
Forward outlook
- In year one you build about $22k of equity ($1k loan paydown + $21k appreciation (10.0% local appreciation)).
- Harrison County population projected to shrink 10% by 2050 — rents likely to lag national; underwrite the cash flow, not the appreciation.
- At projected returns (10.0% appreciation + 3.0% rent growth), your $59k cash investment doubles in ~3 years — after that, you're playing with house money.
- By year 2, paydown + projected appreciation supports a ~$36k cash-out refi (75% LTV) — recoverable capital for the next deal without selling this one.
Negotiation context
- It's been on market 115 days — a 9% lower offer ($190k) is reasonable based on typical stale-listing flexibility.
Risks & watch-outs
- Watch-outs: built in 1958 — expect roof / HVAC / electrical / plumbing capex.
Questions for the listing agent
- It's been on market 115 days. Have you received any prior offers? Is the seller open to a 22% concession, seller financing, or rate buy-down credit?
- Built in 1958 — when were the roof, HVAC, electrical panel, plumbing, and water heater last replaced?
- Why hasn't it sold? Are there any deal-killer items the seller is aware of (foundation, flood, title, zoning, code violations)?
- Is there a deadline driving the sale (1031 exchange, divorce, estate, relocation)? That informs how much negotiation room exists.
- What's the average days-on-market for RENTAL listings here right now (not sales)? A rising rental-DOM trend means longer vacancies and softer asking-rent achievability than the comps imply.
- What's the recent tenant-quality profile in this submarket — average credit score on applications, eviction rate, late-payment / NSF rate, and stable-employment percentage? A property-management company in the area should have these aggregated.
- How much new for-sale + rental construction is in the pipeline within 1–3 miles? Heavy new supply typically softens prices + rents 12–24 months out; constrained supply supports both.
Investment metrics
- 1% rule
- 0.78% ✗
- Cap rate
- 6.67%
- Cash-on-cash
- 1.36%
- DSCR
- 1.06
- GRM
- 10.7
CMA / ARV
- ARV (on-the-fly)
- $242,550
- Comps found
- 12
Show comp detail 12 sales within ~0.75 mi
| Address | Dist | Beds/Ba | Sqft | Sold | Price | $/sf | Match |
|---|---|---|---|---|---|---|---|
| 467 W Pleasant St | 0.06mi | 3/2.0 | 1,422 (+3%) | 7mo | $247,500 | $174 | 83 |
| 224 Cladorbon Dr | 0.14mi | 2/1.0 (-1) | 1,456 (+5%) | 14mo | $210,000 | $144 | 68 |
| 127 Creekview St | 0.43mi | 3/2.0 | 1,464 (+6%) | 1mo | $259,000 | $177 | 66 |
| 117 Southland Dr | 0.37mi | 3/2.0 | 1,496 (+8%) | 1mo | $275,000 | $184 | 65 |
| 138 Southland Dr | 0.40mi | 3/2.0 | 1,464 (+6%) | 4mo | $259,900 | $178 | 64 |
| 137 Southland Dr | 0.37mi | 3/2.0 | 1,460 (+5%) | 10mo | $256,400 | $176 | 61 |
| 106 Southland Dr | 0.39mi | 3/2.0 | 1,464 (+6%) | 13mo | $255,500 | $175 | 58 |
| 123 Creekview St | 0.43mi | 3/2.0 | 1,464 (+6%) | 11mo | $250,000 | $171 | 58 |
| 119 Creekview St | 0.43mi | 3/2.0 | 1,464 (+6%) | 13mo | $249,900 | $171 | 56 |
| 125 Southland | 0.37mi | 3/2.0 | 1,521 (+10%) | 9mo | $256,500 | $169 | 56 |
| 121 Creekview St | 0.43mi | 3/2.0 | 1,521 (+10%) | 7mo | $256,500 | $169 | 53 |
| 1380 Ky-356 | 0.70mi | 3/1.0 | 1,198 (-14%) | 3mo | $235,000 | $196 | 42 |
Match score weights: distance 35% · size 25% · config 20% · recency 20%. Top-matched comps best support the ARV.
Projected returns pro-forma
10.0% appreciation · 3.0% rent growth · sell at horizon
- IRR
- 25.2%
- Equity multiple
- 3.02×
- Total profit
- $117,935
- Equity at exit
- $188,284
- IRR
- 22.2%
- Equity multiple
- 6.87×
- Total profit
- $343,755
- Equity at exit
- $406,041
Cash invested: $58,520 (down + closing). Projections, not guarantees.
Landlord ↔ Tenant lean methodology
- Overall (STATE)
- 83 Strongly Landlord-Friendly
- State Kentucky
- 83 Strongly Landlord-Friendly · R+16
- County
- — inherits STATE
- City
- — inherits STATE
ZIP-level market 41031
- Home prices YoY
- 4.4%
- Active inventory
- 95
- Price-to-rent
- 10.7×
Monthly cashflow live
- Estimated rent
- $1,628 medium interval (Pro) →
- Mortgage (P&I)
- −$1,096
- Tax from tax record
- −$37 /mo · $445/yr
- Insurance
- −$87
- HOA
- −$0
- Vacancy / Maint / Mgmt
- −$342
- Net cashflow
- $66
Break-even live
UW: 25.0% down · 7.5% · 30yr · 1.5% tax · 5.0% vac · 8.0% maint · 8.0% mgmt
Financing live
Cash to close
- Down payment
- $52,250
- Closing costs
- $6,270
- Reserves months
- —
- Total cash needed
- —
Loan-product check · same deal, 3 products live
Conventional
25% down · 7.5% · 30yr
- Down + closing
- —
- Monthly P&I
- —
- Monthly cashflow
- —
- DSCR
- —
- Eligible?
- —
Personal DTI + credit; lowest rate.
DSCR
20% down · 8.5% · 30yr
- Down + closing
- —
- Monthly P&I
- —
- Monthly cashflow
- —
- DSCR
- —
- Eligible?
- —
No personal income docs; deal must DSCR.
Hard money
10% down · 12.0% · 12mo
- Down + closing
- —
- Monthly P&I
- —
- Monthly cashflow
- —
- DSCR
- —
- Eligible?
- —
Short-term bridge; refi at stabilization.
Listing history 17 events
-
2026-06-18days on market $209,000 Active 115 DOM
-
2026-06-17days on market $209,000 Active 114 DOM
-
2026-06-16days on market $209,000 Active 113 DOM
-
2026-06-15days on market $209,000 Active 112 DOM
-
2026-06-14days on market $209,000 Active 110 DOM
-
2026-06-10days on market $209,000 Active 107 DOM
-
2026-06-09days on market $209,000 Active 106 DOM
-
2026-06-08days on market $209,000 Active 105 DOM
-
2026-06-07days on market $209,000 Active 104 DOM
-
2026-06-03days on market $209,000 Active 100 DOM
-
2026-06-02days on market $209,000 Active 99 DOM
-
2026-06-01days on market $209,000 Active 98 DOM
-
2026-05-31days on market $209,000 Active 97 DOM
-
2026-05-31days on market $209,000 Active 96 DOM
-
2026-05-18price $209,000
-
2026-04-14price $219,000
-
2026-02-23$229,000 Active
ⓘ Source: listings_history table (triggers on properties + properties_extension) + one-shot
backfill from property_details.listing_events for pre-trigger history.
Tax reassessment forecast KY · Resets to sale price
- Current annual tax
- $445 · $37/mo
- Projected year-2 tax
- $1,797 · $150/mo
- Expected delta
- +$1,352/yr (+$113/mo · 303.5%)
ⓘ Screening estimate from a state-policy table — verify with the county assessor before closing.
Climate risk First Street
- Flood 1/10 Low FEMA zone X (unshaded) · 0% chance over 30 yrs
- Wildfire 1/10 Low
- Heat 4/10 Moderate 7 d/yr ≥104°F today · 19 d/yr by 30 yrs out
- Wind 2/10 Low 2% chance of damaging wind over 30 yrs
- Air quality 2/10 Low 1 unhealthy d/yr today · 2 by 30 yrs out
Nearby sold comps map
Loading sold comps map…
Walkable amenities ~0.75 mi
Loading nearby amenities…
Taxation est. · year 1
- Rental income
- $19,542
- − Mortgage interest
- −$11,707
- − Property taxes
- −$445
- − Insurance
- −$1,045
- − Repairs & maintenance
- −$1,563
- − Management
- −$1,563
- − Depreciation
- −$6,080
- Taxable loss
- −$2,863
- Est. tax savings @ 24.0%
- +$687
- After-tax cash flow
- $1,482/yr
For passive investors: Depreciation is non-cash, so a rental often shows a tax loss while cash-flowing — sheltering income. Rental losses are passive: they offset passive income freely, and up to $25,000/yr can offset ordinary (W-2) income if you actively participate and your MAGI is under $100k (phasing out to $0 by $150k); unused losses carry forward. On sale, claimed depreciation is recaptured at up to 25%, and gains may owe capital-gains tax (a 1031 exchange can defer both). Figures are a year-1 estimate at your 24.0% rate — not tax advice; consult a CPA.
Schools (NCES district)
- District
- Harrison County
- NCES district ID
- 2102580
- Math proficiency
- 21% ▼ -25.00%
- Reading proficiency
- 32% ▼ -19.00%
- Median HH income
- $39,744
- Composite
- 22.28/100
- National rank
- #8138
- State rank
- #133 of 165 in KY
Livability — Cynthiana
- Score
- 74/100
- State rank
- #113
- US rank
- #4911
Category grades
Schools grade is shown separately in the Schools card above.
Census & demographics
- Census place
- Cynthiana, KY
- Population (ZIP)
- 16,748
Population outlook (Harrison County) Hauer SSP2
- Today (2025)
- 18,605 people
- By 2030
- 18,361 · -1.3%
- By 2040
- 17,685 · -4.9%
- By 2050
- 16,845 · -9.5%
- By 2075
- 14,882 · -20.0%
- By 2100
- 12,314 · -33.8%
Race, ethnicity, and origin ACS 2023
- Neighborhood character
- Predominantly White (93%)
- Race & ethnicity
- White 93% Two or more races 4% Hispanic / Latino 2% Black 2%
- Common ancestry
- Slovak 2% Serbian 2% Italian 2%
- Foreign-born
- 1% · Canada
- Languages at home
- 97% English-only · Spanish 1% German/W. Germanic 1%
Political lean MEDSL · Harrison
- 2024 margin
- Solid R (+48.5) · D 25.1% · R 73.6% · Other 1.3%
- 2008→2024 swing
- -27.4pp toward R · 2008: -21.1pp · 2024: -48.5pp
- All cycles
- 2024: R+48.5 2020: R+44.4 2016: R+43.8 2012: R+29.1 2008: R+21.1
Not yet ingested
- Civics
- —
Market trends
- HPI YoY
- ▲ 14.31%
- Current HPI
- 339.482
- Rent YoY
- —
- Metro
- —
- State GDP YoY
- ▲ 1.81%
- F500 in state
- 4
Industry mix (Fortune 500 HQ in KY)
| Industry | F500 HQs | Revenue |
|---|---|---|
| Healthcare | 1 | $118B |
|
||
| Food / Beverage | 1 | $7B |
|
||
Price history
-8.7% since first listed3 events — show timeline
- 2026-05-18 Price Changed $209,000 ImagineMLS
- 2026-04-14 Price Changed $219,000 ImagineMLS
- 2026-02-23 Listed $229,000 ImagineMLS
Property tax history
-0.4%/yrLatest (2025): $445 · -6.3% YoY. Source: county tax records.
Cash-flow waterfall
monthlySold comps — $/sqft
last 12 mo · ≤1 miLoading sold comps…