1242 Silverstrand Dr · Bonita Springs, FL
Flood risk 5/10 · Moderate
- FEMA flood zone
- X (shaded)
- Chance of flooding over 30 yrs
- 0.24%
- Est. flood insurance / yr
- $507 – $1,088
Fire risk 3/10 · Minor
- Est. fire insurance / yr
- $947 – $1,759
Heat risk 10/10 · Severe
- Hot days now (above 107°F)
- 7 days/yr
- Hot days in 30 yrs
- 30 days/yr
Wind risk 10/10 · Severe
- Chance of severe wind over 30 yrs
- 99.0%
Air-quality risk 2/10 · Minimal
- Unhealthy air days now
- 1 days/yr
- Unhealthy air days in 30 yrs
- 1 days/yr
Risk factors via First Street. Map © Google.
Why this score? — see what drove the C+ grade
The composite is a weighted blend of 9 inputs, each scored 0–100. Each bar is that input's sub-score; the figure is the points it added to the 100-point composite (weight × sub-score).
- Cash flow +25.2/30.0
- DSCR +8.3/10.0
- ARV discount +7.5/15.0
- 1% rule +6.8/10.0
- Schools +5.0/10.0
- Livability +3.5/5.0
- Condition / age +2.5/5.0
- Rent growth +2.2/5.0
- Appreciation +0.0/10.0
$495,000
🖨 Deal sheet 📄 Offer letter ✓ Due diligence
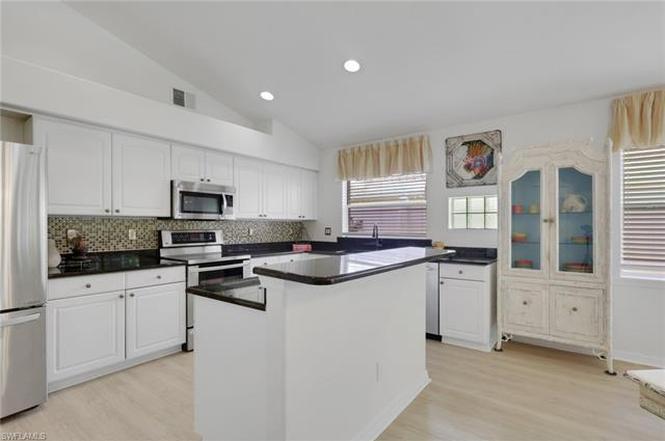
Listing remarks
NOT IN A FLOOD ZONE X500. Close to the beautiful sandy beaches of Naples lies this 3 bedroom 2 bathroom single family home with a 2 car garage and private back yard. Upon entering you are wowed with cathedral ceilings and views of a paradise setting. semi open floor concept make it a great entertainment space. New stainless steel appliances, granite counters and mosaic back splash are amongst some of the upgrades the home offers. Large overhang area on your screened in patio is great to enjoy that Florida Lifestyle. At the club at Sterling oaks you will enjoy great amenities including a gated entry, tennis courts and pickle ball courts, an olympic sized lap pool, poolside cabana offering ad
Key facts
- Private back yard
- Cathedral ceilings
- Entertainment space
Tags
Property features AI
Finance
- HOA & community: Mandatory HOA with professional management; Monthly HOA fee; HOA covers cable, internet/WiFi, irrigation water, lawn/land maintenance, legal/accounting, manager, recreation facilities, security, sewer, street lights, street maintenance and trash removal; Community amenities include clubhouse, community pool and spa, exercise room, tennis, pickleball, bocce, basketball, bocce, bike and jog path, playground, cabana, BBQ/picnic area, restaurant, sauna, sidewalks, streetlights and underground utilities; Gated community; One-time fees and annual recurring fees apply
Exterior
- Parking: Attached 2-car garage; 2+ parking spaces
- Security: Guarded gate community
- Utilities: Central water; Central sewer; Cable available
- Home design: Residential single-family home; 1 story / ranch; Rear exposure: West; Located in the Sterling Oaks community (Tavernier subdivision)
- Construction: Concrete block construction; Stucco exterior; Tile roof; Built in 1995
- Exterior features: Patio; Automatic sprinkler system; Landscaped area; Privacy wall; Single hung and sliding windows; Guard at gate
Interior
- Kitchen: Kitchen island; Pantry; Dishwasher; Range; Microwave; Refrigerator/ice maker; Garbage disposal
- Bedrooms: 3 bedrooms
- Flooring: Carpet; Laminate
- Bathrooms: 2 full bathrooms; Master bath with dual sinks and separate tub and shower
- Heating & cooling: Central electric heat; Central electric air conditioning; Ceiling fans
- Interior features: Built-in cabinets; Cathedral ceiling; Pantry; Smoke detectors; Walk-in closet; Wheelchair access; Split bedroom floor plan; Screened lanai/porch
- Laundry & utility: Laundry in residence; Washer; Dryer; Auto garage door
Neighborhood map
What this means for you Summary
Snapshot
- This is a 3-bed/2.0-bath single-family listed at $495k.
Deal economics
- At list price, monthly cash flow is $1k ($13k/yr) — positive.
- The deal already cash-flows at list — no discount required.
- Meets the 1% rule at list price ($6k rent vs $495k).
- Recommended offer: $465k (6.0% below list) — sets the bar for market timing.
- Cap rate 9.0% vs local median 1.7% in Bonita Springs — top-decile yield for the area; either an underpriced asset or a hidden risk that comps aren't pricing in. Stress-test before assuming the spread holds.
Location & tenants
- Location reads 70/100 on livability (#428 in FL) — a middle-class / working-renter tenant base. Strengths: crime A+, housing A+, employment A; Watch: cost of living C-, health & safety D, amenities F.
- Collier (suburban): math 60% / reading 56% proficiency, ranked #16 of 73 in FL (top 22%) — acceptable for families but not a draw, mixed tenant base, ~2y average lease.
- Zoned schools: Naples Park Elementary School (math 67% / reading 57%, grade B, #608 of 2,144 statewide, top 29%, 395 students, 48% FRL); Gulf Coast High School (math 57% / reading 68%, grade B-, #93 of 667 statewide, top 14%, 2,447 students, 20% FRL) — zoned schools average 34% FRL vs 55% district-wide (21 pts lower); this property's tenant base skews higher-income than the district average.
- Market conditions: Rents soft (-1.1%/yr); 595 active listings in the ZIP; 40 comparable units currently listed for rent nearby; rentals at typical pace (median 24d on market — plan ~3-4 weeks tenant-placement turnaround); solid renter incomes; 3,520 units permitted in Collier County in 2024 (959 in 5+ unit buildings).
- At $5,840/mo this rent would consume 72% of the median local household income ($98k/yr) (locally 1006% of renters already pay >50% of income on rent) — very limited rent-growth headroom before tenants either downsize or default.
Forward outlook
- Local home prices are declining (-3.0%/yr); year-one equity from $3k of loan paydown is wiped out by about $15k of value loss. Plan a longer hold.
- Collier County population projected at +30% by 2050 — long-run rental-demand tailwind backs the buy-and-hold thesis.
Negotiation context
- It's been on market 63 days — a 6% lower offer ($465k) is reasonable based on typical stale-listing flexibility.
- 8 sale attempts since 8y ago with the ask held roughly flat each time — persistent listings suggest the price (not the market) is what's stuck; bring a comps-based counter.
- Current owner paid $180k; list at $495k implies a 175% gain — meaningful room to come down on a strong offer.
Risks & watch-outs
- Climate carrying-cost: moderate flood risk; severe wind risk, 99% chance of damaging wind over 30y; extreme-heat days projected 7→30/yr by 2055 (HVAC capex compounding) — expect insurance premiums to compound above CPI over the hold.
Questions for the listing agent
- It's been on market 63 days. Have you received any prior offers? Is the seller open to a 6% concession, seller financing, or rate buy-down credit?
- What does the HOA fee cover, when was the last increase, and are there any pending special assessments or reserve-fund shortfalls?
- Why hasn't it sold? Are there any deal-killer items the seller is aware of (foundation, flood, title, zoning, code violations)?
- Is there a deadline driving the sale (1031 exchange, divorce, estate, relocation)? That informs how much negotiation room exists.
- What's the average days-on-market for RENTAL listings here right now (not sales)? A rising rental-DOM trend means longer vacancies and softer asking-rent achievability than the comps imply.
- What's the recent tenant-quality profile in this submarket — average credit score on applications, eviction rate, late-payment / NSF rate, and stable-employment percentage? A property-management company in the area should have these aggregated.
- How much new for-sale + rental construction is in the pipeline within 1–3 miles? Heavy new supply typically softens prices + rents 12–24 months out; constrained supply supports both.
Investment metrics
- 1% rule
- 1.18% ✓
- Cap rate
- 9.00%
- Cash-on-cash
- 9.65%
- DSCR
- 1.43
- GRM
- 7.1
CMA / ARV
No comps found within radius.
Projected returns pro-forma
-3.0% appreciation · 0.0% rent growth · sell at horizon
- IRR
- -5.2%
- Equity multiple
- 0.81×
- Total profit
- $-26,192
- Equity at exit
- $73,806
- IRR
- 0.4%
- Equity multiple
- 1.02×
- Total profit
- $3,028
- Equity at exit
- $42,799
Cash invested: $138,600 (down + closing). Projections, not guarantees.
Landlord ↔ Tenant lean methodology
- Overall (STATE)
- 87 Strongly Landlord-Friendly
- State Florida
- 87 Strongly Landlord-Friendly · R+3
- County
- — inherits STATE
- City
- — inherits STATE
ZIP-level market 34110
- Rents YoY
- -1.1%
- Active inventory
- 595
- Price-to-rent
- 7.1×
Monthly cashflow live
- Estimated rent
- $5,840 high interval (Pro) →
- Mortgage (P&I)
- −$2,596
- Tax from tax record
- −$169 /mo · $2,034/yr
- Insurance
- −$206
- HOA
- −$527
- Vacancy / Maint / Mgmt
- −$1,226
- Net cashflow
- $1,115
Break-even live
UW: 25.0% down · 7.5% · 30yr · 1.5% tax · 5.0% vac · 8.0% maint · 8.0% mgmt
Financing live
Cash to close
- Down payment
- $123,750
- Closing costs
- $14,850
- Reserves months
- —
- Total cash needed
- —
Loan-product check · same deal, 3 products live
Conventional
25% down · 7.5% · 30yr
- Down + closing
- —
- Monthly P&I
- —
- Monthly cashflow
- —
- DSCR
- —
- Eligible?
- —
Personal DTI + credit; lowest rate.
DSCR
20% down · 8.5% · 30yr
- Down + closing
- —
- Monthly P&I
- —
- Monthly cashflow
- —
- DSCR
- —
- Eligible?
- —
No personal income docs; deal must DSCR.
Hard money
10% down · 12.0% · 12mo
- Down + closing
- —
- Monthly P&I
- —
- Monthly cashflow
- —
- DSCR
- —
- Eligible?
- —
Short-term bridge; refi at stabilization.
Rent comps 40 comps
| Address | Beds | Baths | Sqft | Rent | $/sqft | DOM | Units | Dist |
|---|---|---|---|---|---|---|---|---|
| 1250 Silverstrand Dr Naples, FL | 3.0 | 2.0 | 1848 | $5,000 | $2.71 | 23d | 1 | 0.02mi |
| 1390 Sweetwater Cv #203 Naples, FL | 2.0 | 2.0 | 1279 | $2,200 | $1.72 | 13d | 1 | 0.21mi |
| 1405 Sweetwater Cv #204 Naples, FL | 3.0 | 2.0 | 1381 | $6,000 | $4.34 | 13d | 1 | 0.25mi |
| 1405 Sweetwater Cv #204 Naples, FL | 3.0 | 2.0 | 1381 | $6,000 | $4.34 | 23d | 1 | 0.25mi |
| 1360 Sweetwater Cv #202 Naples, FL | 2.0 | 2.0 | 1279 | $5,500 | $4.30 | 23d | 1 | 0.26mi |
| 1415 Sweetwater Cv #104 Naples, FL | 3.0 | 2.0 | 1381 | $6,500 | $4.71 | 23d | 1 | 0.27mi |
| 1420 Sweetwater Cv #102 Naples, FL | 2.0 | 2.0 | 1279 | $5,000 | $3.91 | 21d | 1 | 0.27mi |
| 1420 Sweetwater Cv #102 Naples, FL | 2.0 | 2.0 | 1279 | $5,000 | $3.91 | 23d | 1 | 0.27mi |
| 1325 Sweetwater Cv #201 Naples, FL | 3.0 | 2.0 | 1381 | $6,000 | $4.34 | 23d | 1 | 0.30mi |
| 1340 Sweetwater Cv #103 Naples, FL | 2.0 | 2.0 | 1279 | $5,000 | $3.91 | 23d | 1 | 0.31mi |
| 1214 Sweetwater Ln #2306 Naples, FL | 2.0 | 2.0 | 1378 | $6,500 | $4.72 | 23d | 1 | 0.31mi |
| 1345 Sweetwater Cv #203 Naples, FL | 2.0 | 2.0 | 1279 | $4,800 | $3.75 | 23d | 1 | 0.32mi |
| 1680 Sanctuary Pointe Ct Naples, FL | 3.0 | 2.0 | 1888 | $5,900 | $3.12 | 23d | 1 | 0.39mi |
| 14907 Sterling Oaks Dr Naples, FL | 3.0 | 3.0 | 1760 | $6,500 | $3.69 | 23d | 1 | 0.45mi |
| 14508 Sterling Oaks Dr Naples, FL | 3.0 | 2.0 | 2599 | $9,500 | $3.66 | 23d | 1 | 0.46mi |
| 14478 Sterling Oaks Dr Naples, FL | 3.0 | 3.0 | 2173 | $4,000 | $1.84 | 23d | 1 | 0.51mi |
| 28452 Del Lago Way Bonita Springs, FL | 4.0 | 3.0 | 2201 | $7,700 | $3.50 | 23d | 1 | 0.53mi |
| 28700 Trails Edge Blvd Bonita Springs, FL | 3.0 | 2.0 | 1458 | $2,175 | $1.49 | 3d | 2 | 0.58mi |
| 15985 Arbor View Blvd Naples, FL | 2.0–4.0 | 2.0 | 1208 | $2,062 | $1.71 | 13d | 14 | 0.60mi |
| 28790 Versol Dr Bonita Springs, FL | 1.0–3.0 | 1.0–2.0 | 1075 | $3,391 | $3.15 | 1d | 19 | 0.65mi |
| 28650 Carriage Home Dr Unit 1049692P Bonita Springs, FL | 3.0 | 2.0 | 1528 | $3,980 | $2.60 | 16d | 1 | 0.70mi |
| 28611 Carriage Home Dr #101 Bonita Springs, FL | 2.0 | 2.0 | 1433 | $2,550 | $1.78 | 23d | 1 | 0.73mi |
| 28399 Del Lago Way Bonita Springs, FL | 4.0 | 2.5 | 2326 | $10,000 | $4.30 | 23d | 1 | 0.76mi |
| 28070 Winthrop Cir Bonita Springs, FL | 3.0 | 3.0 | 2008 | $12,000 | $5.98 | 23d | 1 | 0.77mi |
| 1025 Tarpon Cove Dr #203 Naples, FL | 2.0 | 2.0 | 1225 | $5,500 | $4.49 | 13d | 1 | 0.81mi |
| 28211 Winthrop Cir Bonita Springs, FL | 3.0 | 2.0 | 1918 | $10,500 | $5.47 | 23d | 1 | 0.87mi |
| 526 Lake Louise Cir Unit 4-403 Naples, FL | 3.0 | 2.0 | 1740 | $6,500 | $3.74 | 23d | 1 | 0.88mi |
| 28327 Hidden Lake Dr Bonita Springs, FL | 3.0 | 2.0 | 1567 | $8,950 | $5.71 | 23d | 1 | 0.90mi |
| 28567 Clinton Ln Bonita Springs, FL | 3.0 | 3.5 | 2285 | $13,000 | $5.69 | 13d | 1 | 0.91mi |
| 28567 Clinton Ln Bonita Springs, FL | 3.0 | 3.5 | 2285 | $13,000 | $5.69 | 19d | 1 | 0.91mi |
| 975 Tarpon Cove Dr #204 Naples, FL | 3.0 | 2.0 | 1340 | $5,500 | $4.10 | 13d | 1 | 0.93mi |
| 28460 Highgate Dr Bonita Springs, FL | 2.0 | 2.0 | 1871 | $10,500 | $5.61 | 23d | 1 | 0.93mi |
| 945 Carrick Bend Cir #201 Naples, FL | 3.0 | 2.0 | 2360 | $2,995 | $1.27 | 13d | 1 | 0.94mi |
| 14780 Glen Eden Dr Naples, FL | 3.0 | 2.5 | 2184 | $8,000 | $3.66 | 23d | 1 | 0.96mi |
| 817 Carrick Bend Cir #101 Naples, FL | 3.0 | 2.0 | 1660 | $5,995 | $3.61 | 13d | 1 | 0.98mi |
| 784 Carrick Bend Cir #101 Naples, FL | 3.0 | 2.0 | 1515 | $3,500 | $2.31 | 23d | 1 | 0.99mi |
| 9021 Las Maderas Dr #202 Bonita Springs, FL | 2.0 | 2.0 | 1674 | $7,500 | $4.48 | 23d | 1 | 1.01mi |
| 9111 Las Maderas Dr #102 Bonita Springs, FL | 2.0 | 2.0 | 1624 | $7,500 | $4.62 | 23d | 1 | 1.01mi |
| 9030 Las Maderas Dr #101 Bonita Springs, FL | 2.0 | 2.0 | 1432 | $2,500 | $1.75 | 23d | 1 | 1.03mi |
| 9050 Las Maderas Dr #101 Bonita Springs, FL | 2.0 | 2.0 | 1364 | $2,100 | $1.54 | 23d | 1 | 1.06mi |
HOA detail
- Monthly dues
- $527 · $6,324/yr
- Likely covers
- poolsecurity
Listing history 31 events
-
2026-06-03status $495,000 Pending 63 DOM
-
2026-06-02days on market $495,000 Active 63 DOM
-
2026-06-01days on market $495,000 Active 62 DOM
-
2026-05-31days on market $495,000 Active 61 DOM
-
2026-05-30days on market $495,000 Active 60 DOM
-
2026-05-21status Active
-
2026-05-07status Pending With Contingencies
-
2026-03-23status Active
-
2026-03-19status Pending With Contingencies
-
2026-03-13$495,000 Active
-
2025-10-30historical
-
2025-03-05price $575,000
-
2025-02-03price $599,000
-
2025-01-25status Active
-
2025-01-01status Pending
-
2024-12-20price $621,000
-
2024-10-31$652,000 Active
-
2024-07-20historical
-
2024-05-24price $629,000
-
2024-03-08price $649,000
-
2024-02-11price $675,000
-
2024-02-05price $695,000
-
2024-01-24status Active
-
2024-01-23$699,000 Active
-
2024-01-23historical
-
2018-04-28historical
-
2018-04-13price $415,000
-
2018-03-27price $420,000
-
2018-03-19price $425,000
-
2018-03-09$430,000 Active
-
1995-02-22soldstatus $180,300
ⓘ Source: listings_history table (triggers on properties + properties_extension) + one-shot
backfill from property_details.listing_events for pre-trigger history.
Tax reassessment forecast FL · Resets to sale price
- Current annual tax
- $2,034 · $169/mo
- Projected year-2 tax
- $4,108 · $342/mo
- Expected delta
- +$2,075/yr (+$173/mo · 102.0%)
ⓘ Screening estimate from a state-policy table — verify with the county assessor before closing.
Climate risk First Street
- Flood 5/10 Major FEMA zone X (shaded) · 24% chance over 30 yrs
- Wildfire 3/10 Moderate
- Heat 10/10 Extreme 7 d/yr ≥107°F today · 30 d/yr by 30 yrs out
- Wind 10/10 Extreme 99% chance of damaging wind over 30 yrs
- Air quality 2/10 Low 1 unhealthy d/yr today · 1 by 30 yrs out
Nearby sold comps map
Loading sold comps map…
Walkable amenities ~0.75 mi
Loading nearby amenities…
Taxation est. · year 1
- Rental income
- $70,075
- − Mortgage interest
- −$27,728
- − Property taxes
- −$2,034
- − Insurance
- −$2,475
- − Repairs & maintenance
- −$5,606
- − Management
- −$5,606
- − HOA
- −$6,324
- − Depreciation
- −$14,400
- Taxable income
- $5,903
- Est. tax owed @ 24.0%
- −$1,417
- After-tax cash flow
- $11,960/yr
For passive investors: Depreciation is non-cash, so a rental often shows a tax loss while cash-flowing — sheltering income. Rental losses are passive: they offset passive income freely, and up to $25,000/yr can offset ordinary (W-2) income if you actively participate and your MAGI is under $100k (phasing out to $0 by $150k); unused losses carry forward. On sale, claimed depreciation is recaptured at up to 25%, and gains may owe capital-gains tax (a 1031 exchange can defer both). Figures are a year-1 estimate at your 24.0% rate — not tax advice; consult a CPA.
Schools (NCES district)
- District
- Collier
- NCES district ID
- 1200330
- Math proficiency
- 60% ▼ -4.00%
- Reading proficiency
- 56% ▼ -2.00%
- Median HH income
- $58,275
- Composite
- 50.23/100
- National rank
- #1892
- State rank
- #16 of 73 in FL
Livability — Bonita Springs
- Score
- 70/100
- State rank
- #428
- US rank
- #7576
Category grades
Schools grade is shown separately in the Schools card above.
Census & demographics
- County
- Collier County · 396,295 people
- City population
- 64,727
- Metro
- Naples-Marco Island, FL
- Population (ZIP)
- 25,630
- Household income
- $97,564
- Rent vs Own
- Severe rent burden
- 1006.0
Population outlook (Collier County) Hauer SSP2
- Today (2025)
- 420,858 people
- By 2030
- 450,054 · +6.9%
- By 2040
- 502,232 · +19.3%
- By 2050
- 544,932 · +29.5%
- By 2075
- 627,203 · +49.0%
- By 2100
- 659,015 · +56.6%
Race, ethnicity, and origin ACS 2023
- Neighborhood character
- Predominantly White (84%)
- Race & ethnicity
- White 84% Hispanic / Latino 10% Two or more races 9% Asian 2% Black 1%
- Hispanic origin (detail)
- Mexican 2% Puerto Rican 1% Cuban 3%
- Common ancestry
- Romanian 4% Lithuanian 3% Slovak 2%
- Foreign-born
- 11% · Canada, South Korea
- Languages at home
- 87% English-only · Spanish 7% Other Indo-European 3% French/Haitian/Cajun 1%
Political lean MEDSL · Collier
- 2024 margin
- Solid R (+33.1) · D 33.1% · R 66.2%
- 2008→2024 swing
- -10.6pp toward R · 2008: -22.5pp · 2024: -33.1pp
- All cycles
- 2024: R+33.1 2020: R+24.7 2016: R+26.0 2012: R+30.1 2008: R+22.5
Not yet ingested
- Civics
- —
Market trends
- HPI YoY
- ▼ -172.68%
- Current HPI
- 267.4644
- Rent YoY
- ▼ -1.06%
- Metro
- Naples-Marco Island, FL
- State GDP YoY
- ▲ 3.28%
- F500 in state
- 36
Industry mix (Fortune 500 HQ in FL)
| Industry | F500 HQs | Revenue |
|---|---|---|
| Industrial Technology | 2 | $29B |
|
||
| Insurance | 2 | $17B |
|
||
| Retail | 1 | $60B |
|
||
| Technology Distribution | 1 | $58B |
|
||
| Homebuilding | 1 | $35B |
|
||
| Technology Manufacturing | 1 | $35B |
|
||
Price history
+174.5% since first listed26 events — show timeline
- 2026-05-21 Relisted — NAPLESMLS
- 2026-05-07 Pending — NAPLESMLS
- 2026-03-23 Relisted — NAPLESMLS
- 2026-03-19 Pending — NAPLESMLS
- 2026-03-13 Listed $495,000 NAPLESMLS
- 2025-10-30 Listing Removed — NAPLESMLS
- 2025-03-05 Price Changed $575,000 NAPLESMLS
- 2025-02-03 Price Changed $599,000 NAPLESMLS
- 2025-01-25 Relisted — NAPLESMLS
- 2025-01-01 Pending — NAPLESMLS
- 2024-12-20 Price Changed $621,000 NAPLESMLS
- 2024-10-31 Listed $652,000 NAPLESMLS
- 2024-07-20 Listing Removed — NAPLESMLS
- 2024-05-24 Price Changed $629,000 NAPLESMLS
- 2024-03-08 Price Changed $649,000 NAPLESMLS
- 2024-02-11 Price Changed $675,000 NAPLESMLS
- 2024-02-05 Price Changed $695,000 NAPLESMLS
- 2024-01-24 Relisted — NAPLESMLS
- 2024-01-23 Listing Removed — NAPLESMLS
- 2024-01-23 Listed $699,000 NAPLESMLS
- 2018-04-28 Listing Removed — NAPLESMLS
- 2018-04-13 Price Changed $415,000 NAPLESMLS
- 2018-03-27 Price Changed $420,000 NAPLESMLS
- 2018-03-19 Price Changed $425,000 NAPLESMLS
- 2018-03-09 Listed $430,000 NAPLESMLS
- 1995-02-22 Sold (Public Records) $180,300 Public Records
Property tax history
+2.2%/yrLatest (2025): $2,034 · +2.5% YoY. Source: county tax records.
Cash-flow waterfall
monthlySold comps — $/sqft
last 12 mo · ≤1 miLoading sold comps…