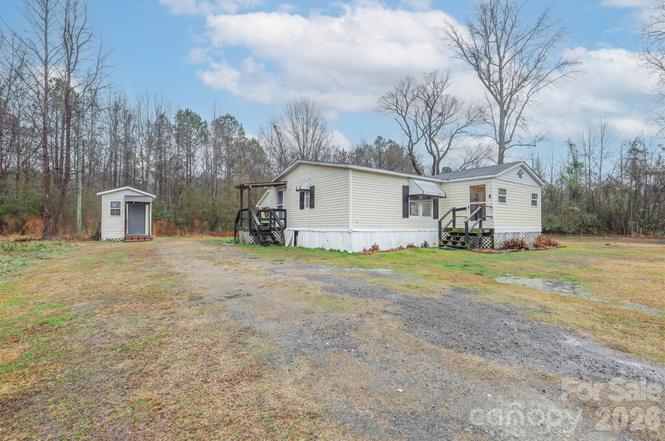
1224 Astoria Rd · Jamesville, NC
Flood risk 1/10 · Minimal
- FEMA flood zone
- X (unshaded)
- Chance of flooding over 30 yrs
- 0.0%
- Est. flood insurance / yr
- $507 – $1,088
Fire risk 4/10 · Minor
- Est. fire insurance / yr
- $906 – $1,684
Heat risk 8/10 · Major
- Hot days now (above 108°F)
- 7 days/yr
- Hot days in 30 yrs
- 16 days/yr
Wind risk 8/10 · Major
- Chance of severe wind over 30 yrs
- 80.0%
Air-quality risk 2/10 · Minimal
- Unhealthy air days now
- 1 days/yr
- Unhealthy air days in 30 yrs
- 1 days/yr
Risk factors via First Street. Map © Google.
Why this score? — see what drove the B grade
The composite is a weighted blend of 9 inputs, each scored 0–100. Each bar is that input's sub-score; the figure is the points it added to the 100-point composite (weight × sub-score).
- Cash flow +29.1/30.0
- DSCR +10.0/10.0
- Appreciation +9.7/10.0
- ARV discount +7.5/15.0
- 1% rule +7.0/10.0
- Livability +2.9/5.0
- Rent growth +2.5/5.0
- Condition / age +2.5/5.0
- Schools +2.4/10.0
$79,900
🖨 Deal sheet 📄 Offer letter ✓ Due diligence
Listing remarks
Sitting on a peaceful lot in Jamesville, NC, this home offers good bones and overall strong potential. With a little bit of TLC, this home can truly shine! Perfect for a buyer looking to add personal touches or an investor searching for a value-add opportunity, this property presents an affordable entry point into homeownership or your next project. With the right updates, this home can easily be transformed into a comfortable residence or a profitable investment — don’t miss out on this great value.
Key facts
- 1 acre lot
- Parking
- Built 1997
Property features AI
Finance
- HOA & community: No HOA
Exterior
- Parking: Detached carport (1 space)
- Utilities: Public water; Public sewer
- Home design: Single-family manufactured singlewide residence; Site-built construction; One story; Crawl space foundation
- Construction: Aluminum and vinyl exterior materials
- Exterior features: Publicly maintained road access; Road surface: Other
Interior
- Kitchen: Other appliances
- Bedrooms: 3 bedrooms on the main level
- Bathrooms: 2 full bathrooms (main level)
- Heating & cooling: Electric heating; Window unit(s) for cooling
- Interior features: One-level living; Room count: 1
- Laundry & utility: Washer hookup
Neighborhood map
What this means for you Summary
Snapshot
- This is a 3-bed/2.0-bath manufactured listed at $80k.
Deal economics
- At list price, monthly cash flow is $277 ($3k/yr) — positive.
- The deal already cash-flows at list — no discount required.
- Meets the 1% rule at list price ($961 rent vs $80k).
- Recommended offer: $70k (12.0% below list) — sets the bar for market timing.
Location & tenants
- Location reads 58/100 on livability (#573 in NC) — a working-class tenant base; expect higher turnover. Strengths: cost of living A+, housing A-; Watch: health & safety C-, crime F, amenities F.
- Martin County Schools (rural): math 24% / reading 34% proficiency, ranked #150 of 178 in NC (top 84%) — low school quality limits family demand, transient renter base, plan for 1-2y turnover; 62% free/reduced lunch — lower-income household profile, screen leases tightly.
- Zoned schools: Riverside High (math 22% / reading 37%, grade F, #459 of 535 statewide, top 87%, 447 students, 99% FRL) — zoned schools average 99% FRL vs 62% district-wide (37 pts higher); higher-poverty schools than district average — tighter screening recommended.
- Market conditions: 6 active listings in the ZIP.
Forward outlook
- In year one you build about $8k of equity ($552 loan paydown + $8k appreciation (9.5% local appreciation)).
- Martin County population projected at -33% by 2050 — secular population decline; favor cash flow + early exit over multi-decade hold.
- At projected returns (9.5% appreciation + 3.0% rent growth), your $22k cash investment doubles in ~2 years — after that, you're playing with house money.
- By year 5, paydown + projected appreciation supports a ~$38k cash-out refi (75% LTV) — recoverable capital for the next deal without selling this one.
Negotiation context
- It's been on market 142 days — a 12% lower offer ($70k) is reasonable based on typical stale-listing flexibility.
- 4 sale attempts since 12y ago; this cycle's ask has dropped $10k (11%) from the opening price — seller is motivated, your offer sets the floor, not the list.
Risks & watch-outs
- Climate carrying-cost: severe wind risk, 80% chance of damaging wind over 30y; extreme-heat days projected 7→16/yr by 2055 (HVAC capex compounding) — expect insurance premiums to compound above CPI over the hold.
Questions for the listing agent
- It's been on market 142 days. Have you received any prior offers? Is the seller open to a 12% concession, seller financing, or rate buy-down credit?
- Why hasn't it sold? Are there any deal-killer items the seller is aware of (foundation, flood, title, zoning, code violations)?
- Is there a deadline driving the sale (1031 exchange, divorce, estate, relocation)? That informs how much negotiation room exists.
- Crime grade is F in this area — have there been break-ins, vandalism, or insurance claims at this property in the last 3 years? What carrier currently insures it and at what premium?
- What's the average days-on-market for RENTAL listings here right now (not sales)? A rising rental-DOM trend means longer vacancies and softer asking-rent achievability than the comps imply.
- What's the recent tenant-quality profile in this submarket — average credit score on applications, eviction rate, late-payment / NSF rate, and stable-employment percentage? A property-management company in the area should have these aggregated.
- How much new for-sale + rental construction is in the pipeline within 1–3 miles? Heavy new supply typically softens prices + rents 12–24 months out; constrained supply supports both.
Investment metrics
- 1% rule
- 1.20% ✓
- Cap rate
- 10.45%
- Cash-on-cash
- 14.84%
- DSCR
- 1.66
- GRM
- 6.9
CMA / ARV
No comps found within radius.
Projected returns pro-forma
9.48% appreciation · 3.0% rent growth · sell at horizon
- IRR
- 34.3%
- Equity multiple
- 3.60×
- Total profit
- $58,258
- Equity at exit
- $68,946
- IRR
- 29.8%
- Equity multiple
- 8.02×
- Total profit
- $156,965
- Equity at exit
- $145,569
Cash invested: $22,372 (down + closing). Projections, not guarantees.
Landlord ↔ Tenant lean methodology
- Overall (STATE)
- 85 Strongly Landlord-Friendly
- State North Carolina
- 85 Strongly Landlord-Friendly · R+3
- County
- — inherits STATE
- City
- — inherits STATE
ZIP-level market 27846
- Home prices YoY
- 6.5%
- Active inventory
- 6
- Price-to-rent
- 6.9×
Monthly cashflow live
- Estimated rent
- $961 medium interval (Pro) →
- Mortgage (P&I)
- −$419
- Tax from tax record
- −$30 /mo · $360/yr
- Insurance
- −$33
- HOA
- −$0
- Vacancy / Maint / Mgmt
- −$202
- Net cashflow
- $277
Break-even live
UW: 25.0% down · 7.5% · 30yr · 1.5% tax · 5.0% vac · 8.0% maint · 8.0% mgmt
Financing live
Cash to close
- Down payment
- $19,975
- Closing costs
- $2,397
- Reserves months
- —
- Total cash needed
- —
Loan-product check · same deal, 3 products live
Conventional
25% down · 7.5% · 30yr
- Down + closing
- —
- Monthly P&I
- —
- Monthly cashflow
- —
- DSCR
- —
- Eligible?
- —
Personal DTI + credit; lowest rate.
DSCR
20% down · 8.5% · 30yr
- Down + closing
- —
- Monthly P&I
- —
- Monthly cashflow
- —
- DSCR
- —
- Eligible?
- —
No personal income docs; deal must DSCR.
Hard money
10% down · 12.0% · 12mo
- Down + closing
- —
- Monthly P&I
- —
- Monthly cashflow
- —
- DSCR
- —
- Eligible?
- —
Short-term bridge; refi at stabilization.
Listing history 22 events
-
2026-06-19days on market $79,900 Active 142 DOM
-
2026-06-18days on market $79,900 Active 141 DOM
-
2026-06-17days on market $79,900 Active 140 DOM
-
2026-06-16days on market $79,900 Active 139 DOM
-
2026-06-15days on market $79,900 Active 138 DOM
-
2026-06-14days on market $79,900 Active 136 DOM
-
2026-06-12days on market $79,900 Active 135 DOM
-
2026-06-09days on market $79,900 Active 132 DOM
-
2026-06-08days on market $79,900 Active 131 DOM
-
2026-06-07days on market $79,900 Active 130 DOM
-
2026-06-03days on market $79,900 Active 126 DOM
-
2026-06-02days on market $79,900 Active 125 DOM
-
2026-06-01days on market $79,900 Active 124 DOM
-
2026-05-31days on market $79,900 Active 123 DOM
-
2026-05-30days on market $79,900 Active 122 DOM
-
2026-05-18status Active
-
2026-03-30status Active
-
2026-03-02price $79,900
-
2026-02-25price $84,900
-
2026-01-24$89,900 Active
-
2016-11-30historical
-
2014-09-29$69,900
ⓘ Source: listings_history table (triggers on properties + properties_extension) + one-shot
backfill from property_details.listing_events for pre-trigger history.
Tax reassessment forecast NC · Resets to sale price
- Current annual tax
- $360 · $30/mo
- Projected year-2 tax
- $655 · $55/mo
- Expected delta
- +$296/yr (+$25/mo · 82.2%)
ⓘ Screening estimate from a state-policy table — verify with the county assessor before closing.
Climate risk First Street
- Flood 1/10 Low FEMA zone X (unshaded) · 0% chance over 30 yrs
- Wildfire 4/10 Moderate
- Heat 8/10 Severe 7 d/yr ≥108°F today · 16 d/yr by 30 yrs out
- Wind 8/10 Severe 80% chance of damaging wind over 30 yrs
- Air quality 2/10 Low 1 unhealthy d/yr today · 1 by 30 yrs out
Nearby sold comps map
Loading sold comps map…
Walkable amenities ~0.75 mi
Loading nearby amenities…
Taxation est. · year 1
- Rental income
- $11,529
- − Mortgage interest
- −$4,476
- − Property taxes
- −$360
- − Insurance
- −$400
- − Repairs & maintenance
- −$922
- − Management
- −$922
- − Depreciation
- −$2,324
- Taxable income
- $2,125
- Est. tax owed @ 24.0%
- −$510
- After-tax cash flow
- $2,810/yr
For passive investors: Depreciation is non-cash, so a rental often shows a tax loss while cash-flowing — sheltering income. Rental losses are passive: they offset passive income freely, and up to $25,000/yr can offset ordinary (W-2) income if you actively participate and your MAGI is under $100k (phasing out to $0 by $150k); unused losses carry forward. On sale, claimed depreciation is recaptured at up to 25%, and gains may owe capital-gains tax (a 1031 exchange can defer both). Figures are a year-1 estimate at your 24.0% rate — not tax advice; consult a CPA.
Schools (NCES district)
- District
- Martin County Schools
- NCES district ID
- 3702880
- Math proficiency
- 24% ▼ -2.00%
- Reading proficiency
- 34% ▲ 1.00%
- Median HH income
- $35,403
- Composite
- 23.94/100
- National rank
- #7781
- State rank
- #150 of 178 in NC
Livability — Jamesville
- Score
- 58/100
- State rank
- #573
- US rank
- #21170
Category grades
Schools grade is shown separately in the Schools card above.
Census & demographics
- Census place
- Jamesville, NC
- Population (ZIP)
- 2,689
Population outlook (Martin County) Hauer SSP2
- Today (2025)
- 21,018 people
- By 2030
- 19,693 · -6.3%
- By 2040
- 16,793 · -20.1%
- By 2050
- 14,171 · -32.6%
- By 2075
- 9,804 · -53.4%
- By 2100
- 6,894 · -67.2%
Race, ethnicity, and origin ACS 2023
- Neighborhood character
- Predominantly White (73%)
- Race & ethnicity
- White 73% Black 23% Two or more races 3% Hispanic / Latino 2%
- Common ancestry
- Slovak 1% German 1% Italian 1%
- Foreign-born
- 0%
Political lean MEDSL · Martin
- 2024 margin
- R (+10.3) · D 44.6% · R 54.9%
- 2008→2024 swing
- -15.0pp toward R · 2008: 4.6pp · 2024: -10.3pp
- All cycles
- 2024: R+10.3 2020: R+5.0 2016: R+0.5 2012: D+4.4 2008: D+4.6
Not yet ingested
- Civics
- —
Market trends
- HPI YoY
- ▲ 9.48%
- Current HPI
- 155.5151
- Rent YoY
- —
- Metro
- —
- State GDP YoY
- ▲ 3.28%
- F500 in state
- 26
Industry mix (Fortune 500 HQ in NC)
| Industry | F500 HQs | Revenue |
|---|---|---|
| Financial Services | 2 | $213B |
|
||
| Retail | 2 | $95B |
|
||
| Industrial Conglomerate | 1 | $38B |
|
||
| Metals / Steel | 1 | $35B |
|
||
| Utilities | 1 | $30B |
|
||
| Industrial Machinery | 1 | $19B |
|
||
Price history
+14.3% since first listed7 events — show timeline
- 2026-05-18 Relisted — CANOPYMLS as Distributed by MLS Grid
- 2026-03-30 Relisted — CANOPYMLS as Distributed by MLS Grid
- 2026-03-02 Price Changed $79,900 CANOPYMLS as Distributed by MLS Grid
- 2026-02-25 Price Changed $84,900 CANOPYMLS as Distributed by MLS Grid
- 2026-01-24 Listed $89,900 CANOPYMLS as Distributed by MLS Grid
- 2016-11-30 Listing Removed — Hive MLS
- 2014-09-29 Listed $69,900 Hive MLS
Property tax history
-1.1%/yrLatest (2025): $360 · -9.3% YoY. Source: county tax records.
Cash-flow waterfall
monthlySold comps — $/sqft
last 12 mo · ≤1 miLoading sold comps…