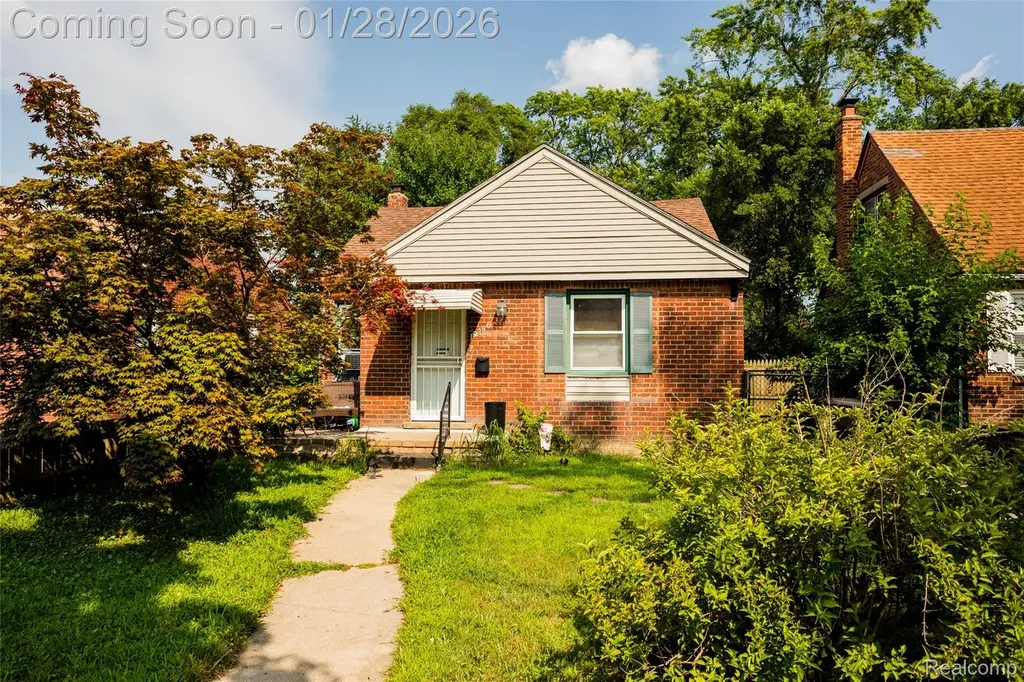
19786 Pennington Dr · Detroit, MI
Flood risk 1/10 · Minimal
- FEMA flood zone
- X (unshaded)
- Chance of flooding over 30 yrs
- 0.0%
- Est. flood insurance / yr
- $473 – $860
Fire risk 1/10 · Minimal
- Est. fire insurance / yr
- $784 – $1,456
Heat risk 3/10 · Minor
- Hot days now (above 97°F)
- 7 days/yr
- Hot days in 30 yrs
- 14 days/yr
Wind risk 2/10 · Minimal
- Chance of severe wind over 30 yrs
- —
Air-quality risk 4/10 · Minor
- Unhealthy air days now
- 4 days/yr
- Unhealthy air days in 30 yrs
- 6 days/yr
Risk factors via First Street. Map © Google.
Why this score? — see what drove the C grade
The composite is a weighted blend of 9 inputs, each scored 0–100. Each bar is that input's sub-score; the figure is the points it added to the 100-point composite (weight × sub-score).
- Cash flow +29.6/30.0
- DSCR +10.0/10.0
- 1% rule +9.0/10.0
- Livability +3.7/5.0
- Rent growth +3.4/5.0
- Condition / age +2.5/5.0
- Schools +1.3/10.0
- ARV discount +0.0/15.0
- Appreciation +0.0/10.0
$99,000
🖨 Deal sheet (PDF) 📄 Offer letter ✓ Due diligence
Listing remarks MLS
Adjacent to the popular Bagley neighborhood, this inviting two-bedroom/one-bathroom home with wood floors is a proven cash-flowing asset with tenants in place. Residents of 19786 Pennington live walking distance to the Livernois Avenue of Fashion district with popular shops, nightlife and grocery shopping. This thoroughfare also provides convenient access to freeways and countless amenities in nearby Ferndale.
Key facts
- 5,227 sq ft lot
- Built 1943
- Listed 144 days
Neighborhood map
What this means for you Summary
Snapshot
- This is a 2-bed/1.0-bath single-family listed at $99k.
Deal economics
- At list price, monthly cash flow is $357 ($4k/yr) — positive.
- The deal already cash-flows at list — no discount required.
- Meets the 1% rule at list price ($1k rent vs $99k).
- Recommended offer: $87k (12.0% below list) — sets the bar for market timing.
Location & tenants
- Location reads 73/100 on livability (#218 in MI) — a middle-class / working-renter tenant base. Strengths: amenities A+, commute A+, cost of living A+; Watch: schools F, crime F, employment F.
- Detroit Public Schools Community District (urban): math 10% / reading 24% proficiency, ranked #499 of 540 in MI (top 92%) — low school quality limits family demand, transient renter base, plan for 1-2y turnover; 90% free/reduced lunch — lower-income household profile, screen leases tightly.
- Market conditions: Rents rising (+3.4%/yr); 349 active listings in the ZIP; 39 comparable units currently listed for rent nearby; rentals at typical pace (median 26d on market — plan ~3-4 weeks tenant-placement turnaround); 2,639 units permitted in Wayne County in 2024 (1,216 in 5+ unit buildings).
Forward outlook
- Local home prices are declining (-3.0%/yr); year-one equity from $684 of loan paydown is wiped out by about $3k of value loss. Plan a longer hold.
- Wayne County population projected at -17% by 2050 — secular population decline; favor cash flow + early exit over multi-decade hold.
- At projected returns (-3.0% appreciation + 3.4% rent growth), your $28k cash investment doubles in ~8 years — after that, you're playing with house money.
Negotiation context
- It's been on market 145 days — a 12% lower offer ($87k) is reasonable based on typical stale-listing flexibility.
- 15 sale attempts since 8y ago with the ask held roughly flat each time — persistent listings suggest the price (not the market) is what's stuck; bring a comps-based counter.
- Current owner paid $34k; list at $99k implies a 191% gain — meaningful room to come down on a strong offer.
Risks & watch-outs
- Watch-outs: built in 1943 — expect roof / HVAC / electrical / plumbing capex.
Questions for the listing agent
- It's been on market 145 days. Have you received any prior offers? Is the seller open to a 12% concession, seller financing, or rate buy-down credit?
- Built in 1943 — when were the roof, HVAC, electrical panel, plumbing, and water heater last replaced?
- Why hasn't it sold? Are there any deal-killer items the seller is aware of (foundation, flood, title, zoning, code violations)?
- Is there a deadline driving the sale (1031 exchange, divorce, estate, relocation)? That informs how much negotiation room exists.
- Schools are F-rated, which usually means shorter tenancies and higher turnover. Who's the typical renter profile here, and what's been the actual vacancy rate?
- Crime grade is F in this area — have there been break-ins, vandalism, or insurance claims at this property in the last 3 years? What carrier currently insures it and at what premium?
- What's the average days-on-market for RENTAL listings here right now (not sales)? A rising rental-DOM trend means longer vacancies and softer asking-rent achievability than the comps imply.
- What's the recent tenant-quality profile in this submarket — average credit score on applications, eviction rate, late-payment / NSF rate, and stable-employment percentage? A property-management company in the area should have these aggregated.
- How much new for-sale + rental construction is in the pipeline within 1–3 miles? Heavy new supply typically softens prices + rents 12–24 months out; constrained supply supports both.
Investment metrics
- 1% rule
- 1.40% ✓
- Cap rate
- 10.63%
- Cash-on-cash
- 15.47%
- DSCR
- 1.69
- GRM
- 5.9
CMA / ARV
- ARV (median comp)
- $84,773
- List price
- $99,000
- Delta
- 16.78%
- Verdict
- OVERPRICED
- Comps
- 20 within 1.0 mi
Show comp detail 12 sales within ~0.75 mi
| Address | Dist | Beds/Ba | Sqft | Sold | Price | $/sf | Match |
|---|---|---|---|---|---|---|---|
| 19800 Woodingham Dr | 0.13mi | 2/1.0 | 780 (+2%) | 10mo | $67,500 | $87 | 82 |
| 19788 San Juan Dr | 0.06mi | 2/1.0 | 795 (+4%) | 13mo | $29,900 | $38 | 80 |
| 19817 Monica St | 0.15mi | 2/1.0 | 790 (+3%) | 13mo | $41,000 | $52 | 76 |
| 19486 Santa Barbara Dr | 0.13mi | 2/1.0 | 796 (+4%) | 14mo | $115,000 | $144 | 76 |
| 19928 Santa Barbara Dr | 0.08mi | 3/1.0 (+1) | 865 (+13%) | 1mo | $90,000 | $104 | 68 |
| 19434 San Juan Dr | 0.17mi | 2/1.0 | 838 (+10%) | 13mo | $29,900 | $36 | 65 |
| 20233 Roselawn St | 0.44mi | 2/1.0 | 829 (+8%) | 2mo | $33,000 | $40 | 64 |
| 1370 Bertha St | 0.62mi | 2/1.0 | 707 (-8%) | 1mo | $120,000 | $170 | 57 |
| 20200 Roselawn St | 0.40mi | 3/1.0 (+1) | 840 (+10%) | 9mo | $92,000 | $110 | 52 |
| 1410 Bertha St | 0.62mi | 2/1.0 | 667 (-13%) | 9mo | $112,500 | $169 | 43 |
| 19439 Wyoming Ave | 0.71mi | 2/1.0 | 870 (+14%) | 6mo | $65,000 | $75 | 40 |
| 228 Kensington Ave | 0.66mi | 2/1.0 | 873 (+14%) | 8mo | $185,000 | $212 | 39 |
Match score weights: distance 35% · size 25% · config 20% · recency 20%. Top-matched comps best support the ARV.
Projected returns pro-forma
-3.0% appreciation · 3.44% rent growth · sell at horizon
- IRR
- 6.8%
- Equity multiple
- 1.27×
- Total profit
- $7,395
- Equity at exit
- $14,761
- IRR
- 16.6%
- Equity multiple
- 2.39×
- Total profit
- $38,527
- Equity at exit
- $8,560
Cash invested: $27,720 (down + closing). Projections, not guarantees.
Landlord ↔ Tenant lean methodology
- Overall (STATE)
- 62 Landlord-Friendly
- State Michigan
- 62 Landlord-Friendly · EVEN
- County
- — inherits STATE
- City
- — inherits STATE
ZIP-level market 48221
- Rents YoY
- 3.4%
- Active inventory
- 349
- Price-to-rent
- 5.9×
Monthly cashflow live
- Estimated rent
- $1,387 high interval (Pro) →
- Mortgage (P&I)
- −$519
- Tax from tax record
- −$178 /mo · $2,134/yr
- Insurance
- −$41
- HOA
- −$0
- Vacancy / Maint / Mgmt
- −$291
- Net cashflow
- $357
Break-even live
Sensitivity live
| Price | -10% $413 | -5% $385 | +0% $357 | +5% $329 | +10% $301 |
|---|---|---|---|---|---|
| Rent | -10% $248 | -5% $303 | +0% $357 | +5% $412 | +10% $467 |
| Rate | -1.0pp $407 | -0.5pp $383 | base $357 | +0.5pp $332 | +1.0pp $306 |
UW: 25.0% down · 7.5% · 30yr · 1.5% tax · 5.0% vac · 8.0% maint · 8.0% mgmt
Financing live
Cash to close
- Down payment
- $24,750
- Closing costs
- $2,970
- Reserves months
- —
- Total cash needed
- —
Loan-product check · same deal, 3 products live
Conventional
25% down · 7.5% · 30yr
- Down + closing
- —
- Monthly P&I
- —
- Monthly cashflow
- —
- DSCR
- —
- Eligible?
- —
Personal DTI + credit; lowest rate.
DSCR
20% down · 8.5% · 30yr
- Down + closing
- —
- Monthly P&I
- —
- Monthly cashflow
- —
- DSCR
- —
- Eligible?
- —
No personal income docs; deal must DSCR.
Hard money
10% down · 12.0% · 12mo
- Down + closing
- —
- Monthly P&I
- —
- Monthly cashflow
- —
- DSCR
- —
- Eligible?
- —
Short-term bridge; refi at stabilization.
Rent comps 39 comps
| Address | Beds | Baths | Sqft | Rent | $/sqft | DOM | Units | Dist |
|---|---|---|---|---|---|---|---|---|
| 20038 Santa Rosa Dr Detroit, MI | 3.0 | 1.0 | 927 | $1,300 | $1.40 | 19d | 1 | 0.29mi |
| 20045 Greenlawn St Detroit, MI | 3.0 | 1.0 | 925 | $1,350 | $1.46 | 45d | 1 | 0.30mi |
| 20110 Northlawn St Detroit, MI | 3.0 | 1.0 | 1100 | $1,350 | $1.23 | 19d | 1 | 0.40mi |
| 20009 Wisconsin St Detroit, MI | 3.0 | 1.5 | 1051 | $1,400 | $1.33 | 19d | 1 | 0.55mi |
| 19031 Livernois Unit F Detroit, MI | 2.0 | 2.0 | 1100 | $2,135 | $1.94 | 45d | 1 | 0.57mi |
| 20129 Stratford Rd Unit 2 Detroit, MI | 2.0 | 1.0 | 1100 | $1,223 | $1.11 | 26d | 1 | 0.64mi |
| 20185 Indiana St Detroit, MI | 2.0 | 1.5 | 1096 | $1,275 | $1.16 | 45d | 1 | 0.65mi |
| 20458 Indiana St Detroit, MI | 3.0 | 1.0 | 1049 | $1,300 | $1.24 | 19d | 1 | 0.71mi |
| 20445 Kentucky St Detroit, MI | 3.0 | 1.0 | 1046 | $1,200 | $1.15 | 26d | 1 | 0.76mi |
| 20643 Stratford Rd Unit 1 Detroit, MI | 2.0 | 1.5 | 1000 | $1,250 | $1.25 | 45d | 1 | 0.79mi |
| 510 Stratford Rd Ferndale, MI | 2.0 | 1.0 | 965 | $1,750 | $1.81 | 45d | 1 | 0.83mi |
| 578 Kensington Ave Ferndale, MI | 2.0 | 1.0 | 860 | $1,600 | $1.86 | 6d | 1 | 0.88mi |
| 20515 Ilene St Detroit, MI | 3.0 | 1.0 | 891 | $1,450 | $1.63 | 45d | 1 | 0.94mi |
| 20460 Griggs St Detroit, MI | 2.0 | 1.0 | 910 | $1,100 | $1.21 | 19d | 1 | 0.94mi |
| 695 Livernois St Unit 2 Ferndale, MI | 2.0 | 1.0 | 950 | $2,350 | $2.47 | 6d | 1 | 1.00mi |
| 695 Livernois St Unit 3 Ferndale, MI | 1.0 | 1.0 | 830 | $2,150 | $2.59 | 14d | 1 | 1.00mi |
| 18461 Washburn St Detroit, MI | 1.0 | 1.0 | 690 | $775 | $1.12 | 45d | 1 | 1.06mi |
| 20032 Monte Vista St Detroit, MI | 3.0 | 1.0 | 1000 | $1,294 | $1.29 | 22d | 1 | 1.07mi |
| 19929 Monte Vista St Detroit, MI | 3.0 | 1.0 | 860 | $1,450 | $1.69 | 19d | 1 | 1.08mi |
| 20122 Manor St Detroit, MI | 3.0 | 1.0 | 1028 | $1,200 | $1.17 | 45d | 1 | 1.13mi |
| 353 W Webster St Ferndale, MI | 2.0 | 1.0 | 900 | $1,525 | $1.69 | 18d | 1 | 1.14mi |
| 20429 Monte Vista St Detroit, MI | 3.0 | 1.0 | 872 | $1,300 | $1.49 | 19d | 1 | 1.15mi |
| 17551 Santa Rosa Dr Detroit, MI | 2.0 | 1.0 | 1036 | $1,095 | $1.06 | 45d | 1 | 1.16mi |
| 851 Gardendale St Ferndale, MI | 2.0 | 1.0 | 933 | $1,625 | $1.74 | 26d | 1 | 1.16mi |
| 20245 Manor Detroit, MI | 3.0 | 1.0 | 1018 | $1,400 | $1.38 | 4d | 1 | 1.19mi |
| 21374 Ithaca Ave Ferndale, MI | 3.0 | 1.0 | 996 | $1,775 | $1.78 | 26d | 1 | 1.21mi |
| 900 Laprairie St Ferndale, MI | 1.0 | 1.0 | 700 | $1,015 | $1.45 | 45d | 1 | 1.27mi |
| 226 Fielding St Ferndale, MI | 2.0 | 1.0 | 1000 | $1,500 | $1.50 | 26d | 1 | 1.28mi |
| 224 Fielding St Ferndale, MI | 2.0 | 1.0 | 1000 | $1,800 | $1.80 | 26d | 1 | 1.29mi |
| 901 Saint Louis St Unit 901-02 Ferndale, MI | 2.0 | 1.0 | 800 | $1,395 | $1.74 | 26d | 1 | 1.31mi |
| 901 Saint Louis St Ferndale, MI | 2.0 | 1.0 | 800 | $1,395 | $1.74 | 45d | 1 | 1.31mi |
| 18675 Meyers Rd Unit 18677 Detroit, MI | 2.0 | 1.0 | 942 | $1,100 | $1.17 | 45d | 1 | 1.33mi |
| 17215 Warrington Dr Detroit, MI | 2.0 | 1.0 | 1015 | $2,000 | $1.97 | 45d | 1 | 1.38mi |
| 17147 Monica St Unit 2 1 Detroit, MI | 2.0 | 1.0 | 900 | $975 | $1.08 | 26d | 1 | 1.40mi |
| 17150 Santa Rosa Dr Detroit, MI | 1.0 | 1.0 | 950 | $1,250 | $1.32 | 19d | 1 | 1.41mi |
| 17145 Santa Rosa Dr Unit 1 Detroit, MI | 3.0 | 1.0 | 1050 | $1,400 | $1.33 | 19d | 1 | 1.41mi |
| 17159 Northlawn St Unit 17161 Detroit, MI | 2.0 | 1.0 | 1122 | $975 | $0.87 | 6d | 1 | 1.42mi |
| 22111 Woodward Ave Ferndale, MI | 2.0 | 1.0 | 816 | $3,355 | $4.11 | 18d | 1 | 1.46mi |
| 1291 W State Fair Ave Detroit, MI | 1.0–2.0 | 1.0 | 700 | $950 | $1.36 | 14d | 2 | 1.49mi |
Listing history 50 events
-
2026-06-21days on market $99,000 Active 145 DOM
-
2026-06-18days on market $99,000 Active 142 DOM
-
2026-06-17days on market $99,000 Active 141 DOM
-
2026-06-15days on market $99,000 Active 139 DOM
-
2026-06-13days on market $99,000 Active 137 DOM
-
2026-06-13days on market $99,000 Active 136 DOM
-
2026-06-09days on market $99,000 Active 133 DOM
-
2026-06-08days on market $99,000 Active 132 DOM
-
2026-06-07days on market $99,000 Active 131 DOM
-
2026-06-04days on market $99,000 Active 128 DOM
-
2026-06-03days on market $99,000 Active 127 DOM
-
2026-06-01days on market $99,000 Active 125 DOM
-
2026-05-31days on market $99,000 Active 124 DOM
-
2026-01-28$99,000 Active 413-char remark
Show marketing remark (413 chars)
Adjacent to the popular Bagley neighborhood, this inviting two-bedroom/one-bathroom home with wood floors is a proven cash-flowing asset with tenants in place. Residents of 19786 Pennington live walking distance to the Livernois Avenue of Fashion district with popular shops, nightlife and grocery shopping. This thoroughfare also provides convenient access to freeways and countless amenities in nearby Ferndale.
-
2026-01-26historical $99,000 413-char remark
Show marketing remark (413 chars)
Adjacent to the popular Bagley neighborhood, this inviting two-bedroom/one-bathroom home with wood floors is a proven cash-flowing asset with tenants in place. Residents of 19786 Pennington live walking distance to the Livernois Avenue of Fashion district with popular shops, nightlife and grocery shopping. This thoroughfare also provides convenient access to freeways and countless amenities in nearby Ferndale.
-
2026-01-01historical
-
2026-01-01historical
-
2025-10-16price $99,000
-
2025-10-16price $99,000
-
2025-09-23price $99,900
-
2025-09-22price $99,900
-
2025-08-27$119,900 Active
-
2025-08-27$119,900 Active
-
2025-02-05historical
-
2025-02-04historical
-
2024-11-21$125,000 Active
-
2024-11-21$125,000 Active
-
2019-01-30soldstatus $34,000 Sold
-
2019-01-30soldstatus $34,000 Closed
-
2019-01-07status Pending
-
2019-01-07status Pending
-
2018-12-11$44,900 Active
-
2018-12-11$44,900 Active
-
2018-11-05historical
-
2018-11-05historical
-
2018-10-20price $45,000
-
2018-10-19status Active
-
2018-10-18price $45,000
-
2018-10-18status Active
-
2018-08-18status Pending
-
2018-08-18status Pending
-
2018-07-13status Active
-
2018-07-12historical
-
2018-06-05$42,000 Active
-
2018-06-05$42,000 Active
-
2018-06-01historical
-
2018-06-01historical
-
2018-05-24price $44,000
-
2018-05-24price $44,000
ⓘ Source: listings_history table (triggers on properties + properties_extension) + one-shot
backfill from property_details.listing_events for pre-trigger history.
Tax reassessment forecast MI · Partial reset (capped growth)
- Current annual tax
- $2,134 · $178/mo
- Projected year-2 tax
- $2,134 · $178/mo
- Expected delta
- $0/yr ($0/mo · 0.0%)
ⓘ Screening estimate from a state-policy table — verify with the county assessor before closing.
Climate risk First Street
- Flood 1/10 Low FEMA zone X (unshaded) · 0% chance over 30 yrs
- Wildfire 1/10 Low
- Heat 3/10 Moderate 7 d/yr ≥97°F today · 14 d/yr by 30 yrs out
- Wind 2/10 Low
- Air quality 4/10 Moderate 4 unhealthy d/yr today · 6 by 30 yrs out
Nearby sold comps map
Loading sold comps map…
Walkable amenities ~0.75 mi
Loading nearby amenities…
Taxation est. · year 1
- Rental income
- $16,644
- − Mortgage interest
- −$5,546
- − Property taxes
- −$2,134
- − Insurance
- −$495
- − Repairs & maintenance
- −$1,331
- − Management
- −$1,331
- − Depreciation
- −$2,880
- Taxable income
- $2,926
- Est. tax owed @ 24.0%
- −$702
- After-tax cash flow
- $3,587/yr
For passive investors: Depreciation is non-cash, so a rental often shows a tax loss while cash-flowing — sheltering income. Rental losses are passive: they offset passive income freely, and up to $25,000/yr can offset ordinary (W-2) income if you actively participate and your MAGI is under $100k (phasing out to $0 by $150k); unused losses carry forward. On sale, claimed depreciation is recaptured at up to 25%, and gains may owe capital-gains tax (a 1031 exchange can defer both). Figures are a year-1 estimate at your 24.0% rate — not tax advice; consult a CPA.
Schools (NCES district)
- District
- Detroit Public Schools Community District
- NCES district ID
- 2601103
- Math proficiency
- 10% ▼ -2.00%
- Reading proficiency
- 24% ▲ 6.00%
- Median HH income
- $25,815
- Composite
- 13.06/100
- National rank
- #9564
- State rank
- #499 of 540 in MI
Livability — Detroit
- Score
- 73/100
- State rank
- #218
- US rank
- #5427
Category grades
Schools grade is shown separately in the Schools card above.
Census & demographics
- Census place
- Detroit, MI
- County
- Wayne County · 1,562,939 people
- City population
- 572,865
- Metro
- Detroit-Warren-Dearborn, MI
- Population (ZIP)
- 41,392
- Household income
- $57,878
- Rent vs Own
- Severe rent burden
- 1646.0
Population outlook (Wayne County) Hauer SSP2
- Today (2025)
- 1,675,273 people
- By 2030
- 1,620,300 · -3.3%
- By 2040
- 1,502,341 · -10.3%
- By 2050
- 1,384,039 · -17.4%
- By 2075
- 1,124,592 · -32.9%
- By 2100
- 881,193 · -47.4%
Race, ethnicity, and origin ACS 2023
- Neighborhood character
- Predominantly Black (85%)
- Race & ethnicity
- Black 85% White 8% Two or more races 4% Asian 1%
- Common ancestry
- Romanian 1% Lithuanian 1%
- Foreign-born
- 2% · Canada
- Languages at home
- 97% English-only · Spanish 1% Other Indo-European 1%
Political lean MEDSL · Wayne
- 2024 margin
- Strong D (+29.0) · D 62.7% · R 33.7% · Other 3.6%
- 2008→2024 swing
- -20.5pp toward R · 2008: 49.5pp · 2024: 29.0pp
- All cycles
- 2024: D+29.0 2020: D+38.1 2016: D+37.3 2012: D+46.9 2008: D+49.5
Not yet ingested
- Civics
- —
Market trends
- HPI YoY
- ▼ -433.14%
- Current HPI
- 280.5434
- Rent YoY
- ▲ 3.44%
- Metro
- Detroit-Warren-Dearborn, MI
- State GDP YoY
- ▲ 1.37%
- F500 in state
- 28
Industry mix (Fortune 500 HQ in MI)
| Industry | F500 HQs | Revenue |
|---|---|---|
| Automotive Parts | 3 | $48B |
|
||
| Automotive | 2 | $372B |
|
||
| Chemicals | 1 | $45B |
|
||
| Automotive Retail | 1 | $29B |
|
||
| Healthcare / Medical Devices | 1 | $23B |
|
||
| Automotive Technology | 1 | $20B |
|
||
Price history
+83.3% since first listed39 events — show timeline
- 2026-01-28 Listed $99,000 MiRealSource-MiMLS
- 2026-01-28 Listed $99,000 REALCOMP
- 2026-01-26 Coming Soon $99,000 MiRealSource-MiMLS
- 2026-01-01 Listing Removed — MiRealSource-MiMLS
- 2026-01-01 Listing Removed — REALCOMP
- 2025-10-16 Price Changed $99,000 MiRealSource-MiMLS
- 2025-10-16 Price Changed $99,000 REALCOMP
- 2025-09-23 Price Changed $99,900 MiRealSource-MiMLS
- 2025-09-22 Price Changed $99,900 REALCOMP
- 2025-08-27 Listed $119,900 REALCOMP
- 2025-08-27 Listed $119,900 MiRealSource-MiMLS
- 2025-02-05 Listing Removed — REALCOMP
- 2025-02-04 Listing Removed — MiRealSource-MiMLS
- 2024-11-21 Listed $125,000 MiRealSource-MiMLS
- 2024-11-21 Listed $125,000 REALCOMP
- 2019-01-30 Sold (MLS) $34,000 MiRealSource-MiMLS
- 2019-01-30 Sold (MLS) $34,000 REALCOMP
- 2019-01-07 Pending — MiRealSource-MiMLS
- 2019-01-07 Pending — REALCOMP
- 2018-12-11 Listed $44,900 MiRealSource-MiMLS
- 2018-12-11 Listed $44,900 REALCOMP
- 2018-11-05 Listing Removed — REALCOMP
- 2018-11-05 Listing Removed — MiRealSource-MiMLS
- 2018-10-20 Price Changed $45,000 MiRealSource-MiMLS
- 2018-10-19 Relisted — MiRealSource-MiMLS
- 2018-10-18 Price Changed $45,000 REALCOMP
- 2018-10-18 Relisted — REALCOMP
- 2018-08-18 Pending — MiRealSource-MiMLS
- 2018-08-18 Pending — REALCOMP
- 2018-07-13 Relisted — REALCOMP
- 2018-07-12 Listing Removed — REALCOMP
- 2018-06-05 Listed $42,000 MiRealSource-MiMLS
- 2018-06-05 Listed $42,000 REALCOMP
- 2018-06-01 Listing Removed — MiRealSource-MiMLS
- 2018-06-01 Listing Removed — REALCOMP
- 2018-05-24 Price Changed $44,000 MiRealSource-MiMLS
- 2018-05-24 Price Changed $44,000 REALCOMP
- 2018-02-21 Listed $54,000 MiRealSource-MiMLS
- 2018-02-21 Listed $54,000 REALCOMP
Property tax history
+4.9%/yrLatest (2025): $2,134 · -54.3% YoY. Source: county tax records.
Cash-flow waterfall
monthlySold comps — $/sqft
last 12 mo · ≤1 miLoading sold comps…