11593 Lakewood Preserve Pl · Fort Myers, FL
Flood risk 1/10 · Minimal
- FEMA flood zone
- X (unshaded)
- Chance of flooding over 30 yrs
- 0.0%
- Est. flood insurance / yr
- $507 – $1,088
Fire risk 4/10 · Minor
- Est. fire insurance / yr
- $947 – $1,759
Heat risk 9/10 · Severe
- Hot days now (above 107°F)
- 7 days/yr
- Hot days in 30 yrs
- 27 days/yr
Wind risk 10/10 · Severe
- Chance of severe wind over 30 yrs
- 99.0%
Air-quality risk 2/10 · Minimal
- Unhealthy air days now
- 1 days/yr
- Unhealthy air days in 30 yrs
- 1 days/yr
Risk factors via First Street. Map © Google.
Why this score? — see what drove the F grade
The composite is a weighted blend of 9 inputs, each scored 0–100. Each bar is that input's sub-score; the figure is the points it added to the 100-point composite (weight × sub-score).
- Cash flow +11.8/30.0
- Livability +4.3/5.0
- Schools +4.1/10.0
- 1% rule +3.8/10.0
- DSCR +3.5/10.0
- Rent growth +2.6/5.0
- Condition / age +2.5/5.0
- ARV discount +1.2/15.0
- Appreciation +0.0/10.0
$499,900
🖨 Deal sheet (PDF) 📄 Offer letter ✓ Due diligence
Listing remarks
Luxury Lakeside Living in Prestigious Marina Bay! Welcome to your move-in-ready dream home, nestled within the highly sought-after, gated community of Marina Bay. This single-family home perfectly blends luxury, convenience, and stunning lake views. The Home features 2 bedrooms plus a versatile den/office, this meticulously maintained property is designed for both relaxation and entertaining. The open floor plan boasts formal and kitchen dining areas, an elegant breakfast bar, and premium quartz countertops paired with stainless steel appliances. Enjoy a perfect mix of tile and carpet flooring, a modern home office space, and a master suite featuring a spacious walk-in shower. Step outside
Key facts
- Gated community
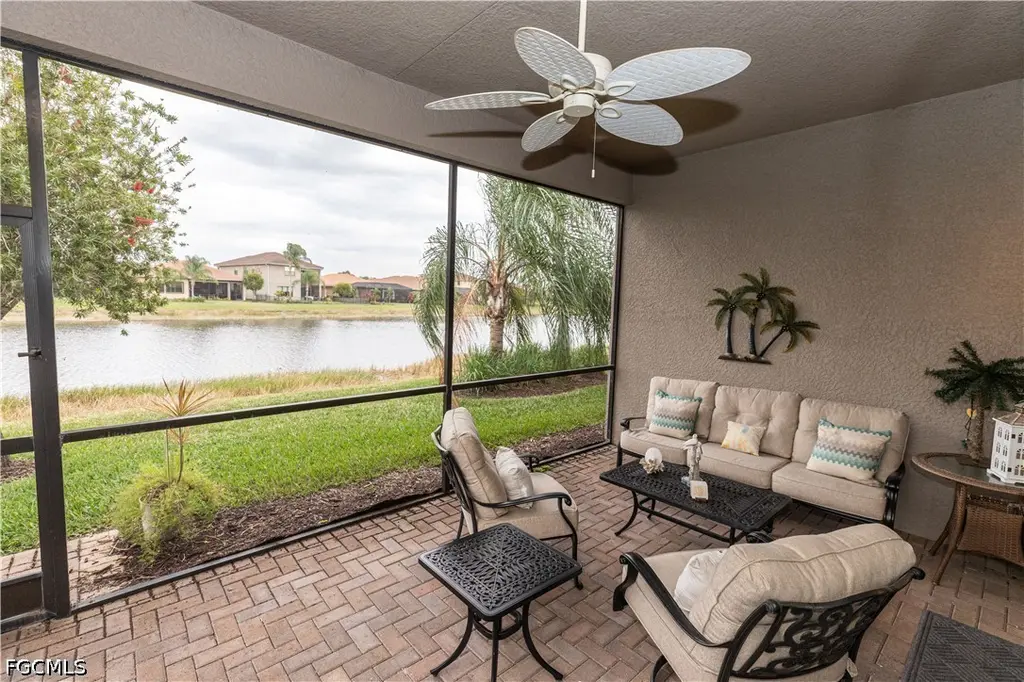
- Screened patio
- Fitness center
Tags
Property features AI
Finance
- Other: Community of approximately 800 units
- Financial info: Pets allowed (call; conditional)
- HOA & community: Homeowners association (quarterly fee); Association fee includes management, cable TV, internet, irrigation water, legal/accounting, grounds maintenance, pest control, recreation facilities, reserve fund, road maintenance, street lights, security, and trash; Community amenities include clubhouse, fitness center, pool, tennis courts, pickleball, basketball court, playground, park, trails, sidewalks, barbecue/picnic areas, billiards, hobby room, and management; Gated community with street lights
Exterior
- Parking: Attached 2-car garage with garage door opener; Deeded parking; Driveway; Paved parking
- Security: Gated community with guard; Security gate; Fenced; Smoke detectors
- Utilities: Cable available; High-speed internet available; Underground utilities; Public water (assessment paid); Public sewer (assessment paid)
- Home design: Single-story home; Tile roof; Block, concrete, and stucco construction; Faces west; Resale property
- Construction: Built with block, concrete, and stucco; Tile roof
- Exterior features: Sprinkler/irrigation system (automatic); Patio; Lanai, screened porch and porch; Community pool; Fenced; Gated community with security gate and gated with guard; Smoke detectors
Interior
- Kitchen: Dishwasher; Disposal; Icemaker / refrigerator with ice maker; Microwave; Range; Self-cleaning oven; Refrigerator; Eat-in kitchen; Pantry
- Bedrooms: Primary bedroom on main level
- Flooring: Carpet; Tile
- Bathrooms: Two full bathrooms; Dual sinks in primary bath; Separate shower
- Heating & cooling: Central heating (electric); Central air conditioning (electric); Ceiling fans
- Interior features: Single hung and sliding windows with shutters and window coverings; Unfurnished; Bedroom on main level; Dual sinks; Eat-in kitchen; Combined family/dining room and living/dining room; Main level primary bedroom; Pantry; Separate shower (shower only); Cable TV and high-speed internet available; Walk-in closets; Window treatments; Split bedroom floorplan
- Laundry & utility: Washer hookup and dryer hookup inside; Washer and dryer included
Neighborhood map
What this means for you Summary
Snapshot
- This is a 2-bed/2.0-bath single-family listed at $500k.
Deal economics
- At list price, monthly cash flow is $-141 ($-2k/yr) — negative.
- To cash-flow at today's rent, offer at most $475k (5.0% below list).
- To meet the 1% rule (rent ≥ 1% of price), the offer needs to be $440k (12.0% below list).
- Recommended offer: $440k (12.0% below list) — sets the bar for 1% rule.
- Cap rate 6.0% vs local median 3.3% in Fort Myers — top-decile yield for the area; either an underpriced asset or a hidden risk that comps aren't pricing in. Stress-test before assuming the spread holds.
Location & tenants
- Location reads 86/100 on livability (#14 in FL, #383 nationally) — a professional / high-income tenant draw. Strengths: amenities A+, commute A+, housing A+.
- Lee (suburban): math 47% / reading 50% proficiency, ranked #42 of 73 in FL (top 58%) — families likely to look elsewhere, expect single-tenant / working-renter base with shorter leases.
- Zoned schools: Veterans Park Academy For The Arts (math 41% / reading 45%, grade F, #1,366 of 2,144 statewide, top 64%, 2,133 students, 36% FRL); Oak Hammock Middle School (math 43% / reading 41%, grade D-, #340 of 571 statewide, top 61%, 1,563 students, 56% FRL); Lehigh Senior High School (math 23% / reading 45%, grade F, #394 of 667 statewide, top 60%, 2,476 students, 57% FRL).
- Market conditions: Rents flat; 821 active listings in the ZIP; 40 comparable units currently listed for rent nearby; rentals at typical pace (median 26d on market — plan ~3-4 weeks tenant-placement turnaround); high-income renter base; 15,411 units permitted in Lee County in 2024 (4,686 in 5+ unit buildings).
- At $4,400/mo this rent would consume 48% of the median local household income ($110k/yr) (locally 276% of renters already pay >50% of income on rent) — very limited rent-growth headroom before tenants either downsize or default.
Forward outlook
- Local home prices are declining (-3.0%/yr); year-one equity from $3k of loan paydown is wiped out by about $15k of value loss. Plan a longer hold.
- Lee County population projected at +44% by 2050 — long-run rental-demand tailwind backs the buy-and-hold thesis.
Negotiation context
- It's been on market 18 days — a 2% lower offer ($492k) is reasonable based on typical stale-listing flexibility.
- 3 sale attempts with the ask held roughly flat each time — persistent listings suggest the price (not the market) is what's stuck; bring a comps-based counter.
Risks & watch-outs
- Climate carrying-cost: severe wind risk, 99% chance of damaging wind over 30y; extreme-heat days projected 7→27/yr by 2055 (HVAC capex compounding) — expect insurance premiums to compound above CPI over the hold.
Questions for the listing agent
- What do current leases actually rent for vs. the listed asking? Can we see a recent rent roll and the last 12 months of T-12 income?
- What does the HOA fee cover, when was the last increase, and are there any pending special assessments or reserve-fund shortfalls?
- Is there a deadline driving the sale (1031 exchange, divorce, estate, relocation)? That informs how much negotiation room exists.
- The area grade is low — what's the realistic commute time and amenity access for the typical tenant pool here? Any planned neighborhood developments (good or bad) we should know about?
- What's the average days-on-market for RENTAL listings here right now (not sales)? A rising rental-DOM trend means longer vacancies and softer asking-rent achievability than the comps imply.
- What's the recent tenant-quality profile in this submarket — average credit score on applications, eviction rate, late-payment / NSF rate, and stable-employment percentage? A property-management company in the area should have these aggregated.
- How much new for-sale + rental construction is in the pipeline within 1–3 miles? Heavy new supply typically softens prices + rents 12–24 months out; constrained supply supports both.
Investment metrics
- 1% rule
- 0.88% ✗
- Cap rate
- 5.95%
- Cash-on-cash
- -1.21%
- DSCR
- 0.95
- GRM
- 9.5
CMA / ARV
- ARV (on-the-fly)
- $438,685
- Comps found
- 8
Show comp detail 8 sales within ~0.75 mi
| Address | Dist | Beds/Ba | Sqft | Sold | Price | $/sf | Match |
|---|---|---|---|---|---|---|---|
| 11800 Meadowrun Cir | 0.22mi | 2/2.0 | 2,104 (+6%) | 2mo | $550,000 | $261 | 78 |
| 12051 Lakewood Preserve Pl | 0.19mi | 2/2.0 | 1,857 (-6%) | 12mo | $410,000 | $221 | 70 |
| 11548 Lakewood Preserve Pl | 0.07mi | 3/2.5 (+1) | 2,242 (+13%) | 2mo | $490,000 | $219 | 66 |
| 11643 Riverstone Ln | 0.06mi | 3/2.5 (+1) | 2,242 (+13%) | 7mo | $390,000 | $174 | 63 |
| 11581 Riverstone Ln | 0.14mi | 3/2.5 (+1) | 2,242 (+13%) | 4mo | $495,000 | $221 | 62 |
| 11520 Foxbriar Ln | 0.16mi | 3/2.5 (+1) | 2,242 (+13%) | 6mo | $490,000 | $219 | 59 |
| 11530 Foxbriar Ln | 0.15mi | 3/2.5 (+1) | 2,242 (+13%) | 6mo | $445,000 | $198 | 59 |
| 11087 Sparkleberry Dr | 0.70mi | 3/3.0 (+1) | 2,169 (+9%) | 17mo | $489,000 | $225 | 29 |
Match score weights: distance 35% · size 25% · config 20% · recency 20%. Top-matched comps best support the ARV.
Projected returns pro-forma
-3.0% appreciation · 0.37% rent growth · sell at horizon
- IRR
- -21.4%
- Equity multiple
- 0.28×
- Total profit
- $-101,184
- Equity at exit
- $74,537
- IRR
- -23.2%
- Equity multiple
- -0.02×
- Total profit
- $-143,190
- Equity at exit
- $43,222
Cash invested: $139,972 (down + closing). Projections, not guarantees.
Landlord ↔ Tenant lean methodology
- Overall (STATE)
- 87 Strongly Landlord-Friendly
- State Florida
- 87 Strongly Landlord-Friendly · R+3
- County
- — inherits STATE
- City
- — inherits STATE
ZIP-level market 33913
- Home prices YoY
- -10.3%
- Rents YoY
- 0.4%
- Active inventory
- 821
- Price-to-rent
- 9.5×
Monthly cashflow live
- Estimated rent
- $4,400 high interval (Pro) →
- Mortgage (P&I)
- −$2,622
- Tax from tax record
- −$444 /mo · $5,324/yr
- Insurance
- −$208
- HOA
- −$344
- Vacancy / Maint / Mgmt
- −$924
- Net cashflow
- $-141
Break-even live
Sensitivity live
| Price | -10% $142 | -5% $0 | +0% $-141 | +5% $-283 | +10% $-424 |
|---|---|---|---|---|---|
| Rent | -10% $-489 | -5% $-315 | +0% $-141 | +5% $33 | +10% $206 |
| Rate | -1.0pp $110 | -0.5pp $-14 | base $-141 | +0.5pp $-271 | +1.0pp $-403 |
UW: 25.0% down · 7.5% · 30yr · 1.5% tax · 5.0% vac · 8.0% maint · 8.0% mgmt
Financing live
Cash to close
- Down payment
- $124,975
- Closing costs
- $14,997
- Reserves months
- —
- Total cash needed
- —
Loan-product check · same deal, 3 products live
Conventional
25% down · 7.5% · 30yr
- Down + closing
- —
- Monthly P&I
- —
- Monthly cashflow
- —
- DSCR
- —
- Eligible?
- —
Personal DTI + credit; lowest rate.
DSCR
20% down · 8.5% · 30yr
- Down + closing
- —
- Monthly P&I
- —
- Monthly cashflow
- —
- DSCR
- —
- Eligible?
- —
No personal income docs; deal must DSCR.
Hard money
10% down · 12.0% · 12mo
- Down + closing
- —
- Monthly P&I
- —
- Monthly cashflow
- —
- DSCR
- —
- Eligible?
- —
Short-term bridge; refi at stabilization.
Rent comps 40 comps
| Address | Beds | Baths | Sqft | Rent | $/sqft | DOM | Units | Dist |
|---|---|---|---|---|---|---|---|---|
| 11593 Lakewood Preserve Pl Fort Myers, FL | 2.0 | 2.0 | 1985 | $2,800 | $1.41 | 25d | 1 | 0.03mi |
| 11617 Lakewood Preserve Pl Fort Myers, FL | 3.0 | 2.5 | 2242 | $3,100 | $1.38 | 17d | 1 | 0.06mi |
| 11541 Stonecreek Cir Fort Myers, FL | 3.0 | 3.0 | 2147 | $3,300 | $1.54 | 25d | 1 | 0.23mi |
| 12016 Five Waters Cir Fort Myers, FL | 3.0 | 2.0 | 1646 | $4,500 | $2.73 | 25d | 1 | 0.33mi |
| 11869 Lakewood Preserve Pl Fort Myers, FL | 2.0 | 2.0 | 1646 | $5,000 | $3.04 | 25d | 1 | 0.34mi |
| 11619 Meadowrun Cir Fort Myers, FL | 3.0 | 2.5 | 2242 | $2,495 | $1.11 | 25d | 1 | 0.46mi |
| 12171 Treeline Ave Fort Myers, FL | 1.0–3.0 | 1.0–2.0 | 1321 | $2,606 | $1.97 | 5d | 23 | 0.52mi |
| 10280 Crepe Jasmine Ln Unit 1546286P Fort Myers, FL | 3.0 | 2.0 | 1571 | $4,526 | $2.88 | 17d | 1 | 0.59mi |
| 10535 Carolina Willow Dr Fort Myers, FL | 3.0 | 2.0 | 1290 | $2,300 | $1.78 | 23d | 1 | 0.61mi |
| 10271 Glastonbury Cir #102 Fort Myers, FL | 2.0 | 2.0 | 1550 | $4,500 | $2.90 | 25d | 1 | 0.68mi |
| 10908 Clarendon St Fort Myers, FL | 3.0 | 2.0 | 1433 | $8,000 | $5.58 | 25d | 1 | 0.68mi |
| 10908 Clarendon St Fort Myers, FL | 3.0 | 2.0 | 1433 | $8,000 | $5.58 | 16d | 1 | 0.68mi |
| 11075 Lancewood St Fort Myers, FL | 3.0 | 2.0 | 1575 | $2,300 | $1.46 | 17d | 1 | 0.75mi |
| 11075 Lancewood St Fort Myers, FL | 3.0 | 2.0 | 1575 | $2,300 | $1.46 | 25d | 1 | 0.75mi |
| 10900 Glenhurst St Fort Myers, FL | 2.0 | 2.0 | 1355 | $2,200 | $1.62 | 4d | 1 | 0.75mi |
| 10952 Clarendon St Fort Myers, FL | 2.0 | 2.0 | 1582 | $4,000 | $2.53 | 25d | 1 | 0.75mi |
| 10879 Rutherford Rd Fort Myers, FL | 2.0 | 2.0 | 1566 | $3,500 | $2.23 | 25d | 1 | 0.78mi |
| 11012 Castlereagh St Fort Myers, FL | 3.0 | 3.0 | 2517 | $12,000 | $4.77 | 25d | 1 | 0.85mi |
| 11012 Mill Creek Way #2205 Fort Myers, FL | 2.0 | 2.0 | 1749 | $5,500 | $3.14 | 25d | 1 | 0.85mi |
| 10121 Colonial Country Club Blvd #1802 Fort Myers, FL | 2.0 | 2.0 | 1530 | $4,800 | $3.14 | 5d | 1 | 0.86mi |
| 10128 Colonial Country Club Blvd #602 Fort Myers, FL | 2.0 | 2.0 | 1530 | $4,600 | $3.01 | 25d | 1 | 0.87mi |
| 11225 Lithgow Ln Fort Myers, FL | 2.0 | 2.0 | 2153 | $8,000 | $3.72 | 25d | 1 | 0.87mi |
| 11011 Mill Creek Way #1307 Fort Myers, FL | 2.0 | 2.0 | 1379 | $5,000 | $3.63 | 25d | 1 | 0.87mi |
| 12531 Villagio Way Fort Myers, FL | 3.0 | 2.0 | 1913 | $8,500 | $4.44 | 25d | 1 | 0.96mi |
| 11701 Avingston Ter Fort Myers, FL | 2.0 | 2.0 | 1553 | $5,500 | $3.54 | 16d | 1 | 0.97mi |
| 10112 Colonial Country Club Blvd #209 Fort Myers, FL | 2.0 | 2.0 | 1530 | $5,000 | $3.27 | 25d | 1 | 0.97mi |
| 10111 Colonial Country Club Blvd #2308 Fort Myers, FL | 2.0 | 2.0 | 1309 | $2,000 | $1.53 | 13d | 1 | 1.00mi |
| 11280 Reflection Isles Blvd Fort Myers, FL | 3.0 | 2.0 | 1670 | $3,500 | $2.10 | 25d | 1 | 1.02mi |
| 11029 Mill Creek Way #405 Fort Myers, FL | 2.0 | 2.0 | 1749 | $2,500 | $1.43 | 25d | 1 | 1.02mi |
| 11033 Mill Creek Way #202 Fort Myers, FL | 2.0 | 2.0 | 1379 | $5,400 | $3.92 | 25d | 1 | 1.04mi |
| 11230 Suffield St Fort Myers, FL | 2.0 | 2.0 | 1560 | $8,500 | $5.45 | 25d | 1 | 1.05mi |
| 10020 Horse Creek Rd Fort Myers, FL | 2.0 | 2.0 | 1692 | $2,500 | $1.48 | 25d | 1 | 1.08mi |
| 10602 Camarelle Cir Fort Myers, FL | 2.0 | 2.0 | 1690 | $5,500 | $3.25 | 25d | 1 | 1.14mi |
| 10711 Palazzo Way Fort Myers, FL | 2.0 | 2.0 | 1257 | $3,900 | $3.10 | 17d | 2 | 1.17mi |
| 10711 Palazzo Way Unit 203 Fort Myers, FL | 2.0 | 2.0 | 1257 | $5,300 | $4.22 | 23d | 1 | 1.17mi |
| 10751 Palazzo Way #103 Fort Myers, FL | 2.0 | 2.0 | 1235 | $5,000 | $4.05 | 25d | 1 | 1.17mi |
| 10700 Palazzo Way #201 Fort Myers, FL | 2.0 | 2.0 | 1390 | $5,000 | $3.60 | 23d | 1 | 1.20mi |
| 9661 Hemingway Ln #3207 Fort Myers, FL | 2.0 | 2.0 | 1300 | $3,900 | $3.00 | 5d | 1 | 1.22mi |
| 10791 Palazzo Way #301 Fort Myers, FL | 2.0 | 2.0 | 1390 | $5,300 | $3.81 | 25d | 1 | 1.22mi |
| 12908 New Market St #201 Fort Myers, FL | 3.0 | 2.5 | 2198 | $3,000 | $1.36 | 25d | 1 | 1.22mi |
HOA detail
- Monthly dues
- $344 · $4,128/yr
- Likely covers
- security
Listing history 11 events
-
2026-06-22days on market $499,900 Active 18 DOM
-
2026-06-18days on market $499,900 Active 15 DOM
-
2026-06-17days on market $499,900 Active 14 DOM
-
2026-06-16days on market $499,900 Active 13 DOM
-
2026-06-15days on market $499,900 Active 12 DOM
-
2026-06-13days on market $499,900 Active 10 DOM
-
2026-06-10days on market $499,900 Active 7 DOM
-
2026-06-09days on market $499,900 Active 6 DOM
-
2026-06-08days on market $499,900 Active 5 DOM
-
2026-06-07remarks 699-char remark
-
2026-06-07$499,900 Active 4 DOM
ⓘ Source: listings_history table (triggers on properties + properties_extension) + one-shot
backfill from property_details.listing_events for pre-trigger history.
Tax reassessment forecast FL · Resets to sale price
- Current annual tax
- $5,324 · $444/mo
- Projected year-2 tax
- $5,324 · $444/mo
- Expected delta
- $0/yr ($0/mo · 0.0%)
ⓘ Screening estimate from a state-policy table — verify with the county assessor before closing.
Climate risk First Street
- Flood 1/10 Low FEMA zone X (unshaded) · 0% chance over 30 yrs
- Wildfire 4/10 Moderate
- Heat 9/10 Extreme 7 d/yr ≥107°F today · 27 d/yr by 30 yrs out
- Wind 10/10 Extreme 99% chance of damaging wind over 30 yrs
- Air quality 2/10 Low 1 unhealthy d/yr today · 1 by 30 yrs out
Nearby sold comps map
Loading sold comps map…
Walkable amenities ~0.75 mi
Loading nearby amenities…
Taxation est. · year 1
- Rental income
- $52,804
- − Mortgage interest
- −$28,002
- − Property taxes
- −$5,324
- − Insurance
- −$2,500
- − Repairs & maintenance
- −$4,224
- − Management
- −$4,224
- − HOA
- −$4,128
- − Depreciation
- −$14,543
- Taxable loss
- −$10,142
- Est. tax savings @ 24.0%
- +$2,434
- After-tax cash flow
- $739/yr
For passive investors: Depreciation is non-cash, so a rental often shows a tax loss while cash-flowing — sheltering income. Rental losses are passive: they offset passive income freely, and up to $25,000/yr can offset ordinary (W-2) income if you actively participate and your MAGI is under $100k (phasing out to $0 by $150k); unused losses carry forward. On sale, claimed depreciation is recaptured at up to 25%, and gains may owe capital-gains tax (a 1031 exchange can defer both). Figures are a year-1 estimate at your 24.0% rate — not tax advice; consult a CPA.
Schools (NCES district)
- District
- Lee
- NCES district ID
- 1201080
- Math proficiency
- 47% ▼ -11.00%
- Reading proficiency
- 50% ▼ -4.00%
- Median HH income
- $49,518
- Composite
- 41.49/100
- National rank
- #3458
- State rank
- #42 of 73 in FL
Livability — Fort Myers
- Score
- 86/100
- State rank
- #14
- US rank
- #383
Category grades
Schools grade is shown separately in the Schools card above.
Census & demographics
- Census place
- Fort Myers, FL
- County
- Lee County · 788,662 people
- Metro
- Cape Coral-Fort Myers, FL
- Population (ZIP)
- 31,538
- Household income
- $110,373
- Rent vs Own
- Severe rent burden
- 276.0
Population outlook (Lee County) Hauer SSP2
- Today (2025)
- 871,946 people
- By 2030
- 955,468 · +9.6%
- By 2040
- 1,113,587 · +27.7%
- By 2050
- 1,256,891 · +44.1%
- By 2075
- 1,560,270 · +78.9%
- By 2100
- 1,726,848 · +98.0%
Race, ethnicity, and origin ACS 2023
- Neighborhood character
- Predominantly White (74%)
- Race & ethnicity
- White 74% Hispanic / Latino 13% Two or more races 11% Black 5% Asian 2%
- Hispanic origin (detail)
- Mexican 3% Puerto Rican 3% Cuban 2%
- Common ancestry
- Romanian 5% Lithuanian 3% Slovak 2%
- Foreign-born
- 14% · Canada, Vietnam, China
- Languages at home
- 84% English-only · Spanish 10% Other Indo-European 2% French/Haitian/Cajun 2%
Political lean MEDSL · Lee
- 2024 margin
- Strong R (+28.4) · D 35.5% · R 63.9%
- 2008→2024 swing
- -18.0pp toward R · 2008: -10.4pp · 2024: -28.4pp
- All cycles
- 2024: R+28.4 2020: R+19.2 2016: R+20.4 2012: R+16.6 2008: R+10.4
Not yet ingested
- Civics
- —
Market trends
- HPI YoY
- ▼ -25.45%
- Current HPI
- 221.7115
- Rent YoY
- ▲ 0.37%
- Metro
- Cape Coral-Fort Myers, FL
- State GDP YoY
- ▲ 3.28%
- F500 in state
- 36
Industry mix (Fortune 500 HQ in FL)
| Industry | F500 HQs | Revenue |
|---|---|---|
| Industrial Technology | 2 | $29B |
|
||
| Insurance | 2 | $17B |
|
||
| Retail | 1 | $60B |
|
||
| Technology Distribution | 1 | $58B |
|
||
| Homebuilding | 1 | $35B |
|
||
| Technology Manufacturing | 1 | $35B |
|
||
Price history
-49.1% since first listed5 events — show timeline
- 2026-06-03 Rental Removed $2,800 FORTMLS
- 2026-05-31 Listed $499,900 FORTMLS
- 2026-05-07 Listed for Rent $2,800 FORTMLS
- 2026-04-24 Rental Removed $5,500 NAPLESMLS
- 2026-01-13 Listed for Rent $5,500 NAPLESMLS
Property tax history
+27.9%/yrLatest (2025): $5,324 · +2.5% YoY. Source: county tax records.
Cash-flow waterfall
monthlySold comps — $/sqft
last 12 mo · ≤1 miLoading sold comps…