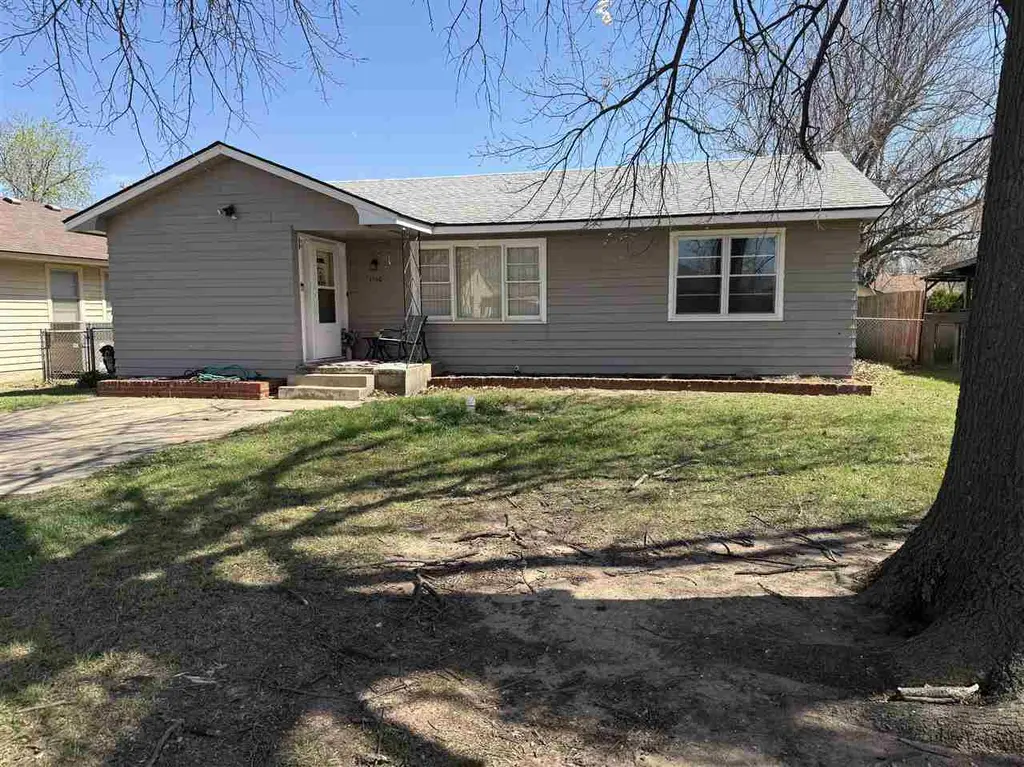
1510 S D. St · Blackwell, OK
Flood risk 1/10 · Minimal
- FEMA flood zone
- X (unshaded)
- Chance of flooding over 30 yrs
- 0.0%
- Est. flood insurance / yr
- $507 – $1,088
Fire risk 1/10 · Minimal
- Est. fire insurance / yr
- $2,463 – $4,575
Heat risk 5/10 · Moderate
- Hot days now (above 109°F)
- 7 days/yr
- Hot days in 30 yrs
- 19 days/yr
Wind risk 2/10 · Minimal
- Chance of severe wind over 30 yrs
- 2.0%
Air-quality risk 2/10 · Minimal
- Unhealthy air days now
- 1 days/yr
- Unhealthy air days in 30 yrs
- 1 days/yr
Risk factors via First Street. Map © Google.
Why this score? — see what drove the B- grade
The composite is a weighted blend of 9 inputs, each scored 0–100. Each bar is that input's sub-score; the figure is the points it added to the 100-point composite (weight × sub-score).
- Cash flow +27.4/30.0
- ARV discount +10.2/15.0
- DSCR +9.5/10.0
- 1% rule +6.7/10.0
- Appreciation +3.6/10.0
- Livability +3.0/5.0
- Rent growth +2.5/5.0
- Condition / age +2.5/5.0
- Schools +2.1/10.0
$89,900
🖨 Deal sheet 📄 Offer letter ✓ Due diligence
Listing remarks MLS
If you are looking for a home that is priced right to sell. This is it. If you are looking for a home that is move in ready again this is it. Very quiet neighborhood and close to schools. Come by and take a look.
Key facts
- Spacious yard
- Off-street parking
- Built 1957
Tags
Property features AI
Exterior
- Security: Smoke detectors
- Utilities: Public water; Public sewer; Natural gas available and connected; Electricity connected
- Home design: Single-family residence; One story
- Construction: Vinyl siding
- Exterior features: Chain link fence; Composition roof
Interior
- Kitchen: Microwave; Dishwasher
- Flooring: Hardwood
- Bathrooms: 1 full bathroom
- Heating & cooling: Central heating; Ceiling fan cooling; Electric cooling
- Interior features: Pantry; Ceiling fans
- Laundry & utility: Washer; Dryer
Neighborhood map
What this means for you Summary
Snapshot
- This is a 2-bed/1.0-bath single-family listed at $90k.
Deal economics
- At list price, monthly cash flow is $262 ($3k/yr) — positive.
- The deal already cash-flows at list — no discount required.
- Meets the 1% rule at list price ($1k rent vs $90k).
- Recommended offer: $85k (6.0% below list) — sets the bar for market timing.
Location & tenants
- Location reads 59/100 on livability (#385 in OK) — a working-class tenant base; expect higher turnover. Strengths: cost of living A+, housing A+; Watch: crime D-, amenities F, commute F.
- Blackwell (town): math 27% / reading 23% proficiency, ranked #116 of 270 in OK (top 43%) — low school quality limits family demand, transient renter base, plan for 1-2y turnover; 61% free/reduced lunch — lower-income household profile, screen leases tightly.
- Zoned schools: Blackwell Ms (math 13% / reading 11%, grade F, #269 of 345 statewide, top 79%, 259 students, 0% FRL); Blackwell Hs (math 22% / reading 27%, grade F, #150 of 447 statewide, top 48%, 331 students, 0% FRL) — zoned schools average 0% FRL vs 61% district-wide (61 pts lower); this property's tenant base skews higher-income than the district average.
- Market conditions: 23 active listings in the ZIP; 11 units permitted in Kay County in 2024 (0 in 5+ unit buildings).
Forward outlook
- Local home prices are declining (-2.8%/yr); year-one equity from $622 of loan paydown is wiped out by about $3k of value loss. Plan a longer hold.
- Kay County population projected at -12% by 2050 — secular population decline; favor cash flow + early exit over multi-decade hold.
- At projected returns (-2.8% appreciation + 3.0% rent growth), your $25k cash investment doubles in ~9 years — after that, you're playing with house money.
Negotiation context
- It's been on market 75 days — a 6% lower offer ($85k) is reasonable based on typical stale-listing flexibility.
- 2 sale attempts since 5y ago with the ask held roughly flat each time — persistent listings suggest the price (not the market) is what's stuck; bring a comps-based counter.
- Current owner paid $66k; 36% above their basis — modest negotiation headroom, anchor on the comps not their cost.
Risks & watch-outs
- Watch-outs: built in 1957 — expect roof / HVAC / electrical / plumbing capex.
- Climate carrying-cost: extreme-heat days projected 7→19/yr by 2055 (HVAC capex compounding) — expect insurance premiums to compound above CPI over the hold.
Questions for the listing agent
- It's been on market 75 days. Have you received any prior offers? Is the seller open to a 6% concession, seller financing, or rate buy-down credit?
- Built in 1957 — when were the roof, HVAC, electrical panel, plumbing, and water heater last replaced?
- Why hasn't it sold? Are there any deal-killer items the seller is aware of (foundation, flood, title, zoning, code violations)?
- Is there a deadline driving the sale (1031 exchange, divorce, estate, relocation)? That informs how much negotiation room exists.
- Schools are F-rated, which usually means shorter tenancies and higher turnover. Who's the typical renter profile here, and what's been the actual vacancy rate?
- Crime grade is D in this area — have there been break-ins, vandalism, or insurance claims at this property in the last 3 years? What carrier currently insures it and at what premium?
- What's the average days-on-market for RENTAL listings here right now (not sales)? A rising rental-DOM trend means longer vacancies and softer asking-rent achievability than the comps imply.
- What's the recent tenant-quality profile in this submarket — average credit score on applications, eviction rate, late-payment / NSF rate, and stable-employment percentage? A property-management company in the area should have these aggregated.
- How much new for-sale + rental construction is in the pipeline within 1–3 miles? Heavy new supply typically softens prices + rents 12–24 months out; constrained supply supports both.
Investment metrics
- 1% rule
- 1.17% ✓
- Cap rate
- 9.79%
- Cash-on-cash
- 12.47%
- DSCR
- 1.55
- GRM
- 7.1
CMA / ARV
- ARV (on-the-fly)
- $95,550
- Comps found
- 12
Show comp detail 12 sales within ~0.75 mi
| Address | Dist | Beds/Ba | Sqft | Sold | Price | $/sf | Match |
|---|---|---|---|---|---|---|---|
| 520 E Coolidge | 0.12mi | 3/1.0 (+1) | 1,274 (0%) | 0mo | $78,000 | $61 | 89 |
| 1517 S E | 0.05mi | 3/1.0 (+1) | 1,159 (-9%) | 2mo | $68,000 | $59 | 76 |
| 117 Urbana | 0.26mi | 3/1.0 (+1) | 1,201 (-6%) | 1mo | $79,000 | $66 | 73 |
| 1405 S D St | 0.08mi | 3/1.0 (+1) | 1,128 (-12%) | 4mo | $75,000 | $66 | 69 |
| 429 E Edwards Ave | 0.07mi | 3/1.0 (+1) | 1,094 (-14%) | 2mo | $90,000 | $82 | 66 |
| 434 E Edwards Ave | 0.03mi | 3/1.0 (+1) | 1,448 (+14%) | 15mo | $120,000 | $83 | 58 |
| 120 Urbana Dr | 0.23mi | 3/2.0 (+1) | 1,423 (+12%) | 4mo | $107,500 | $76 | 57 |
| 314 Fairview Ave | 0.61mi | 3/1.0 (+1) | 1,305 (+2%) | 8mo | $105,000 | $80 | 56 |
| 306 Fairview Ave | 0.58mi | 3/2.0 (+1) | 1,300 (+2%) | 9mo | $88,000 | $68 | 53 |
| 307 W Coolidge Ave | 0.46mi | 2/1.0 | 1,349 (+6%) | 20mo | $57,000 | $42 | 52 |
| 119 Carson Ave | 0.38mi | 2/1.0 | 1,114 (-13%) | 13mo | $120,000 | $108 | 50 |
| 401 Fairview | 0.70mi | 2/1.0 | 1,176 (-8%) | 19mo | $88,500 | $75 | 38 |
Match score weights: distance 35% · size 25% · config 20% · recency 20%. Top-matched comps best support the ARV.
Projected returns pro-forma
-2.78% appreciation · 3.0% rent growth · sell at horizon
- IRR
- 2.9%
- Equity multiple
- 1.11×
- Total profit
- $2,889
- Equity at exit
- $14,267
- IRR
- 12.1%
- Equity multiple
- 1.98×
- Total profit
- $24,595
- Equity at exit
- $9,263
Cash invested: $25,172 (down + closing). Projections, not guarantees.
Landlord ↔ Tenant lean methodology
- Overall (STATE)
- 83 Strongly Landlord-Friendly
- State Oklahoma
- 83 Strongly Landlord-Friendly · R+20
- County
- — inherits STATE
- City
- — inherits STATE
ZIP-level market 74631
- Home prices YoY
- -1.5%
- Active inventory
- 23
- Price-to-rent
- 7.1×
Monthly cashflow live
- Estimated rent
- $1,048 medium interval (Pro) →
- Mortgage (P&I)
- −$471
- Tax from tax record
- −$57 /mo · $688/yr
- Insurance
- −$37
- HOA
- −$0
- Vacancy / Maint / Mgmt
- −$220
- Net cashflow
- $262
Break-even live
UW: 25.0% down · 7.5% · 30yr · 1.5% tax · 5.0% vac · 8.0% maint · 8.0% mgmt
Financing live
Cash to close
- Down payment
- $22,475
- Closing costs
- $2,697
- Reserves months
- —
- Total cash needed
- —
Loan-product check · same deal, 3 products live
Conventional
25% down · 7.5% · 30yr
- Down + closing
- —
- Monthly P&I
- —
- Monthly cashflow
- —
- DSCR
- —
- Eligible?
- —
Personal DTI + credit; lowest rate.
DSCR
20% down · 8.5% · 30yr
- Down + closing
- —
- Monthly P&I
- —
- Monthly cashflow
- —
- DSCR
- —
- Eligible?
- —
No personal income docs; deal must DSCR.
Hard money
10% down · 12.0% · 12mo
- Down + closing
- —
- Monthly P&I
- —
- Monthly cashflow
- —
- DSCR
- —
- Eligible?
- —
Short-term bridge; refi at stabilization.
Listing history 14 events
-
2026-06-09days on market $89,900 Active 75 DOM
-
2026-06-08days on market $89,900 Active 74 DOM
-
2026-06-07days on market $89,900 Active 73 DOM
-
2026-06-07days on market $89,900 Active 72 DOM
-
2026-06-04days on market $89,900 Active 69 DOM
-
2026-06-02days on market $89,900 Active 68 DOM
-
2026-06-01days on market $89,900 Active 67 DOM
-
2026-05-31days on market $89,900 Active 66 DOM
-
2026-05-31days on market $89,900 Active 65 DOM
-
2026-03-25$89,900 Active
-
2022-03-01soldstatus $66,000
-
2022-02-25soldstatus $66,000 214-char remark
Show marketing remark (214 chars)
If you are looking for a home that is priced right to sell. This is it. If you are looking for a home that is move in ready again this is it. Very quiet neighborhood and close to schools. Come by and take a look.
-
2021-10-19$69,500 214-char remark
Show marketing remark (214 chars)
If you are looking for a home that is priced right to sell. This is it. If you are looking for a home that is move in ready again this is it. Very quiet neighborhood and close to schools. Come by and take a look.
-
2000-08-28soldstatus $37,500
ⓘ Source: listings_history table (triggers on properties + properties_extension) + one-shot
backfill from property_details.listing_events for pre-trigger history.
Tax reassessment forecast OK · Resets to sale price
- Current annual tax
- $688 · $57/mo
- Projected year-2 tax
- $809 · $67/mo
- Expected delta
- +$121/yr (+$10/mo · 17.6%)
ⓘ Screening estimate from a state-policy table — verify with the county assessor before closing.
Climate risk First Street
- Flood 1/10 Low FEMA zone X (unshaded) · 0% chance over 30 yrs
- Wildfire 1/10 Low
- Heat 5/10 Major 7 d/yr ≥109°F today · 19 d/yr by 30 yrs out
- Wind 2/10 Low 2% chance of damaging wind over 30 yrs
- Air quality 2/10 Low 1 unhealthy d/yr today · 1 by 30 yrs out
Nearby sold comps map
Loading sold comps map…
Walkable amenities ~0.75 mi
Loading nearby amenities…
Taxation est. · year 1
- Rental income
- $12,575
- − Mortgage interest
- −$5,036
- − Property taxes
- −$688
- − Insurance
- −$450
- − Repairs & maintenance
- −$1,006
- − Management
- −$1,006
- − Depreciation
- −$2,615
- Taxable income
- $1,775
- Est. tax owed @ 24.0%
- −$426
- After-tax cash flow
- $2,714/yr
For passive investors: Depreciation is non-cash, so a rental often shows a tax loss while cash-flowing — sheltering income. Rental losses are passive: they offset passive income freely, and up to $25,000/yr can offset ordinary (W-2) income if you actively participate and your MAGI is under $100k (phasing out to $0 by $150k); unused losses carry forward. On sale, claimed depreciation is recaptured at up to 25%, and gains may owe capital-gains tax (a 1031 exchange can defer both). Figures are a year-1 estimate at your 24.0% rate — not tax advice; consult a CPA.
Schools (NCES district)
- District
- Blackwell
- NCES district ID
- 4004630
- Math proficiency
- 27% ▼ -12.00%
- Reading proficiency
- 23% ▼ -9.00%
- Median HH income
- $37,923
- Composite
- 20.93/100
- National rank
- #8480
- State rank
- #116 of 270 in OK
Livability — Blackwell
- Score
- 59/100
- State rank
- #385
- US rank
- #20038
Category grades
Schools grade is shown separately in the Schools card above.
Census & demographics
- Census place
- Blackwell, OK
- City population
- 6,795
- Population (ZIP)
- 6,795
Population outlook (Kay County) Hauer SSP2
- Today (2025)
- 43,389 people
- By 2030
- 42,222 · -2.7%
- By 2040
- 40,108 · -7.6%
- By 2050
- 38,231 · -11.9%
- By 2075
- 34,119 · -21.4%
- By 2100
- 28,526 · -34.3%
Race, ethnicity, and origin ACS 2023
- Neighborhood character
- Predominantly White (76%)
- Race & ethnicity
- White 76% Hispanic / Latino 12% Two or more races 8% Native American 4%
- Hispanic origin (detail)
- Mexican 11%
- Common ancestry
- Iranian 1% Lithuanian 1% Slovak 1%
- Foreign-born
- 3% · Canada
- Languages at home
- 92% English-only · Spanish 8%
Political lean MEDSL · Kay
- 2024 margin
- Solid R (+49.4) · D 24.4% · R 73.8% · Other 1.7%
- 2008→2024 swing
- -7.8pp toward R · 2008: -41.6pp · 2024: -49.4pp
- All cycles
- 2024: R+49.4 2020: R+51.0 2016: R+50.2 2012: R+42.6 2008: R+41.6
Not yet ingested
- Civics
- —
Market trends
- HPI YoY
- ▼ -2.78%
- Current HPI
- 183.6342
- Rent YoY
- —
- Metro
- —
- State GDP YoY
- ▲ 1.55%
- F500 in state
- 6
Industry mix (Fortune 500 HQ in OK)
| Industry | F500 HQs | Revenue |
|---|---|---|
| Energy | 3 | $48B |
|
||
Price history
+139.7% since first listed5 events — show timeline
- 2026-03-25 Listed $89,900 NCBOR
- 2022-03-01 Sold (Public Records) $66,000 Public Records
- 2022-02-25 Sold (MLS) $66,000 NCBOR
- 2021-10-19 Listed $69,500 NCBOR
- 2000-08-28 Sold (Public Records) $37,500 Public Records
Property tax history
+7.1%/yrLatest (2025): $688 · -1.9% YoY. Source: county tax records.
Cash-flow waterfall
monthlySold comps — $/sqft
last 12 mo · ≤1 miLoading sold comps…