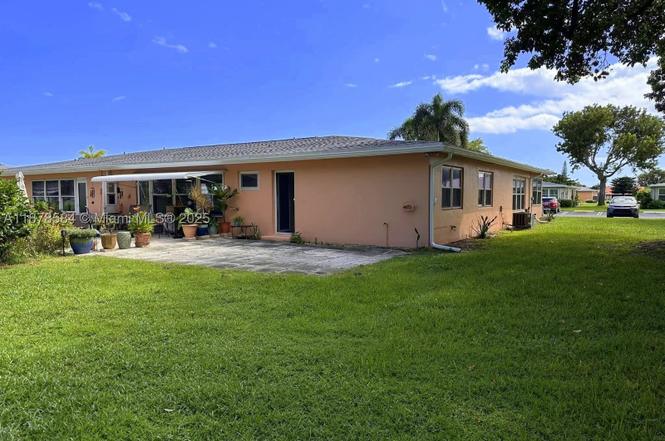
285 N High Point Blvd Unit A · Boynton Beach, FL
Flood risk 1/10 · Minimal
- FEMA flood zone
- X (unshaded)
- Chance of flooding over 30 yrs
- 0.0%
- Est. flood insurance / yr
- $507 – $1,088
Fire risk 1/10 · Minimal
- Est. fire insurance / yr
- $947 – $1,759
Heat risk 10/10 · Severe
- Hot days now (above 105°F)
- 7 days/yr
- Hot days in 30 yrs
- 27 days/yr
Wind risk 10/10 · Severe
- Chance of severe wind over 30 yrs
- 99.0%
Air-quality risk 2/10 · Minimal
- Unhealthy air days now
- 1 days/yr
- Unhealthy air days in 30 yrs
- 2 days/yr
Risk factors via First Street. Map © Google.
Why this score? — see what drove the C- grade
The composite is a weighted blend of 9 inputs, each scored 0–100. Each bar is that input's sub-score; the figure is the points it added to the 100-point composite (weight × sub-score).
- Cash flow +20.3/30.0
- ARV discount +7.5/15.0
- 1% rule +6.4/10.0
- DSCR +6.4/10.0
- Schools +4.3/10.0
- Livability +3.6/5.0
- Rent growth +3.4/5.0
- Condition / age +2.5/5.0
- Appreciation +0.0/10.0
$220,000
🖨 Deal sheet 📄 Offer letter ✓ Due diligence
Listing remarks
Discover easy, vibrant living in this charming 2-bedroom, 2-bath corner villa surrounded by expansive green space, located in the desirable High Point 55+ community. This well-maintained home offers both comfort and peace of mind, featuring a new roof (2023), fresh exterior paint (2024), and updated asphalt driveway and roads (2021). Hurricane impact windows provide added security and energy efficiency. Inside, you’ll find tile flooring throughout the main living areas for a clean, low-maintenance lifestyle, along with ceiling fans in every room to keep things cool year-round. The spacious Florida room has been thoughtfully converted into a bright sunroom—perfect for relaxing, e
Key facts
- New exterior paint
- Florida room
- Sun room
Tags
Property features AI
Finance
- Financial info: Pets not allowed
- HOA & community: Monthly association fee; Association amenities include clubhouse, pool, tennis courts, basketball court, billiard room, barbecue/picnic area, laundry, and maintenance of grounds and structure; Association covers cable TV, internet, insurance, laundry, pool(s), roof, sewer, trash, water, and reserves
Exterior
- Parking: Guest parking; One assigned parking space
- Security: Security/high-impact doors; Complex fenced
- Utilities: Cable available
- Home design: Single-story property; South-facing; Entry at level 1; Has attached property
- Construction: Block construction; Resale property
- Exterior features: Patio; Security/high-impact doors; Complex is fenced; Association pool
Interior
- Kitchen: Dishwasher; Refrigerator; Electric water heater
- Bedrooms: Main level primary bedroom; Florida room
- Flooring: Ceramic tile
- Bathrooms: 2 full bathrooms
- Heating & cooling: Central heating (electric); Central air conditioning (electric); Ceiling fan(s)
- Interior features: Impact glass windows; First floor entry; Living/dining room; Main-level primary bedroom
- Laundry & utility: Common area laundry
Neighborhood map
What this means for you Summary
Snapshot
- This is a 2-bed/2.0-bath condo listed at $220k.
Deal economics
- At list price, monthly cash flow is $282 ($3k/yr) — positive.
- The deal already cash-flows at list — no discount required.
- Meets the 1% rule at list price ($2k rent vs $220k).
- Recommended offer: $194k (12.0% below list) — sets the bar for market timing.
- Cap rate 7.8% vs local median 4.3% in Boynton Beach — top-decile yield for the area; either an underpriced asset or a hidden risk that comps aren't pricing in. Stress-test before assuming the spread holds.
Location & tenants
- Location reads 72/100 on livability (#351 in FL) — a middle-class / working-renter tenant base. Strengths: housing A+, health & safety B+, cost of living B; Watch: amenities D+, crime D-, commute F.
- Palm Beach (suburban): math 46% / reading 53% proficiency, ranked #34 of 73 in FL (top 47%) — families likely to look elsewhere, expect single-tenant / working-renter base with shorter leases.
- Market conditions: Rents rising (+3.6%/yr); 536 active listings in the ZIP; 40 comparable units currently listed for rent nearby; rentals at typical pace (median 22d on market — plan ~3-4 weeks tenant-placement turnaround); 3,974 units permitted in Palm Beach County in 2024 (1,012 in 5+ unit buildings).
- This rent runs 44% of the median local income ($68k/yr) — at the standard rent-burdened threshold; future hikes will face affordability resistance.
Forward outlook
- Local home prices are declining (-3.0%/yr); year-one equity from $2k of loan paydown is wiped out by about $7k of value loss. Plan a longer hold.
- Palm Beach County population projected at +30% by 2050 — long-run rental-demand tailwind backs the buy-and-hold thesis.
Negotiation context
- It's been on market 258 days — a 12% lower offer ($194k) is reasonable based on typical stale-listing flexibility.
Risks & watch-outs
- Climate carrying-cost: severe wind risk, 99% chance of damaging wind over 30y; extreme-heat days projected 7→27/yr by 2055 (HVAC capex compounding) — expect insurance premiums to compound above CPI over the hold.
Questions for the listing agent
- It's been on market 258 days. Have you received any prior offers? Is the seller open to a 12% concession, seller financing, or rate buy-down credit?
- Built in 1970 — when were the roof, HVAC, electrical panel, plumbing, and water heater last replaced?
- What does the HOA fee cover, when was the last increase, and are there any pending special assessments or reserve-fund shortfalls?
- Any open or pending special assessments — roof, HVAC, plumbing, elevator, façade? What's the per-unit balance and payoff schedule, and is the seller paying it off at close or rolling it to the buyer?
- Why hasn't it sold? Are there any deal-killer items the seller is aware of (foundation, flood, title, zoning, code violations)?
- Is there a deadline driving the sale (1031 exchange, divorce, estate, relocation)? That informs how much negotiation room exists.
- Crime grade is D in this area — have there been break-ins, vandalism, or insurance claims at this property in the last 3 years? What carrier currently insures it and at what premium?
- What's the average days-on-market for RENTAL listings here right now (not sales)? A rising rental-DOM trend means longer vacancies and softer asking-rent achievability than the comps imply.
- What's the recent tenant-quality profile in this submarket — average credit score on applications, eviction rate, late-payment / NSF rate, and stable-employment percentage? A property-management company in the area should have these aggregated.
- How much new apartment / multifamily construction is in the pipeline within 1–3 miles? Heavy new supply (>2% of stock underway) typically softens rents 12–24 months out; light construction supports rent growth.
Investment metrics
- 1% rule
- 1.14% ✓
- Cap rate
- 7.83%
- Cash-on-cash
- 5.49%
- DSCR
- 1.24
- GRM
- 7.3
CMA / ARV
No comps found within radius.
Projected returns pro-forma
-3.0% appreciation · 3.64% rent growth · sell at horizon
- IRR
- -6.9%
- Equity multiple
- 0.74×
- Total profit
- $-15,929
- Equity at exit
- $32,803
- IRR
- 3.6%
- Equity multiple
- 1.27×
- Total profit
- $16,562
- Equity at exit
- $19,022
Cash invested: $61,600 (down + closing). Projections, not guarantees.
Landlord ↔ Tenant lean methodology
- Overall (STATE)
- 87 Strongly Landlord-Friendly
- State Florida
- 87 Strongly Landlord-Friendly · R+3
- County
- — inherits STATE
- City
- — inherits STATE
ZIP-level market 33435
- Rents YoY
- 3.6%
- Active inventory
- 536
- Price-to-rent
- 7.3×
Monthly cashflow live
- Estimated rent
- $2,498 high interval (Pro) →
- Mortgage (P&I)
- −$1,154
- Tax from tax record
- −$45 /mo · $537/yr
- Insurance
- −$92
- HOA
- −$401
- Vacancy / Maint / Mgmt
- −$524
- Net cashflow
- $282
Break-even live
UW: 25.0% down · 7.5% · 30yr · 1.5% tax · 5.0% vac · 8.0% maint · 8.0% mgmt
Financing live
Cash to close
- Down payment
- $55,000
- Closing costs
- $6,600
- Reserves months
- —
- Total cash needed
- —
Loan-product check · same deal, 3 products live
Conventional
25% down · 7.5% · 30yr
- Down + closing
- —
- Monthly P&I
- —
- Monthly cashflow
- —
- DSCR
- —
- Eligible?
- —
Personal DTI + credit; lowest rate.
DSCR
20% down · 8.5% · 30yr
- Down + closing
- —
- Monthly P&I
- —
- Monthly cashflow
- —
- DSCR
- —
- Eligible?
- —
No personal income docs; deal must DSCR.
Hard money
10% down · 12.0% · 12mo
- Down + closing
- —
- Monthly P&I
- —
- Monthly cashflow
- —
- DSCR
- —
- Eligible?
- —
Short-term bridge; refi at stabilization.
Rent comps 40 comps
| Address | Beds | Baths | Sqft | Rent | $/sqft | DOM | Units | Dist |
|---|---|---|---|---|---|---|---|---|
| 255 South Blvd Unit D Boynton Beach, FL | 2.0 | 2.0 | 1104 | $2,100 | $1.90 | 24d | 1 | 0.07mi |
| 255 South Blvd Unit D Boynton Beach, FL | 2.0 | 2.0 | 1104 | $1,975 | $1.79 | 3d | 1 | 0.07mi |
| 200 Main Blvd Unit 2D Boynton Beach, FL | 2.0 | 2.0 | 1104 | $1,200 | $1.09 | 16d | 1 | 0.45mi |
| 226 SW 13th Ave Unit 226 Boynton Beach, FL | 3.0 | 2.0 | 1284 | $3,999 | $3.11 | 24d | 1 | 0.46mi |
| 301 SE 21st Ave Boynton Beach, FL | 3.0 | 2.0 | 986 | $2,650 | $2.69 | 24d | 1 | 0.54mi |
| 405 SE 20th Ave Unit 12E Boynton Beach, FL | 2.0 | 1.0 | 975 | $1,889 | $1.94 | 24d | 1 | 0.57mi |
| 2861 S Seacrest Blvd Boynton Beach, FL | 1.0 | 1.0 | 710 | $1,680 | $2.37 | 2d | 3 | 0.61mi |
| 2309 SE 3rd St Unit 204 Boynton Beach, FL | 2.0 | 2.0 | 1150 | $1,850 | $1.61 | 24d | 1 | 0.63mi |
| 2309 SE 3rd St Unit 204 Boynton Beach, FL | 2.0 | 2.0 | 1150 | $1,850 | $1.61 | 4d | 1 | 0.63mi |
| 100 Newlake Dr Boynton Beach, FL | 1.0–3.0 | 1.0–2.0 | 1261 | $2,502 | $1.98 | 1d | 22 | 0.64mi |
| 405 SE 20th Ave Apt 1C Boynton Beach, FL | 2.0 | 1.0 | 975 | $1,949 | $2.00 | 24d | 1 | 0.65mi |
| 405 SE 20th Ave Unit 6D Boynton Beach, FL | 2.0 | 1.0 | 975 | $1,889 | $1.94 | 7d | 1 | 0.65mi |
| 1575 SW 8th St Boynton Beach, FL | 1.0–3.0 | 1.0–2.0 | 1104 | $2,286 | $2.07 | 2d | 25 | 0.65mi |
| 127 SW 10th Ave Boynton Beach, FL | 2.0 | 1.5 | 754 | $3,500 | $4.64 | 15d | 1 | 0.68mi |
| 515 SE 20th Ave Boynton Beach, FL | 2.0 | 1.0 | 787 | $1,889 | $2.40 | 7d | 3 | 0.71mi |
| 1915 SW 17th Ave Boynton Beach, FL | 3.0 | 2.0 | 1317 | $2,990 | $2.27 | 17d | 1 | 0.72mi |
| 523 SE 20th Ct Unit 5 Boynton Beach, FL | 1.0 | 1.0 | 755 | $1,750 | $2.32 | 24d | 1 | 0.73mi |
| 176 SE 27th Pl Boynton Beach, FL | 3.0 | 2.0 | 1170 | $3,800 | $3.25 | 24d | 1 | 0.74mi |
| 2001 W Woolbright Rd Unit F204 Boynton Beach, FL | 2.0 | 2.0 | 986 | $1,975 | $2.00 | 24d | 1 | 0.74mi |
| 3302 Tuscany Way Boynton Beach, FL | 2.0 | 1.0 | 933 | $2,900 | $3.11 | 24d | 1 | 0.82mi |
| 140 SE 9th Ave Boynton Beach, FL | 3.0 | 2.0 | 1292 | $3,250 | $2.52 | 16d | 1 | 0.82mi |
| 140 SE 9th Ave Unit 140 Boynton Beach, FL | 3.0 | 2.0 | 1292 | $3,250 | $2.52 | 14d | 1 | 0.82mi |
| 140 SE 9th Ave Boynton Beach, FL | 3.0 | 2.0 | 1292 | $3,000 | $2.32 | 7d | 1 | 0.82mi |
| 1351 S Federal Hwy Boynton Beach, FL | 1.0–3.0 | 1.0–2.0 | 1394 | $3,046 | $2.18 | 1d | 32 | 0.83mi |
| 3408 Tuscany Way Boynton Beach, FL | 3.0 | 2.0 | 1293 | $3,500 | $2.71 | 22d | 1 | 0.83mi |
| 113 SE 8th Ave Boynton Beach, FL | 3.0 | 2.0 | 1002 | $3,050 | $3.04 | 22d | 1 | 0.84mi |
| 2120 Tuscany Way Boynton Beach, FL | 2.0 | 2.0 | 1017 | $2,650 | $2.61 | 24d | 1 | 0.85mi |
| 2220 Tuscany Way Unit 2220 Boynton Beach, FL | 2.0 | 2.0 | 1030 | $2,850 | $2.77 | 24d | 1 | 0.85mi |
| 2417 Tuscany Way Unit 2417 Boynton Beach, FL | 2.0 | 2.0 | 1131 | $3,500 | $3.09 | 24d | 1 | 0.85mi |
| 1302 Tuscany Way Boynton Beach, FL | 3.0 | 2.0 | 1328 | $3,800 | $2.86 | 5d | 1 | 0.85mi |
| 1107 Villa Cir #1107 Boynton Beach, FL | 3.0 | 2.0 | 1233 | $2,400 | $1.95 | 5d | 1 | 0.85mi |
| 2412 Tuscany Way Boynton Beach, FL | 1.0 | 1.0 | 750 | $3,000 | $4.00 | 24d | 1 | 0.86mi |
| 2016 S Federal Hwy #206 Boynton Beach, FL | 2.0 | 2.0 | 963 | $2,300 | $2.39 | 24d | 1 | 0.86mi |
| 2016 S Federal Hwy #404 Boynton Beach, FL | 2.0 | 2.0 | 963 | $2,300 | $2.39 | 15d | 1 | 0.86mi |
| 2016 S Federal Hwy #204 Boynton Beach, FL | 2.0 | 2.0 | 963 | $1,995 | $2.07 | 7d | 1 | 0.86mi |
| 1106 Tuscany Way Boynton Beach, FL | 2.0 | 2.0 | 1137 | $2,200 | $1.93 | 24d | 1 | 0.87mi |
| 1106 Tuscany Way Boynton Beach, FL | 2.0 | 2.0 | 1137 | $2,500 | $2.20 | 5d | 1 | 0.87mi |
| 2006 S Federal Hwy #401 Boynton Beach, FL | 2.0 | 2.0 | 963 | $2,400 | $2.49 | 24d | 1 | 0.87mi |
| 615 Villa Cir Boynton Beach, FL | 2.0 | 2.0 | 1008 | $2,500 | $2.48 | 24d | 1 | 0.87mi |
| 2408 Tuscany Way #2408 Boynton Beach, FL | 3.0 | 2.0 | 1293 | $4,900 | $3.79 | 5d | 1 | 0.87mi |
HOA detail condo
- Monthly dues
- $401 · $4,812/yr
- Likely covers
- security
- Assessments
- None detected in remarks — confirm with the listing agent.
Listing history 13 events
-
2026-06-18days on market $220,000 Active 258 DOM
-
2026-06-17days on market $220,000 Active 257 DOM
-
2026-06-16days on market $220,000 Active 256 DOM
-
2026-06-15days on market $220,000 Active 255 DOM
-
2026-06-13days on market $220,000 Active 253 DOM
-
2026-06-09days on market $220,000 Active 249 DOM
-
2026-06-07days on market $220,000 Active 247 DOM
-
2026-06-04days on market $220,000 Active 244 DOM
-
2026-06-03days on market $220,000 Active 243 DOM
-
2026-06-01days on market $220,000 Active 241 DOM
-
2026-05-31days on market $220,000 Active 240 DOM
-
2026-01-23price $220,000
-
2025-10-03$245,000 Active
ⓘ Source: listings_history table (triggers on properties + properties_extension) + one-shot
backfill from property_details.listing_events for pre-trigger history.
Tax reassessment forecast FL · Resets to sale price
- Current annual tax
- $537 · $45/mo
- Projected year-2 tax
- $1,826 · $152/mo
- Expected delta
- +$1,289/yr (+$107/mo · 239.9%)
ⓘ Screening estimate from a state-policy table — verify with the county assessor before closing.
Climate risk First Street
- Flood 1/10 Low FEMA zone X (unshaded) · 0% chance over 30 yrs
- Wildfire 1/10 Low
- Heat 10/10 Extreme 7 d/yr ≥105°F today · 27 d/yr by 30 yrs out
- Wind 10/10 Extreme 99% chance of damaging wind over 30 yrs
- Air quality 2/10 Low 1 unhealthy d/yr today · 2 by 30 yrs out
Nearby sold comps map
Loading sold comps map…
Walkable amenities ~0.75 mi
Loading nearby amenities…
Taxation est. · year 1
- Rental income
- $29,971
- − Mortgage interest
- −$12,323
- − Property taxes
- −$537
- − Insurance
- −$1,100
- − Repairs & maintenance
- −$2,398
- − Management
- −$2,398
- − HOA
- −$4,812
- − Depreciation
- −$6,400
- Taxable income
- $3
- Est. tax owed @ 24.0%
- −$1
- After-tax cash flow
- $3,383/yr
For passive investors: Depreciation is non-cash, so a rental often shows a tax loss while cash-flowing — sheltering income. Rental losses are passive: they offset passive income freely, and up to $25,000/yr can offset ordinary (W-2) income if you actively participate and your MAGI is under $100k (phasing out to $0 by $150k); unused losses carry forward. On sale, claimed depreciation is recaptured at up to 25%, and gains may owe capital-gains tax (a 1031 exchange can defer both). Figures are a year-1 estimate at your 24.0% rate — not tax advice; consult a CPA.
Schools (NCES district)
- District
- Palm Beach
- NCES district ID
- 1201500
- Math proficiency
- 46% ▼ -16.00%
- Reading proficiency
- 53% ▼ -4.00%
- Median HH income
- $53,943
- Composite
- 42.72/100
- National rank
- #3160
- State rank
- #34 of 73 in FL
Livability — Boynton Beach
- Score
- 72/100
- State rank
- #351
- US rank
- #6098
Category grades
Schools grade is shown separately in the Schools card above.
Census & demographics
- Census place
- Boynton Beach, FL
- County
- Palm Beach County · 1,438,312 people
- City population
- 148,060
- Metro
- Miami-Fort Lauderdale-Pompano Beach, FL
- Population (ZIP)
- 37,833
- Household income
- $67,979
- Rent vs Own
- Severe rent burden
- 1623.0
Population outlook (Palm Beach County) Hauer SSP2
- Today (2025)
- 1,637,487 people
- By 2030
- 1,743,255 · +6.5%
- By 2040
- 1,948,712 · +19.0%
- By 2050
- 2,132,979 · +30.3%
- By 2075
- 2,530,027 · +54.5%
- By 2100
- 2,706,979 · +65.3%
Race, ethnicity, and origin ACS 2023
- Neighborhood character
- Diverse neighborhood (Simpson 0.65)
- Race & ethnicity
- White 41% Black 40% Hispanic / Latino 15% Two or more races 10%
- Hispanic origin (detail)
- Mexican 3% Puerto Rican 3% Cuban 2% Dominican 1%
- Common ancestry
- Hispanic 23% Romanian 2% Lithuanian 2%
- Foreign-born
- 30% · Canada, Jamaica
- Languages at home
- 61% English-only · French/Haitian/Cajun 24% Spanish 11% Other Indo-European 2%
Political lean MEDSL · Palm Beach
- 2024 margin
- Toss-up / Even · D 50.0% · R 49.2%
- 2008→2024 swing
- -22.1pp toward R · 2008: 22.9pp · 2024: 0.8pp
- All cycles
- 2024: D+0.8 2020: D+12.8 2016: D+15.3 2012: D+17.0 2008: D+22.9
Not yet ingested
- Civics
- —
Market trends
- HPI YoY
- ▼ -345.86%
- Current HPI
- 371.0527
- Rent YoY
- ▲ 3.64%
- Metro
- Miami-Fort Lauderdale-Pompano Beach, FL
- State GDP YoY
- ▲ 3.28%
- F500 in state
- 36
Industry mix (Fortune 500 HQ in FL)
| Industry | F500 HQs | Revenue |
|---|---|---|
| Industrial Technology | 2 | $29B |
|
||
| Insurance | 2 | $17B |
|
||
| Retail | 1 | $60B |
|
||
| Technology Distribution | 1 | $58B |
|
||
| Homebuilding | 1 | $35B |
|
||
| Technology Manufacturing | 1 | $35B |
|
||
Price history
-10.2% since first listed2 events — show timeline
- 2026-01-23 Price Changed $220,000 MARMLS
- 2025-10-03 Listed $245,000 MARMLS
Property tax history
+3.0%/yrLatest (2025): $537 · +6.1% YoY. Source: county tax records.
Cash-flow waterfall
monthlySold comps — $/sqft
last 12 mo · ≤1 miLoading sold comps…