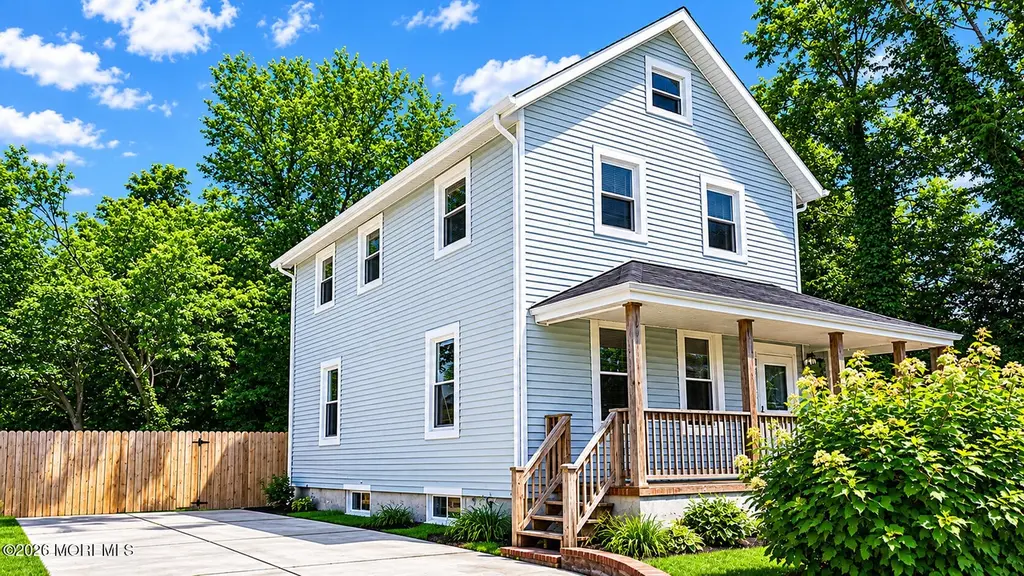
236 Seaview Ave · Long Branch, NJ
Flood risk 3/10 · Minor
- FEMA flood zone
- X (shaded)
- Chance of flooding over 30 yrs
- 0.12%
- Est. flood insurance / yr
- $473 – $860
Fire risk 1/10 · Minimal
- Est. fire insurance / yr
- $526 – $976
Heat risk 7/10 · Major
- Hot days now (above 93°F)
- 7 days/yr
- Hot days in 30 yrs
- 16 days/yr
Wind risk 8/10 · Major
- Chance of severe wind over 30 yrs
- 80.0%
Air-quality risk 3/10 · Minor
- Unhealthy air days now
- 3 days/yr
- Unhealthy air days in 30 yrs
- 4 days/yr
Risk factors via First Street. Map © Google.
Why this score? — see what drove the B+ grade
The composite is a weighted blend of 9 inputs, each scored 0–100. Each bar is that input's sub-score; the figure is the points it added to the 100-point composite (weight × sub-score).
- Cash flow +30.0/30.0
- ARV discount +15.0/15.0
- 1% rule +10.0/10.0
- DSCR +10.0/10.0
- Livability +3.6/5.0
- Rent growth +3.5/5.0
- Condition / age +2.5/5.0
- Schools +1.5/10.0
- Appreciation +0.0/10.0
$399,000
🖨 Deal sheet 📄 Offer letter ✓ Due diligence
Listing remarks MLS
Investor Special - Prime Long Branch Location! 100-year-old 4BR Colonial just 3 blocks from the beach and Seven Presidents Beach. Sold AS-IS and priced to reflect full renovation needs. Ideal for investors, builders, or flippers looking for strong upside in a highly desirable coastal area. Rare opportunity to renovate, rebuild, or capitalize on location-driven value. Bring your vision--this property won't last! Additional features include a 2-car driveway and a basement. Ideally located just minutes from beaches, the Garden State Parkway, Monmouth University, Monmouth Park, shopping, dining, and more. Don't miss this fantastic opportunity--schedule your showing today!
Key facts
- 6,098 sq ft lot
- Built 1920
- Listed 8 days
Property features AI
Exterior
- Parking: No garage spaces
- Utilities: Public sewer
- Home design: Property located in Long Branch, Monmouth County
- Exterior features: Shingle roof
Interior
- Bedrooms: 4 bedrooms
- Bathrooms: 2 full bathrooms and 1 half bathroom (total 3 fixtures configured as 2.5 baths)
- Heating & cooling: Forced air heating; No central air
- Interior features: No fireplaces; Unfinished basement with Bilco-style doors
Neighborhood map
What this means for you Summary
Snapshot
- This is a 4-bed/1.5-bath single-family listed at $399k.
Deal economics
- At list price, monthly cash flow is $2k ($24k/yr) — positive.
- The deal already cash-flows at list — no discount required.
- Meets the 1% rule at list price ($6k rent vs $399k).
- Cap rate 12.4% vs local median 0.3% in Long Branch — top-decile yield for the area; either an underpriced asset or a hidden risk that comps aren't pricing in. Stress-test before assuming the spread holds.
Location & tenants
- Location reads 71/100 on livability (#243 in NJ) — a middle-class / working-renter tenant base. Strengths: health & safety A-; Watch: amenities C-, schools D+, cost of living F.
- Long Branch Public School District (suburban): math 8% / reading 26% proficiency, ranked #445 of 472 in NJ (top 94%) — low school quality limits family demand, transient renter base, plan for 1-2y turnover; 70% free/reduced lunch — lower-income household profile, screen leases tightly.
- Market conditions: Rents rising (+3.9%/yr); 247 active listings in the ZIP; 15 comparable units currently listed for rent nearby; rentals leasing fast (median 8d on market — plan ~1-2 weeks tenant-placement turnaround); solid renter incomes; 2,840 units permitted in Monmouth County in 2024 (484 in 5+ unit buildings).
- At $6,070/mo this rent would consume 91% of the median local household income ($80k/yr) (locally 2347% of renters already pay >50% of income on rent) — very limited rent-growth headroom before tenants either downsize or default.
Forward outlook
- Local home prices are declining (-3.0%/yr); year-one equity from $3k of loan paydown is wiped out by about $12k of value loss. Plan a longer hold.
- Monmouth County population projected at -11% by 2050 — secular population decline; favor cash flow + early exit over multi-decade hold.
- At projected returns (-3.0% appreciation + 3.9% rent growth), your $112k cash investment doubles in ~6 years — after that, you're playing with house money.
Negotiation context
- Only 8 days on market — expect competitive offers; lowballing is unlikely to land.
- 5 sale attempts since 16y ago with the ask held roughly flat each time — persistent listings suggest the price (not the market) is what's stuck; bring a comps-based counter.
- Current owner paid $325k; 23% above their basis — modest negotiation headroom, anchor on the comps not their cost.
Risks & watch-outs
- Watch-outs: built in 1920 — expect roof / HVAC / electrical / plumbing capex.
- Climate carrying-cost: severe wind risk, 80% chance of damaging wind over 30y; extreme-heat days projected 7→16/yr by 2055 (HVAC capex compounding) — expect insurance premiums to compound above CPI over the hold.
Questions for the listing agent
- Built in 1920 — when were the roof, HVAC, electrical panel, plumbing, and water heater last replaced?
- Is there a deadline driving the sale (1031 exchange, divorce, estate, relocation)? That informs how much negotiation room exists.
- Schools are D-rated, which usually means shorter tenancies and higher turnover. Who's the typical renter profile here, and what's been the actual vacancy rate?
- What's the average days-on-market for RENTAL listings here right now (not sales)? A rising rental-DOM trend means longer vacancies and softer asking-rent achievability than the comps imply.
- What's the recent tenant-quality profile in this submarket — average credit score on applications, eviction rate, late-payment / NSF rate, and stable-employment percentage? A property-management company in the area should have these aggregated.
- How much new for-sale + rental construction is in the pipeline within 1–3 miles? Heavy new supply typically softens prices + rents 12–24 months out; constrained supply supports both.
Investment metrics
- 1% rule
- 1.52% ✓
- Cap rate
- 12.40%
- Cash-on-cash
- 21.82%
- DSCR
- 1.97
- GRM
- 5.5
CMA / ARV
- ARV (on-the-fly)
- $486,392
- Comps found
- 10
Show comp detail 10 sales within ~0.75 mi
| Address | Dist | Beds/Ba | Sqft | Sold | Price | $/sf | Match |
|---|---|---|---|---|---|---|---|
| 236 Seaview Ave | 0.00mi | 4/1.5 | 1,304 (0%) | 1mo | $325,000 | $249 | 99 |
| 128 Sampson Pl | 0.25mi | 4/2.5 | 1,452 (+11%) | 1mo | $599,000 | $413 | 64 |
| 142 Rosewood Ave | 0.35mi | 3/1.5 (-1) | 1,392 (+7%) | 11mo | $465,000 | $334 | 58 |
| 188 Chelton Ave | 0.36mi | 3/2.0 (-1) | 1,170 (-10%) | 6mo | $605,000 | $517 | 54 |
| 342 Macarthur Ave | 0.42mi | 3/1.0 (-1) | 1,416 (+9%) | 8mo | $800,000 | $565 | 53 |
| 14 Slocum Pl | 0.55mi | 3/1.0 (-1) | 1,440 (+10%) | 4mo | $357,000 | $248 | 47 |
| 290 N 5th Ave | 0.51mi | 4/2.0 | 1,424 (+9%) | 18mo | $515,000 | $362 | 44 |
| 126 Seaview Ave | 0.23mi | 3/2.0 (-1) | 1,132 (-13%) | 21mo | $689,000 | $609 | 43 |
| 127 7th Ave | 0.55mi | 3/1.0 (-1) | 1,476 (+13%) | 8mo | $550,000 | $373 | 38 |
| — | 0.51mi | 3/2.0 (-1) | 1,476 (+13%) | 20mo | $265,000 | $180 | 30 |
Match score weights: distance 35% · size 25% · config 20% · recency 20%. Top-matched comps best support the ARV.
Projected returns pro-forma
-3.0% appreciation · 3.91% rent growth · sell at horizon
- IRR
- 15.5%
- Equity multiple
- 1.63×
- Total profit
- $70,448
- Equity at exit
- $59,492
- IRR
- 24.9%
- Equity multiple
- 3.25×
- Total profit
- $251,798
- Equity at exit
- $34,498
Cash invested: $111,720 (down + closing). Projections, not guarantees.
Landlord ↔ Tenant lean methodology
- Overall (STATE)
- 21 Tenant-Leaning
- State New Jersey
- 21 Tenant-Leaning · D+6
- County
- — inherits STATE
- City
- — inherits STATE
ZIP-level market 07740
- Rents YoY
- 3.9%
- Active inventory
- 247
- Price-to-rent
- 5.5×
Monthly cashflow live
- Estimated rent
- $6,070 high interval (Pro) →
- Mortgage (P&I)
- −$2,092
- Tax from tax record
- −$505 /mo · $6,058/yr
- Insurance
- −$166
- HOA
- −$0
- Vacancy / Maint / Mgmt
- −$1,275
- Net cashflow
- $2,032
Break-even live
UW: 25.0% down · 7.5% · 30yr · 1.5% tax · 5.0% vac · 8.0% maint · 8.0% mgmt
Financing live
Cash to close
- Down payment
- $99,750
- Closing costs
- $11,970
- Reserves months
- —
- Total cash needed
- —
Loan-product check · same deal, 3 products live
Conventional
25% down · 7.5% · 30yr
- Down + closing
- —
- Monthly P&I
- —
- Monthly cashflow
- —
- DSCR
- —
- Eligible?
- —
Personal DTI + credit; lowest rate.
DSCR
20% down · 8.5% · 30yr
- Down + closing
- —
- Monthly P&I
- —
- Monthly cashflow
- —
- DSCR
- —
- Eligible?
- —
No personal income docs; deal must DSCR.
Hard money
10% down · 12.0% · 12mo
- Down + closing
- —
- Monthly P&I
- —
- Monthly cashflow
- —
- DSCR
- —
- Eligible?
- —
Short-term bridge; refi at stabilization.
Rent comps 15 comps
| Address | Beds | Baths | Sqft | Rent | $/sqft | DOM | Units | Dist |
|---|---|---|---|---|---|---|---|---|
| 132 Sampson Pl Long Branch, NJ | 4.0 | 2.0 | 1570 | $9,500 | $6.05 | 24d | 1 | 0.28mi |
| 68 Berry Pl Long Branch, NJ | 3.0 | 2.0 | 1428 | $3,200 | $2.24 | 3d | 1 | 0.43mi |
| 132 Chelton Ave Long Branch, NJ | 4.0 | 2.5 | 1828 | $3,900 | $2.13 | 7d | 1 | 0.45mi |
| 81 Berry Pl Long Branch, NJ | 4.0 | 1.5 | 1562 | $12,000 | $7.68 | 24d | 1 | 0.45mi |
| 190 Spruce St #10 Long Branch, NJ | 4.0 | 1.5 | 1690 | $3,200 | $1.89 | 17d | 1 | 0.50mi |
| 179 Chelsea Ave Long Branch, NJ | 2.0–3.0 | 2.0 | 1115 | $5,300 | $4.75 | 1d | 6 | 0.58mi |
| 153 Atlantic Ave Long Branch, NJ | 3.0 | 2.0 | 1500 | $3,675 | $2.45 | 7d | 1 | 0.65mi |
| 50 Chelsea Ave Long Branch, NJ | 3.0 | 1.0–2.0 | 1118 | $6,286 | $5.62 | 1d | 34 | 0.68mi |
| 487 West St Long Branch, NJ | 3.0 | 2.0 | 1536 | $4,200 | $2.73 | 2d | 1 | 0.86mi |
| 102 Columbia Ave Long Branch, NJ | 3.0 | 1.0 | 1328 | $11,000 | $8.28 | 1d | 1 | 0.90mi |
| 607 McClellan St Long Branch, NJ | 3.0 | 1.5 | 1344 | $25,000 | $18.60 | 10d | 1 | 1.00mi |
| 607 McClellan St Long Branch, NJ | 3.0 | 2.5 | 1344 | $4,200 | $3.12 | 1d | 1 | 1.00mi |
| 8 Arthur Ave Long Branch, NJ | 3.0 | 2.0 | 1648 | $7,000 | $4.25 | 19d | 1 | 1.03mi |
| 350 Ocean Ave #403 Long Branch, NJ | 3.0 | 3.0 | 1751 | $20,000 | $11.42 | 7d | 1 | 1.14mi |
| 44 Norwood Ave Long Branch, NJ | 3.0 | 1.0 | 1226 | $3,275 | $2.67 | 12d | 1 | 1.18mi |
Listing history 7 events
-
2026-06-13statusdays on market $399,000 Pending 8 DOM
-
2026-06-09days on market $399,000 Active 7 DOM
-
2026-06-08days on market $399,000 Active 6 DOM
-
2026-06-07days on market $399,000 Active 5 DOM
-
2026-06-04days on market $399,000 Active 2 DOM
-
2026-06-02remarks 699-char remark
-
2026-06-02$399,000 Active 1 DOM
ⓘ Source: listings_history table (triggers on properties + properties_extension) + one-shot
backfill from property_details.listing_events for pre-trigger history.
Tax reassessment forecast NJ · Partial reset (capped growth)
- Current annual tax
- $6,058 · $505/mo
- Projected year-2 tax
- $7,997 · $666/mo
- Expected delta
- +$1,938/yr (+$162/mo · 32.0%)
ⓘ Screening estimate from a state-policy table — verify with the county assessor before closing.
Climate risk First Street
- Flood 3/10 Moderate FEMA zone X (shaded) · 12% chance over 30 yrs
- Wildfire 1/10 Low
- Heat 7/10 Severe 7 d/yr ≥93°F today · 16 d/yr by 30 yrs out
- Wind 8/10 Severe 80% chance of damaging wind over 30 yrs
- Air quality 3/10 Moderate 3 unhealthy d/yr today · 4 by 30 yrs out
Nearby sold comps map
Loading sold comps map…
Walkable amenities ~0.75 mi
Loading nearby amenities…
Taxation est. · year 1
- Rental income
- $72,839
- − Mortgage interest
- −$22,350
- − Property taxes
- −$6,058
- − Insurance
- −$1,995
- − Repairs & maintenance
- −$5,827
- − Management
- −$5,827
- − Depreciation
- −$11,607
- Taxable income
- $19,174
- Est. tax owed @ 24.0%
- −$4,602
- After-tax cash flow
- $19,779/yr
For passive investors: Depreciation is non-cash, so a rental often shows a tax loss while cash-flowing — sheltering income. Rental losses are passive: they offset passive income freely, and up to $25,000/yr can offset ordinary (W-2) income if you actively participate and your MAGI is under $100k (phasing out to $0 by $150k); unused losses carry forward. On sale, claimed depreciation is recaptured at up to 25%, and gains may owe capital-gains tax (a 1031 exchange can defer both). Figures are a year-1 estimate at your 24.0% rate — not tax advice; consult a CPA.
Schools (NCES district)
- District
- Long Branch Public School District
- NCES district ID
- 3408940
- Math proficiency
- 8% ▼ -18.00%
- Reading proficiency
- 26% ▼ -8.00%
- Median HH income
- $51,405
- Composite
- 15.49/100
- National rank
- #9307
- State rank
- #445 of 472 in NJ
Livability — Long Branch
- Score
- 71/100
- State rank
- #243
- US rank
- #6700
Category grades
Schools grade is shown separately in the Schools card above.
Census & demographics
- Census place
- Long Branch, NJ
- County
- Monmouth County · 505,557 people
- City population
- 32,917
- Metro
- New York-Newark-Jersey City, NY-NJ-PA
- Population (ZIP)
- 32,917
- Household income
- $79,870
- Rent vs Own
- Severe rent burden
- 2347.0
Population outlook (Monmouth County) Hauer SSP2
- Today (2025)
- 620,308 people
- By 2030
- 612,309 · -1.3%
- By 2040
- 587,297 · -5.3%
- By 2050
- 551,342 · -11.1%
- By 2075
- 472,934 · -23.8%
- By 2100
- 381,534 · -38.5%
Race, ethnicity, and origin ACS 2023
- Neighborhood character
- Diverse neighborhood (Simpson 0.65)
- Race & ethnicity
- White 54% Hispanic / Latino 23% Two or more races 12% Black 11% Native American 2% Asian 2%
- Hispanic origin (detail)
- Mexican 9% Puerto Rican 6%
- Common ancestry
- Estonian 10% Russian 3% Scotch-Irish 2%
- Foreign-born
- 26% · Canada, Jamaica, China
- Languages at home
- 65% English-only · Spanish 17% Other Indo-European 15% Russian/Polish/Slavic 1%
Political lean MEDSL · Monmouth
- 2024 margin
- R (+11.4) · D 43.4% · R 54.8% · Other 1.8%
- 2008→2024 swing
- -7.7pp toward R · 2008: -3.7pp · 2024: -11.4pp
- All cycles
- 2024: R+11.4 2020: R+2.8 2016: R+9.5 2012: R+5.5 2008: R+3.7
Not yet ingested
- Civics
- —
Market trends
- HPI YoY
- ▼ -655.16%
- Current HPI
- 405.7286
- Rent YoY
- ▲ 3.91%
- Metro
- New York-Newark-Jersey City, NY-NJ-PA
- State GDP YoY
- ▲ 2.05%
- F500 in state
- 34
Industry mix (Fortune 500 HQ in NJ)
| Industry | F500 HQs | Revenue |
|---|---|---|
| Consumer Goods | 3 | $31B |
|
||
| Pharmaceuticals | 2 | $153B |
|
||
| Technology | 2 | $21B |
|
||
| Insurance | 2 | $20B |
|
||
| Healthcare | 2 | $19B |
|
||
| Financial Services | 1 | $70B |
|
||
Price history
+543.5% since first listed12 events — show timeline
- 2026-06-02 Listed $399,000 MOMLS
- 2026-05-14 Sold (MLS) $325,000 MOMLS
- 2026-04-15 Pending — MOMLS
- 2026-04-01 Price Changed $470,000 MOMLS
- 2026-04-01 Relisted — MOMLS
- 2026-03-18 Pending — MOMLS
- 2026-01-13 Listed $570,000 MOMLS
- 2021-05-19 Delisted — MOMLS
- 2021-03-18 Pending — MOMLS
- 2021-02-08 Listed $290,000 MOMLS
- 2010-05-24 Listed $165,000 MOMLS
- 1994-08-09 Sold (Public Records) $62,000 Public Records
Property tax history
+4.9%/yrLatest (2025): $6,058 · +17.6% YoY. Source: county tax records.
Cash-flow waterfall
monthlySold comps — $/sqft
last 12 mo · ≤1 miLoading sold comps…