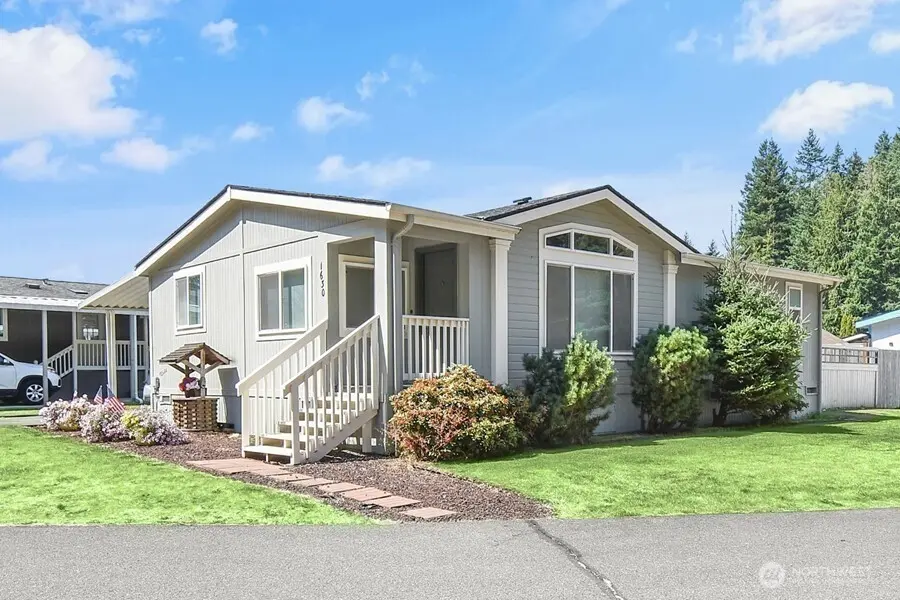
1630 Kimberly Ave · Enumclaw, WA
Flood risk 1/10 · Minimal
- FEMA flood zone
- X (unshaded)
- Chance of flooding over 30 yrs
- 0.0%
- Est. flood insurance / yr
- $507 – $1,088
Fire risk 3/10 · Minor
- Est. fire insurance / yr
- $604 – $1,122
Heat risk 2/10 · Minimal
- Hot days now (above 84°F)
- 7 days/yr
- Hot days in 30 yrs
- 16 days/yr
Wind risk 1/10 · Minimal
- Chance of severe wind over 30 yrs
- —
Air-quality risk 6/10 · Moderate
- Unhealthy air days now
- 10 days/yr
- Unhealthy air days in 30 yrs
- 12 days/yr
Risk factors via First Street. Map © Google.
Why this score? — see what drove the A- grade
The composite is a weighted blend of 9 inputs, each scored 0–100. Each bar is that input's sub-score; the figure is the points it added to the 100-point composite (weight × sub-score).
- Cash flow +30.0/30.0
- ARV discount +15.0/15.0
- 1% rule +10.0/10.0
- DSCR +10.0/10.0
- Schools +5.5/10.0
- Livability +4.4/5.0
- Rent growth +3.6/5.0
- Condition / age +2.8/5.0
- Appreciation +0.0/10.0
$149,900
🖨 Deal sheet 📄 Offer letter ✓ Due diligence
Listing remarks
Love where you live in this well cared for manufactured double wide home built in 1992. Crystalaire Mobile Home Park is a 55+ community. This corner lot property boast 2 spacious bedrooms, an open concept kitchen to living room area, covered carport, and a well cared for out building for storage. 1200 sq feet, corner lot, fenced yard and oodles of storage space. See this property today.
Key facts
- Open concept kitchen
- Fenced yard
- Covered carport
Tags
Neighborhood map
What this means for you Summary
Snapshot
- This is a 2-bed/2.0-bath manufactured listed at $150k. Condition is rated average.
Deal economics
- At list price, monthly cash flow is $756 ($9k/yr) — positive.
- The deal already cash-flows at list — no discount required.
- Meets the 1% rule at list price ($2k rent vs $150k).
- Recommended offer: $132k (12.0% below list) — sets the bar for market timing.
- Cap rate 12.3% vs local median 2.4% in Enumclaw — top-decile yield for the area; either an underpriced asset or a hidden risk that comps aren't pricing in. Stress-test before assuming the spread holds.
Location & tenants
- Location reads 88/100 on livability (#12 in WA, #222 nationally) — a professional / high-income tenant draw. Strengths: crime A+, amenities A+, housing A+; Watch: cost of living D-.
- Enumclaw School District (suburban): math 54% / reading 68% proficiency, ranked #46 of 291 in WA (top 16%) — acceptable for families but not a draw, mixed tenant base, ~2y average lease.
- Market conditions: Rents rising fast (+4.3%/yr); 223 active listings in the ZIP; 7 comparable units currently listed for rent nearby; rentals leasing fast (median 2d on market — plan ~1-2 weeks tenant-placement turnaround); high-income renter base; 10,555 units permitted in King County in 2024 (7,119 in 5+ unit buildings).
Forward outlook
- Local home prices are declining (-3.0%/yr); year-one equity from $1k of loan paydown is wiped out by about $4k of value loss. Plan a longer hold.
- King County population projected at +44% by 2050 — long-run rental-demand tailwind backs the buy-and-hold thesis.
- At projected returns (-3.0% appreciation + 4.3% rent growth), your $42k cash investment doubles in ~6 years — after that, you're playing with house money.
Negotiation context
- It's been on market 295 days — a 12% lower offer ($132k) is reasonable based on typical stale-listing flexibility.
Questions for the listing agent
- It's been on market 295 days. Have you received any prior offers? Is the seller open to a 12% concession, seller financing, or rate buy-down credit?
- Why hasn't it sold? Are there any deal-killer items the seller is aware of (foundation, flood, title, zoning, code violations)?
- Is there a deadline driving the sale (1031 exchange, divorce, estate, relocation)? That informs how much negotiation room exists.
- What's the average days-on-market for RENTAL listings here right now (not sales)? A rising rental-DOM trend means longer vacancies and softer asking-rent achievability than the comps imply.
- What's the recent tenant-quality profile in this submarket — average credit score on applications, eviction rate, late-payment / NSF rate, and stable-employment percentage? A property-management company in the area should have these aggregated.
- How much new for-sale + rental construction is in the pipeline within 1–3 miles? Heavy new supply typically softens prices + rents 12–24 months out; constrained supply supports both.
Investment metrics
- 1% rule
- 1.51% ✓
- Cap rate
- 12.35%
- Cash-on-cash
- 21.61%
- DSCR
- 1.96
- GRM
- 5.5
CMA / ARV
- ARV (median comp)
- $298,950
- List price
- $149,900
- Delta
- -49.86%
- Verdict
- UNDERPRICED
- Comps
- 18 within 1.0 mi
Show comp detail 12 sales within ~0.75 mi
| Address | Dist | Beds/Ba | Sqft | Sold | Price | $/sf | Match |
|---|---|---|---|---|---|---|---|
| 2257 Estero Ave | 0.07mi | 3/2.0 (+1) | 1,188 (-1%) | 4mo | $85,000 | $72 | 87 |
| 2311 Sunset Ave | 0.13mi | 2/2.0 | 1,056 (-12%) | 2mo | $85,000 | $80 | 72 |
| 2109 Timber St #39 | 0.32mi | 2/2.0 | 1,296 (+8%) | 2mo | $340,000 | $262 | 70 |
| 1504 Sunrise Ave | 0.12mi | 2/2.0 | 1,344 (+12%) | 12mo | $210,000 | $156 | 64 |
| 2230 Estero Ave | 0.08mi | 3/2.0 (+1) | 1,296 (+8%) | 16mo | $70,000 | $54 | 64 |
| 2259 Rincon Ave | 0.08mi | 3/2.0 (+1) | 1,344 (+12%) | 11mo | $207,500 | $154 | 62 |
| 2308 Ventura Ave | 0.19mi | 2/2.0 | 1,050 (-12%) | 11mo | $85,000 | $81 | 61 |
| 1413 Orangewood St #21 | 0.43mi | 2/2.0 | 1,342 (+12%) | 5mo | $265,000 | $197 | 56 |
| 2096 Crystal Mountain Dr | 0.30mi | 2/1.5 | 1,354 (+13%) | 14mo | $422,755 | $312 | 51 |
| 1960 Timber St #117 | 0.38mi | 2/2.0 | 1,354 (+13%) | 13mo | $384,950 | $284 | 50 |
| 28622 SE 434th St | 0.56mi | 3/2.0 (+1) | 1,296 (+8%) | 8mo | $645,000 | $498 | 49 |
| 2034 Paradise Ave #12 | 0.39mi | 2/2.0 | 1,354 (+13%) | 21mo | $390,000 | $288 | 43 |
Match score weights: distance 35% · size 25% · config 20% · recency 20%. Top-matched comps best support the ARV.
Projected returns pro-forma
-3.0% appreciation · 4.32% rent growth · sell at horizon
- IRR
- 15.7%
- Equity multiple
- 1.64×
- Total profit
- $26,947
- Equity at exit
- $22,351
- IRR
- 25.3%
- Equity multiple
- 3.35×
- Total profit
- $98,471
- Equity at exit
- $12,961
Cash invested: $41,972 (down + closing). Projections, not guarantees.
Landlord ↔ Tenant lean methodology
- Overall (STATE)
- 28 Tenant-Leaning
- State Washington
- 28 Tenant-Leaning · D+8
- County
- — inherits STATE
- City
- — inherits STATE
ZIP-level market 98022
- Rents YoY
- 4.3%
- Active inventory
- 223
- Price-to-rent
- 5.5×
Monthly cashflow live
- Estimated rent
- $2,268 high interval (Pro) →
- Mortgage (P&I)
- −$786
- Tax est. 1.5%
- −$187 /mo · $2,248/yr
- Insurance
- −$62
- HOA
- −$0
- Vacancy / Maint / Mgmt
- −$476
- Net cashflow
- $756
Break-even live
UW: 25.0% down · 7.5% · 30yr · 1.5% tax · 5.0% vac · 8.0% maint · 8.0% mgmt
Financing live
Cash to close
- Down payment
- $37,475
- Closing costs
- $4,497
- Reserves months
- —
- Total cash needed
- —
Loan-product check · same deal, 3 products live
Conventional
25% down · 7.5% · 30yr
- Down + closing
- —
- Monthly P&I
- —
- Monthly cashflow
- —
- DSCR
- —
- Eligible?
- —
Personal DTI + credit; lowest rate.
DSCR
20% down · 8.5% · 30yr
- Down + closing
- —
- Monthly P&I
- —
- Monthly cashflow
- —
- DSCR
- —
- Eligible?
- —
No personal income docs; deal must DSCR.
Hard money
10% down · 12.0% · 12mo
- Down + closing
- —
- Monthly P&I
- —
- Monthly cashflow
- —
- DSCR
- —
- Eligible?
- —
Short-term bridge; refi at stabilization.
Rent comps 7 comps
| Address | Beds | Baths | Sqft | Rent | $/sqft | DOM | Units | Dist |
|---|---|---|---|---|---|---|---|---|
| 556 Bondgard Ave E Enumclaw, WA | 3.0 | 2.0 | 1480 | $2,995 | $2.02 | 10d | 1 | 0.88mi |
| 615 Watson St N Unit 617B Enumclaw, WA | 2.0 | 1.0 | 960 | $1,999 | $2.08 | 1d | 1 | 1.07mi |
| 750 Watson St N Enumclaw, WA | 1.0–2.0 | 1.0 | 771 | $1,842 | $2.39 | 1d | 6 | 1.12mi |
| 320 Chinook Ave Enumclaw, WA | 2.0–3.0 | 1.0–2.0 | 923 | $1,890 | $2.05 | 1d | 7 | 1.21mi |
| 847 Blake St Enumclaw, WA | 3.0 | 1.0 | 1064 | $2,000 | $1.88 | 1d | 1 | 1.24mi |
| 1571 Kibler Ave Enumclaw, WA | 3.0 | 2.0 | 1200 | $2,600 | $2.17 | 20d | 1 | 1.49mi |
| 1571 Kibler Ave Enumclaw, WA | 3.0 | 2.0 | 1200 | $2,600 | $2.17 | 14d | 1 | 1.49mi |
Listing history 19 events
-
2026-06-18days on market $149,900 Active 295 DOM
-
2026-06-17days on market $149,900 Active 294 DOM
-
2026-06-16days on market $149,900 Active 293 DOM
-
2026-06-15days on market $149,900 Active 292 DOM
-
2026-06-13days on market $149,900 Active 290 DOM
-
2026-06-09days on market $149,900 Active 286 DOM
-
2026-06-08days on market $149,900 Active 285 DOM
-
2026-06-07days on market $149,900 Active 284 DOM
-
2026-06-04days on market $149,900 Active 281 DOM
-
2026-06-03days on market $149,900 Active 280 DOM
-
2026-06-02days on market $149,900 Active 279 DOM
-
2026-06-01days on market $149,900 Active 278 DOM
-
2026-05-31days on market $149,900 Active 277 DOM
-
2026-02-04price $149,900
-
2026-01-11price $169,900
-
2025-11-21price $189,000
-
2025-10-13price $199,000
-
2025-09-18price $210,000
-
2025-08-27$249,900 Active
ⓘ Source: listings_history table (triggers on properties + properties_extension) + one-shot
backfill from property_details.listing_events for pre-trigger history.
Climate risk First Street
- Flood 1/10 Low FEMA zone X (unshaded) · 0% chance over 30 yrs
- Wildfire 3/10 Moderate
- Heat 2/10 Low 7 d/yr ≥84°F today · 16 d/yr by 30 yrs out
- Wind 1/10 Low
- Air quality 6/10 Major 10 unhealthy d/yr today · 12 by 30 yrs out
Nearby sold comps map
Loading sold comps map…
Walkable amenities ~0.75 mi
Loading nearby amenities…
Taxation est. · year 1
- Rental income
- $27,219
- − Mortgage interest
- −$8,397
- − Property taxes
- −$2,248
- − Insurance
- −$750
- − Repairs & maintenance
- −$2,178
- − Management
- −$2,178
- − Depreciation
- −$4,361
- Taxable income
- $7,109
- Est. tax owed @ 24.0%
- −$1,706
- After-tax cash flow
- $7,366/yr
For passive investors: Depreciation is non-cash, so a rental often shows a tax loss while cash-flowing — sheltering income. Rental losses are passive: they offset passive income freely, and up to $25,000/yr can offset ordinary (W-2) income if you actively participate and your MAGI is under $100k (phasing out to $0 by $150k); unused losses carry forward. On sale, claimed depreciation is recaptured at up to 25%, and gains may owe capital-gains tax (a 1031 exchange can defer both). Figures are a year-1 estimate at your 24.0% rate — not tax advice; consult a CPA.
Condition & rehab AI · 13 photos
This well-maintained manufactured home offers a good starting point for updates, with potential for significant value increase through exterior painting and interior renovations.
Repairs flagged
- Minor kitchen cabinets — slight wear
- Minor bathroom fixtures — dated design
- Moderate roof — visible wear
Value-add opportunities
- Both paint exterior — enhances curb appeal
- Both replace fencing — improves privacy and security
- Both update kitchen cabinets — modernizes space
- Both update bathroom fixtures — enhances functionality and aesthetics
Renovation cost estimate screening
| Repair item | Severity | Est. cost |
|---|---|---|
| kitchen cabinets · slight wear | Minor | $500–3,000 |
| bathroom fixtures · dated design | Minor | $500–3,000 |
| roof · visible wear | Moderate | $3,000–15,000 |
| Total estimated repair cost · 3 items | $4,000–21,000 |
Value-add ROI direction
- Both paint exterior — enhances curb appeal ↑
- Both replace fencing — improves privacy and security ↑
- Both update kitchen cabinets — modernizes space ↑
- Both update bathroom fixtures — enhances functionality and aesthetics ↑
ⓘ Cost ranges are severity-bucket heuristics (US national rule-of-thumb). Get contractor quotes + a written scope before underwriting a rehab budget.
Schools (NCES district)
- District
- Enumclaw School District
- NCES district ID
- 5300001
- Math proficiency
- 54% ▼ -1.00%
- Reading proficiency
- 68% ▬ 0.00%
- Median HH income
- $68,441
- Composite
- 55.21/100
- National rank
- #2736
- State rank
- #46 of 291 in WA
Livability — Enumclaw
- Score
- 88/100
- State rank
- #12
- US rank
- #222
Category grades
Schools grade is shown separately in the Schools card above.
Census & demographics
- Census place
- Enumclaw, WA
- County
- King County · 2,251,916 people
- City population
- 22,418
- Metro
- Seattle-Tacoma-Bellevue, WA
- Population (ZIP)
- 22,418
- Household income
- $120,406
- Rent vs Own
- Severe rent burden
- 382.0
Population outlook (King County) Hauer SSP2
- Today (2025)
- 2,576,485 people
- By 2030
- 2,803,316 · +8.8%
- By 2040
- 3,255,921 · +26.4%
- By 2050
- 3,706,444 · +43.9%
- By 2075
- 4,746,063 · +84.2%
- By 2100
- 5,407,730 · +109.9%
Race, ethnicity, and origin ACS 2023
- Neighborhood character
- Predominantly White (78%)
- Race & ethnicity
- White 78% Hispanic / Latino 10% Two or more races 9% Asian 2% Native American 2%
- Hispanic origin (detail)
- Mexican 8%
- Common ancestry
- Portuguese 7% Italian 4% Slovak 3%
- Foreign-born
- 6% · Canada
- Languages at home
- 91% English-only · Spanish 6% Other Indo-European 1% German/W. Germanic 1%
Political lean MEDSL · King
- 2024 margin
- Solid D (+51.7) · D 74.2% · R 22.5% · Other 3.4%
- 2008→2024 swing
- +9.6pp toward D · 2008: 42.1pp · 2024: 51.7pp
- All cycles
- 2024: D+51.7 2020: D+52.7 2016: D+50.4 2012: D+39.9 2008: D+42.1
Not yet ingested
- Civics
- —
Market trends
- HPI YoY
- ▼ -605.16%
- Current HPI
- 297.9161
- Rent YoY
- ▲ 4.32%
- Metro
- Seattle-Tacoma-Bellevue, WA
- State GDP YoY
- ▲ 4.65%
- F500 in state
- 22
Industry mix (Fortune 500 HQ in WA)
| Industry | F500 HQs | Revenue |
|---|---|---|
| Retail | 2 | $269B |
|
||
| Technology / Retail | 1 | $638B |
|
||
| Technology | 1 | $245B |
|
||
| Telecommunications | 1 | $38B |
|
||
| Food / Beverage | 1 | $36B |
|
||
| Automotive / Trucks | 1 | $34B |
|
||
Price history
-40.0% since first listed6 events — show timeline
- 2026-02-04 Price Changed $149,900 NWMLS as Distributed by MLS Grid
- 2026-01-11 Price Changed $169,900 NWMLS as Distributed by MLS Grid
- 2025-11-21 Price Changed $189,000 NWMLS as Distributed by MLS Grid
- 2025-10-13 Price Changed $199,000 NWMLS as Distributed by MLS Grid
- 2025-09-18 Price Changed $210,000 NWMLS as Distributed by MLS Grid
- 2025-08-27 Listed $249,900 NWMLS as Distributed by MLS Grid
Cash-flow waterfall
monthlySold comps — $/sqft
last 12 mo · ≤1 miLoading sold comps…