218 S Charlene Dr · Callaway, FL
Flood risk 1/10 · Minimal
- FEMA flood zone
- X (unshaded)
- Chance of flooding over 30 yrs
- 0.0%
- Est. flood insurance / yr
- $507 – $1,088
Fire risk 3/10 · Minor
- Est. fire insurance / yr
- $947 – $1,759
Heat risk 10/10 · Severe
- Hot days now (above 104°F)
- 7 days/yr
- Hot days in 30 yrs
- 21 days/yr
Wind risk 9/10 · Severe
- Chance of severe wind over 30 yrs
- 99.0%
Air-quality risk 1/10 · Minimal
- Unhealthy air days now
- 0 days/yr
- Unhealthy air days in 30 yrs
- 0 days/yr
Risk factors via First Street. Map © Google.
Why this score? — see what drove the B grade
The composite is a weighted blend of 9 inputs, each scored 0–100. Each bar is that input's sub-score; the figure is the points it added to the 100-point composite (weight × sub-score).
- Cash flow +27.7/30.0
- ARV discount +15.0/15.0
- DSCR +9.7/10.0
- 1% rule +7.2/10.0
- Schools +4.3/10.0
- Livability +3.2/5.0
- Rent growth +2.8/5.0
- Condition / age +2.5/5.0
- Appreciation +0.0/10.0
$169,000
🖨 Deal sheet 📄 Offer letter ✓ Due diligence
Listing remarks MLS
age, sq. ft. lot size all estimated but not guaranteed. sq. ft. taken from appraisal. Really nice home with 4 bedrooms, 2 bath large family room with fireplace. Front room used for office. Large equiped kitchen. Breakfast bar and good size dining room. Area great to raise a family. Great established location. Fenced back yard with 2 storage buildings, 20x24 and 10x12. One year home Warranty.
Key facts
- Dining area
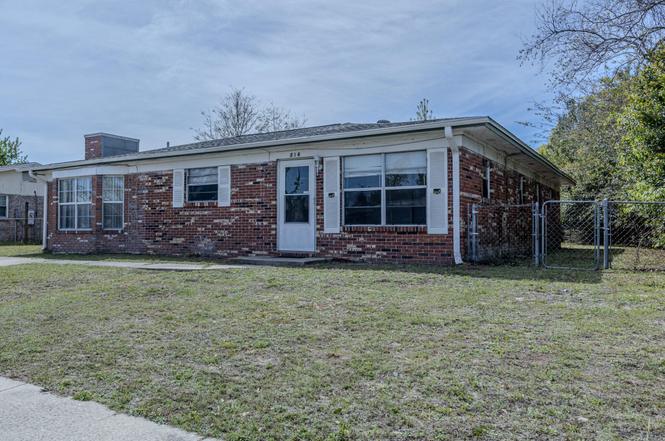
- Brick home
- Fenced backyard
Tags
Property features AI
Exterior
- Parking: No garage
- Utilities: Electricity available; Natural gas available; Public sewer
- Home design: Single-family residence zoning; Entry and living areas on the first level
- Construction: Brick construction; Composition/shingle roof; Slab foundation; Shed and workshop on property
- Exterior features: Rain gutters; Fenced yard; Paved lot
Interior
- Kitchen: Electric range
- Bedrooms: Primary bedroom (first level); Additional bedrooms on the first level (three bedrooms total listed)
- Flooring: Luxury vinyl plank
- Bathrooms: 2 full bathrooms (first level)
- Heating & cooling: Central air; Ceiling fan(s); Heat pump; Electric heating; Fireplace(s)
- Interior features: Luxury vinyl plank flooring; Workshop / separate storage shed
- Laundry & utility: First-level laundry
Neighborhood map
What this means for you Summary
Snapshot
- This is a 4-bed/2.0-bath single-family listed at $169k.
Deal economics
- At list price, monthly cash flow is $508 ($6k/yr) — positive.
- The deal already cash-flows at list — no discount required.
- Meets the 1% rule at list price ($2k rent vs $169k).
- Recommended offer: $159k (6.0% below list) — sets the bar for market timing.
- Cap rate 9.9% vs local median 5.1% in Callaway — top-decile yield for the area; either an underpriced asset or a hidden risk that comps aren't pricing in. Stress-test before assuming the spread holds.
Location & tenants
- Location reads 64/100 on livability (#690 in FL) — a middle-class / working-renter tenant base. Strengths: cost of living A+, housing A+; Watch: employment D+, schools F, amenities F.
- Bay (suburban): math 51% / reading 51% proficiency, ranked #29 of 73 in FL (top 40%) — acceptable for families but not a draw, mixed tenant base, ~2y average lease.
- Market conditions: Rents rising (+1.1%/yr); 969 active listings in the ZIP; 25 comparable units currently listed for rent nearby; rentals at typical pace (median 21d on market — plan ~3-4 weeks tenant-placement turnaround); 2,473 units permitted in Bay County in 2024 (559 in 5+ unit buildings).
- This rent runs 33% of the median local income ($75k/yr) — at the standard rent-burdened threshold; future hikes will face affordability resistance.
Forward outlook
- Local home prices are declining (-3.0%/yr); year-one equity from $1k of loan paydown is wiped out by about $5k of value loss. Plan a longer hold.
- Bay County population projected at +24% by 2050 — long-run rental-demand tailwind backs the buy-and-hold thesis.
Negotiation context
- It's been on market 78 days — a 6% lower offer ($159k) is reasonable based on typical stale-listing flexibility.
- 3 sale attempts since 21y ago; this cycle's ask has dropped $46k (21%) from the opening price — seller is motivated, your offer sets the floor, not the list.
- Current owner paid $135k; 25% above their basis — modest negotiation headroom, anchor on the comps not their cost.
Risks & watch-outs
- Climate carrying-cost: severe wind risk, 99% chance of damaging wind over 30y; extreme-heat days projected 7→21/yr by 2055 (HVAC capex compounding) — expect insurance premiums to compound above CPI over the hold.
Questions for the listing agent
- It's been on market 78 days. Have you received any prior offers? Is the seller open to a 6% concession, seller financing, or rate buy-down credit?
- Built in 1973 — when were the roof, HVAC, electrical panel, plumbing, and water heater last replaced?
- Why hasn't it sold? Are there any deal-killer items the seller is aware of (foundation, flood, title, zoning, code violations)?
- Is there a deadline driving the sale (1031 exchange, divorce, estate, relocation)? That informs how much negotiation room exists.
- Schools are F-rated, which usually means shorter tenancies and higher turnover. Who's the typical renter profile here, and what's been the actual vacancy rate?
- What's the average days-on-market for RENTAL listings here right now (not sales)? A rising rental-DOM trend means longer vacancies and softer asking-rent achievability than the comps imply.
- What's the recent tenant-quality profile in this submarket — average credit score on applications, eviction rate, late-payment / NSF rate, and stable-employment percentage? A property-management company in the area should have these aggregated.
- How much new for-sale + rental construction is in the pipeline within 1–3 miles? Heavy new supply typically softens prices + rents 12–24 months out; constrained supply supports both.
Investment metrics
- 1% rule
- 1.22% ✓
- Cap rate
- 9.90%
- Cash-on-cash
- 12.89%
- DSCR
- 1.57
- GRM
- 6.8
CMA / ARV
- ARV (on-the-fly)
- $301,016
- Comps found
- 12
Show comp detail 12 sales within ~0.75 mi
| Address | Dist | Beds/Ba | Sqft | Sold | Price | $/sf | Match |
|---|---|---|---|---|---|---|---|
| 214 S Charlene Dr | 0.03mi | 4/3.0 | 1,722 (+9%) | 13mo | $335,000 | $195 | 68 |
| 6216 Imperial Dr | 0.36mi | 3/2.0 (-1) | 1,601 (+2%) | 13mo | $339,900 | $212 | 65 |
| 318 S Gay | 0.37mi | 4/3.0 | 1,652 (+5%) | 16mo | $315,000 | $191 | 57 |
| 6223 Seminole Dr | 0.23mi | 4/2.0 | 1,807 (+15%) | 10mo | $315,000 | $174 | 57 |
| 6040 Enzor St | 0.62mi | 3/2.0 (-1) | 1,556 (-1%) | 12mo | $275,000 | $177 | 54 |
| 6025 Enzor St | 0.59mi | 3/2.0 (-1) | 1,500 (-5%) | 15mo | $294,000 | $196 | 47 |
| 701 J J Dr | 0.61mi | 3/2.0 (-1) | 1,419 (-10%) | 4mo | $257,500 | $181 | 47 |
| 6816 Hugh Dr | 0.70mi | 3/2.0 (-1) | 1,514 (-4%) | 12mo | $300,000 | $198 | 46 |
| 6029 Boat Race Rd | 0.71mi | 4/2.0 | 1,521 (-4%) | 20mo | $271,500 | $179 | 44 |
| 6321 Pridgen St | 0.63mi | 3/2.0 (-1) | 1,464 (-7%) | 18mo | $164,500 | $112 | 38 |
| 320 S Viola Ave | 0.51mi | 3/2.0 (-1) | 1,352 (-14%) | 13mo | $245,000 | $181 | 36 |
| 233 S Mary Ella Ave | 0.64mi | 3/2.0 (-1) | 1,430 (-9%) | 19mo | $284,900 | $199 | 34 |
Match score weights: distance 35% · size 25% · config 20% · recency 20%. Top-matched comps best support the ARV.
Projected returns pro-forma
-3.0% appreciation · 1.12% rent growth · sell at horizon
- IRR
- 0.7%
- Equity multiple
- 1.02×
- Total profit
- $1,173
- Equity at exit
- $25,198
- IRR
- 8.4%
- Equity multiple
- 1.58×
- Total profit
- $27,623
- Equity at exit
- $14,612
Cash invested: $47,320 (down + closing). Projections, not guarantees.
Landlord ↔ Tenant lean methodology
- Overall (STATE)
- 87 Strongly Landlord-Friendly
- State Florida
- 87 Strongly Landlord-Friendly · R+3
- County
- — inherits STATE
- City
- — inherits STATE
ZIP-level market 32404
- Home prices YoY
- -16.1%
- Rents YoY
- 1.1%
- Active inventory
- 969
- Price-to-rent
- 6.8×
Monthly cashflow live
- Estimated rent
- $2,056 high interval (Pro) →
- Mortgage (P&I)
- −$886
- Tax from tax record
- −$159 /mo · $1,911/yr
- Insurance
- −$70
- HOA
- −$0
- Vacancy / Maint / Mgmt
- −$432
- Net cashflow
- $508
Break-even live
UW: 25.0% down · 7.5% · 30yr · 1.5% tax · 5.0% vac · 8.0% maint · 8.0% mgmt
Financing live
Cash to close
- Down payment
- $42,250
- Closing costs
- $5,070
- Reserves months
- —
- Total cash needed
- —
Loan-product check · same deal, 3 products live
Conventional
25% down · 7.5% · 30yr
- Down + closing
- —
- Monthly P&I
- —
- Monthly cashflow
- —
- DSCR
- —
- Eligible?
- —
Personal DTI + credit; lowest rate.
DSCR
20% down · 8.5% · 30yr
- Down + closing
- —
- Monthly P&I
- —
- Monthly cashflow
- —
- DSCR
- —
- Eligible?
- —
No personal income docs; deal must DSCR.
Hard money
10% down · 12.0% · 12mo
- Down + closing
- —
- Monthly P&I
- —
- Monthly cashflow
- —
- DSCR
- —
- Eligible?
- —
Short-term bridge; refi at stabilization.
Rent comps 25 comps
| Address | Beds | Baths | Sqft | Rent | $/sqft | DOM | Units | Dist |
|---|---|---|---|---|---|---|---|---|
| 6328 Olokee St Panama City, FL | 3.0 | 2.0 | 1131 | $1,850 | $1.64 | 13d | 1 | 0.16mi |
| 114 S Kimbrel Ave Panama City, FL | 3.0 | 2.0 | 1400 | $1,850 | $1.32 | 21d | 1 | 0.21mi |
| 5813 Hickory St Panama City, FL | 3.0 | 2.0 | 1200 | $1,950 | $1.62 | 21d | 1 | 0.38mi |
| 163 Lauren Ln Panama City, FL | 4.0 | 2.0 | 1731 | $2,300 | $1.33 | 21d | 1 | 0.65mi |
| 175 N Berthe Ave Panama City, FL | 4.0 | 2.0 | 1498 | $2,195 | $1.47 | 13d | 1 | 0.69mi |
| 509 Phillips Ct Panama City, FL | 3.0 | 2.0 | 1411 | $1,700 | $1.20 | 13d | 1 | 0.73mi |
| 116 Christie Ln Panama City, FL | 3.0 | 2.0 | 1092 | $1,550 | $1.42 | 21d | 1 | 0.73mi |
| 907 Lee Ct Panama City, FL | 3.0 | 3.0 | 2126 | $2,100 | $0.99 | 21d | 1 | 0.76mi |
| 229 Callaway Chase Ln Panama City, FL | 3.0 | 2.5 | 1200 | $1,650 | $1.38 | 13d | 1 | 0.81mi |
| 129 Seneca Ave Panama City, FL | 3.0 | 2.0 | 1449 | $1,495 | $1.03 | 13d | 1 | 0.91mi |
| 5817 Jasmine Ct Panama City, FL | 4.0 | 2.5 | 1633 | $2,000 | $1.22 | 13d | 1 | 0.98mi |
| 420 Raven Ln Panama City, FL | 3.0 | 2.0 | 1251 | $1,750 | $1.40 | 21d | 1 | 1.10mi |
| 1128 S Gay Ave Lot 56 Panama City, FL | 3.0 | 1.5 | 1216 | $35,000 | $28.78 | 21d | 1 | 1.13mi |
| 1128 S Gay Ave Lot 86 Panama City, FL | 3.0 | 2.0 | 1216 | $94,995 | $78.12 | 21d | 1 | 1.13mi |
| 1128 S Gay Ave Lot 146 Panama City, FL | 3.0 | 2.0 | 1536 | $20,000 | $13.02 | 21d | 1 | 1.13mi |
| 1128 S Gay Ave Lot V Panama City, FL | 3.0 | 2.0 | 1152 | $30,000 | $26.04 | 21d | 1 | 1.13mi |
| 208 North Highway 22 A Unit 33 Panama City, FL | 3.0 | 2.0 | 1080 | $1,350 | $1.25 | 21d | 1 | 1.15mi |
| 133 Red Bay Rd Panama City, FL | 4.0 | 2.0 | 2208 | $2,500 | $1.13 | 21d | 1 | 1.17mi |
| 7727 Betty Louise Dr Panama City, FL | 3.0 | 2.0 | 1430 | $1,950 | $1.36 | 21d | 1 | 1.19mi |
| 7709 Betty Louise Dr Panama City, FL | 3.0 | 2.0 | 1310 | $1,800 | $1.37 | 21d | 1 | 1.20mi |
| 5101 Willow St Panama City, FL | 3.0 | 2.0 | 1099 | $1,500 | $1.36 | 13d | 1 | 1.21mi |
| 526 Camellia Ave Panama City, FL | 3.0 | 2.0 | 1375 | $1,950 | $1.42 | 21d | 1 | 1.32mi |
| 263 Nelle Ave Panama City, FL | 3.0 | 2.0 | 1294 | $1,690 | $1.31 | 21d | 1 | 1.36mi |
| 211 Sukoshi Dr Panama City, FL | 3.0 | 2.0 | 1512 | $1,900 | $1.26 | 21d | 1 | 1.43mi |
| 140 Carriage Rd Panama City, FL | 4.0 | 3.5 | 2147 | $2,800 | $1.30 | 21d | 1 | 1.45mi |
Listing history 12 events
-
2026-04-22status Pending
-
2026-04-07price $169,000
-
2026-03-17price $174,900
-
2026-02-16price $199,900
-
2026-01-31$215,000 Active
-
2015-04-16historical
-
2014-09-18$136,500
-
2005-04-04soldstatus $135,000
-
2005-04-01soldstatus $135,000 394-char remark
Show marketing remark (394 chars)
age, sq. ft. lot size all estimated but not guaranteed. sq. ft. taken from appraisal. Really nice home with 4 bedrooms, 2 bath large family room with fireplace. Front room used for office. Large equiped kitchen. Breakfast bar and good size dining room. Area great to raise a family. Great established location. Fenced back yard with 2 storage buildings, 20x24 and 10x12. One year home Warranty.
-
2005-01-28$138,600 394-char remark
Show marketing remark (394 chars)
age, sq. ft. lot size all estimated but not guaranteed. sq. ft. taken from appraisal. Really nice home with 4 bedrooms, 2 bath large family room with fireplace. Front room used for office. Large equiped kitchen. Breakfast bar and good size dining room. Area great to raise a family. Great established location. Fenced back yard with 2 storage buildings, 20x24 and 10x12. One year home Warranty.
-
1990-02-01soldstatus $46,000
-
1979-01-01soldstatus $27,600
ⓘ Source: listings_history table (triggers on properties + properties_extension) + one-shot
backfill from property_details.listing_events for pre-trigger history.
Tax reassessment forecast FL · Resets to sale price
- Current annual tax
- $1,911 · $159/mo
- Projected year-2 tax
- $1,911 · $159/mo
- Expected delta
- $0/yr ($0/mo · 0.0%)
ⓘ Screening estimate from a state-policy table — verify with the county assessor before closing.
Climate risk First Street
- Flood 1/10 Low FEMA zone X (unshaded) · 0% chance over 30 yrs
- Wildfire 3/10 Moderate
- Heat 10/10 Extreme 7 d/yr ≥104°F today · 21 d/yr by 30 yrs out
- Wind 9/10 Extreme 99% chance of damaging wind over 30 yrs
- Air quality 1/10 Low 0 unhealthy d/yr today · 0 by 30 yrs out
Nearby sold comps map
Loading sold comps map…
Walkable amenities ~0.75 mi
Loading nearby amenities…
Taxation est. · year 1
- Rental income
- $24,673
- − Mortgage interest
- −$9,467
- − Property taxes
- −$1,911
- − Insurance
- −$845
- − Repairs & maintenance
- −$1,974
- − Management
- −$1,974
- − Depreciation
- −$4,916
- Taxable income
- $3,586
- Est. tax owed @ 24.0%
- −$861
- After-tax cash flow
- $5,240/yr
For passive investors: Depreciation is non-cash, so a rental often shows a tax loss while cash-flowing — sheltering income. Rental losses are passive: they offset passive income freely, and up to $25,000/yr can offset ordinary (W-2) income if you actively participate and your MAGI is under $100k (phasing out to $0 by $150k); unused losses carry forward. On sale, claimed depreciation is recaptured at up to 25%, and gains may owe capital-gains tax (a 1031 exchange can defer both). Figures are a year-1 estimate at your 24.0% rate — not tax advice; consult a CPA.
Schools (NCES district)
- District
- Bay
- NCES district ID
- 1200090
- Math proficiency
- 51% ▼ -8.00%
- Reading proficiency
- 51% ▼ -7.00%
- Median HH income
- $47,740
- Composite
- 43.41/100
- National rank
- #3014
- State rank
- #29 of 73 in FL
Livability — Callaway
- Score
- 64/100
- State rank
- #690
- US rank
- #14384
Category grades
Schools grade is shown separately in the Schools card above.
Census & demographics
- Census place
- Callaway, FL
- County
- Bay County · 163,593 people
- Metro
- Panama City, FL
- Population (ZIP)
- 42,514
- Household income
- $74,708
- Rent vs Own
- Severe rent burden
- 1218.0
Population outlook (Bay County) Hauer SSP2
- Today (2025)
- 206,264 people
- By 2030
- 217,740 · +5.6%
- By 2040
- 238,738 · +15.7%
- By 2050
- 255,545 · +23.9%
- By 2075
- 288,295 · +39.8%
- By 2100
- 288,638 · +39.9%
Race, ethnicity, and origin ACS 2023
- Neighborhood character
- Predominantly White (69%)
- Race & ethnicity
- White 69% Black 12% Two or more races 10% Hispanic / Latino 9% Asian 3%
- Hispanic origin (detail)
- Mexican 2% Puerto Rican 3%
- Common ancestry
- Lithuanian 3% Slovak 2% Italian 2%
- Foreign-born
- 7% · Canada, Vietnam, Mexico
- Languages at home
- 90% English-only · Spanish 6% Vietnamese 1% Other Asian/Pacific 1%
Political lean MEDSL · Bay
- 2024 margin
- Solid R (+47.4) · D 25.8% · R 73.1% · Other 1.1%
- 2008→2024 swing
- -6.6pp toward R · 2008: -40.7pp · 2024: -47.4pp
- All cycles
- 2024: R+47.4 2020: R+43.5 2016: R+46.3 2012: R+43.6 2008: R+40.7
Not yet ingested
- Civics
- —
Market trends
- HPI YoY
- ▼ -50.59%
- Current HPI
- 263.7178
- Rent YoY
- ▲ 1.12%
- Metro
- Panama City, FL
- State GDP YoY
- ▲ 3.28%
- F500 in state
- 36
Industry mix (Fortune 500 HQ in FL)
| Industry | F500 HQs | Revenue |
|---|---|---|
| Industrial Technology | 2 | $29B |
|
||
| Insurance | 2 | $17B |
|
||
| Retail | 1 | $60B |
|
||
| Technology Distribution | 1 | $58B |
|
||
| Homebuilding | 1 | $35B |
|
||
| Technology Manufacturing | 1 | $35B |
|
||
Price history
+512.3% since first listed12 events — show timeline
- 2026-04-22 Pending — CPARMLS
- 2026-04-07 Price Changed $169,000 CPARMLS
- 2026-03-17 Price Changed $174,900 CPARMLS
- 2026-02-16 Price Changed $199,900 CPARMLS
- 2026-01-31 Listed $215,000 CPARMLS
- 2015-04-16 Listing Removed — CPARMLS
- 2014-09-18 Listed $136,500 CPARMLS
- 2005-04-04 Sold (Public Records) $135,000 Public Records
- 2005-04-01 Sold (MLS) $135,000 CPARMLS
- 2005-01-28 Listed $138,600 CPARMLS
- 1990-02-01 Sold (Public Records) $46,000 Public Records
- 1979-01-01 Sold (Public Records) $27,600 Public Records
Property tax history
+2.8%/yrLatest (2025): $1,911 · +6.7% YoY. Source: county tax records.
Cash-flow waterfall
monthlySold comps — $/sqft
last 12 mo · ≤1 miLoading sold comps…