 Multi-family
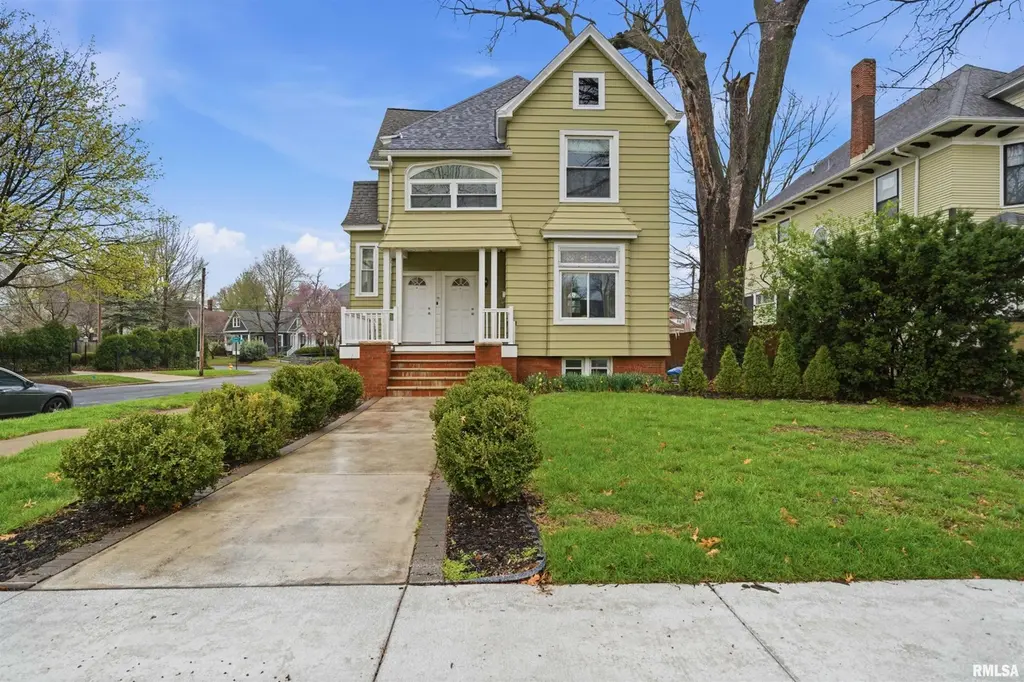
1637 W Moss Ave · Peoria, IL
Flood risk 1/10 · Minimal
- FEMA flood zone
- X
- Chance of flooding over 30 yrs
- 0.0%
- Est. flood insurance / yr
- $473 – $860
Fire risk 1/10 · Minimal
- Est. fire insurance / yr
- $804 – $1,492
Heat risk 3/10 · Minor
- Hot days now (above 105°F)
- 7 days/yr
- Hot days in 30 yrs
- 17 days/yr
Wind risk 2/10 · Minimal
- Chance of severe wind over 30 yrs
- 1.0%
Air-quality risk 3/10 · Minor
- Unhealthy air days now
- 1 days/yr
- Unhealthy air days in 30 yrs
- 3 days/yr
Risk factors via First Street. Map © Google.
Why this score? — see what drove the D grade
The composite is a weighted blend of 9 inputs, each scored 0–100. Each bar is that input's sub-score; the figure is the points it added to the 100-point composite (weight × sub-score).
- Cash flow +20.0/30.0
- DSCR +6.3/10.0
- 1% rule +4.8/10.0
- Livability +3.7/5.0
- Rent growth +2.5/5.0
- Condition / age +2.5/5.0
- Schools +1.1/10.0
- ARV discount +0.0/15.0
- Appreciation +0.0/10.0
$239,900
🖨 Deal sheet (PDF) 📄 Offer letter ✓ Due diligence
Multi-family units
County records classify this as Multi-Family (2-4 Unit). Listing-text estimate: 1 unit. estimate disagrees with records
Listing remarks MLS
Stunning 2 story home with Historic Charm and Modern Updates located in prime spot on prestigious Moss Avenue. Dream kitchen has been transformed with new cabinets, granite counter tops, pantry, and stainless steel appliances. Spacious living room features custom windows to let in an abundance of natural light and enjoy the fresh air. Gorgeous bathroom has a custom tile shower, soaker tub, and new vanity. Upper level complete with it's own remodeled kitchen that is perfect for multi-generational living or overnight guests. Generous room sizes and plenty of flex rooms make this home one that you can grow in. No shortage of storage with the full basement and 2 stall garage. Other updates include: furnace, a/c, windows, and more. Come be a part of this great neighborhood, close to Bradley, hospitals, and interstate access. Schedule a showing today!
Key facts
- Remodeled kitchen
- Historic charm
- Custom windows
Tags
Neighborhood map
What this means for you Summary
Snapshot
- This is a 6-bed/2.0-bath multifamily listed at $240k.
Deal economics
- At list price, monthly cash flow is $295 ($4k/yr) — positive.
- The deal already cash-flows at list — no discount required.
- To meet the 1% rule (rent ≥ 1% of price), the offer needs to be $235k (2.0% below list).
- Recommended offer: $233k (3.0% below list) — sets the bar for market timing.
- Cap rate 7.8% vs local median 5.6% in Peoria — top-decile yield for the area; either an underpriced asset or a hidden risk that comps aren't pricing in. Stress-test before assuming the spread holds.
Location & tenants
- Location reads 73/100 on livability (#270 in IL) — a middle-class / working-renter tenant base. Strengths: commute A+, cost of living A+, housing A+; Watch: employment D+, crime F.
- Peoria SD 150 (urban): math 11% / reading 14% proficiency, ranked #554 of 620 in IL (top 89%) — low school quality limits family demand, transient renter base, plan for 1-2y turnover; 70% free/reduced lunch — lower-income household profile, screen leases tightly.
- Zoned schools: Valeska Hinton Early Ch Ed Ctr (495 students, 0% FRL); Harold B Dawson Middle School (math 0% / reading 5%, grade F, #658 of 665 statewide, top 99%, 360 students, 0% FRL); Peoria High School (math 4% / reading 7%, grade F, #609 of 693 statewide, top 88%, 1,447 students, 0% FRL) — zoned schools average 0% FRL vs 70% district-wide (70 pts lower); this property's tenant base skews higher-income than the district average.
- Market conditions: 35 active listings in the ZIP; lower-income renter base — watch delinquency; 73 units permitted in Peoria County in 2024 (0 in 5+ unit buildings).
- At $2,351/mo this rent would consume 72% of the median local household income ($39k/yr) (locally 620% of renters already pay >50% of income on rent) — very limited rent-growth headroom before tenants either downsize or default.
Forward outlook
- Local home prices are declining (-3.0%/yr); year-one equity from $2k of loan paydown is wiped out by about $7k of value loss. Plan a longer hold.
- Peoria County population projected at -11% by 2050 — secular population decline; favor cash flow + early exit over multi-decade hold.
Negotiation context
- It's been on market 54 days — a 3% lower offer ($233k) is reasonable based on typical stale-listing flexibility.
- 3 sale attempts since 7y ago with the ask held roughly flat each time — persistent listings suggest the price (not the market) is what's stuck; bring a comps-based counter.
- Current owner paid $73k; list at $240k implies a 229% gain — meaningful room to come down on a strong offer.
Risks & watch-outs
- Watch-outs: built in 1900 — expect roof / HVAC / electrical / plumbing capex.
Questions for the listing agent
- It's been on market 54 days. Have you received any prior offers? Is the seller open to a 3% concession, seller financing, or rate buy-down credit?
- Built in 1900 — when were the roof, HVAC, electrical panel, plumbing, and water heater last replaced?
- Is there a deadline driving the sale (1031 exchange, divorce, estate, relocation)? That informs how much negotiation room exists.
- Schools are F-rated, which usually means shorter tenancies and higher turnover. Who's the typical renter profile here, and what's been the actual vacancy rate?
- Crime grade is F in this area — have there been break-ins, vandalism, or insurance claims at this property in the last 3 years? What carrier currently insures it and at what premium?
- The area grade is low — what's the realistic commute time and amenity access for the typical tenant pool here? Any planned neighborhood developments (good or bad) we should know about?
- What's the average days-on-market for RENTAL listings here right now (not sales)? A rising rental-DOM trend means longer vacancies and softer asking-rent achievability than the comps imply.
- What's the recent tenant-quality profile in this submarket — average credit score on applications, eviction rate, late-payment / NSF rate, and stable-employment percentage? A property-management company in the area should have these aggregated.
- How much new apartment / multifamily construction is in the pipeline within 1–3 miles? Heavy new supply (>2% of stock underway) typically softens rents 12–24 months out; light construction supports rent growth.
Investment metrics
- 1% rule
- 0.98% ✗
- Cap rate
- 7.77%
- Cash-on-cash
- 5.27%
- DSCR
- 1.23
- GRM
- 8.5
CMA / ARV
- ARV (median comp)
- $170,230
- List price
- $239,900
- Delta
- 40.93%
- Verdict
- OVERPRICED
- Comps
- 20 within 1.0 mi
Show comp detail 2 sales within ~0.75 mi
| Address | Dist | Beds/Ba | Sqft | Sold | Price | $/sf | Match |
|---|---|---|---|---|---|---|---|
| 1509-1511 W Main St | 0.61mi | 7/3.0 (+1) | 2,216 (-1%) | 5mo | $245,000 | $111 | 58 |
| 1625 W Main St | 0.59mi | 5/3.0 (-1) | 2,224 (-0%) | 18mo | $186,000 | $84 | 48 |
Match score weights: distance 35% · size 25% · config 20% · recency 20%. Top-matched comps best support the ARV.
Projected returns pro-forma
-3.0% appreciation · 3.0% rent growth · sell at horizon
- IRR
- -8.1%
- Equity multiple
- 0.70×
- Total profit
- $-20,114
- Equity at exit
- $35,770
- IRR
- 1.4%
- Equity multiple
- 1.10×
- Total profit
- $6,578
- Equity at exit
- $20,742
Cash invested: $67,172 (down + closing). Projections, not guarantees.
Landlord ↔ Tenant lean methodology
- Overall (STATE)
- 43 Moderately Tenant-Leaning
- State Illinois
- 43 Moderately Tenant-Leaning · D+7
- County
- — inherits STATE
- City
- — inherits STATE
ZIP-level market 61606
- Home prices YoY
- -34.0%
- Active inventory
- 35
- Price-to-rent
- 17.0×
Monthly cashflow live
- Estimated rent
- $2,351 high interval (Pro) →
- Mortgage (P&I)
- −$1,258
- Tax from tax record
- −$204 /mo · $2,452/yr
- Insurance
- −$100
- HOA
- −$0
- Vacancy / Maint / Mgmt
- −$494
- Net cashflow
- $295
Break-even live
Sensitivity live
| Price | -10% $431 | -5% $363 | +0% $295 | +5% $227 | +10% $159 |
|---|---|---|---|---|---|
| Rent | -10% $109 | -5% $202 | +0% $295 | +5% $388 | +10% $481 |
| Rate | -1.0pp $416 | -0.5pp $356 | base $295 | +0.5pp $233 | +1.0pp $170 |
2-unit breakdown (identical units grouped — click to expand)
| Units | Beds | Baths | Est. rent |
|---|---|---|---|
| 2× units | 2 | 1 | $2,350 |
| #1 | 2 | 1 | $1,175 |
| #2 | 2 | 1 | $1,175 |
| Total (2 units) | $2,351 | ||
UW: 25.0% down · 7.5% · 30yr · 1.5% tax · 5.0% vac · 8.0% maint · 8.0% mgmt
Financing live
Cash to close
- Down payment
- $59,975
- Closing costs
- $7,197
- Reserves months
- —
- Total cash needed
- —
Loan-product check · same deal, 3 products live
Conventional
25% down · 7.5% · 30yr
- Down + closing
- —
- Monthly P&I
- —
- Monthly cashflow
- —
- DSCR
- —
- Eligible?
- —
Personal DTI + credit; lowest rate.
DSCR
20% down · 8.5% · 30yr
- Down + closing
- —
- Monthly P&I
- —
- Monthly cashflow
- —
- DSCR
- —
- Eligible?
- —
No personal income docs; deal must DSCR.
Hard money
10% down · 12.0% · 12mo
- Down + closing
- —
- Monthly P&I
- —
- Monthly cashflow
- —
- DSCR
- —
- Eligible?
- —
Short-term bridge; refi at stabilization.
Listing history 21 events
-
2026-06-03status $239,900 Pending 54 DOM
-
2026-06-02days on market $239,900 Active 54 DOM
-
2026-06-01days on market $239,900 Active 53 DOM
-
2026-05-31days on market $239,900 Active 52 DOM
-
2026-05-30days on market $239,900 Active 51 DOM
-
2026-04-29price $239,900 857-char remark
Show marketing remark (857 chars)
Stunning 2 story home with Historic Charm and Modern Updates located in prime spot on prestigious Moss Avenue. Dream kitchen has been transformed with new cabinets, granite counter tops, pantry, and stainless steel appliances. Spacious living room features custom windows to let in an abundance of natural light and enjoy the fresh air. Gorgeous bathroom has a custom tile shower, soaker tub, and new vanity. Upper level complete with it's own remodeled kitchen that is perfect for multi-generational living or overnight guests. Generous room sizes and plenty of flex rooms make this home one that you can grow in. No shortage of storage with the full basement and 2 stall garage. Other updates include: furnace, a/c, windows, and more. Come be a part of this great neighborhood, close to Bradley, hospitals, and interstate access. Schedule a showing today!
-
2026-04-02$250,000 Active 857-char remark
Show marketing remark (857 chars)
Stunning 2 story home with Historic Charm and Modern Updates located in prime spot on prestigious Moss Avenue. Dream kitchen has been transformed with new cabinets, granite counter tops, pantry, and stainless steel appliances. Spacious living room features custom windows to let in an abundance of natural light and enjoy the fresh air. Gorgeous bathroom has a custom tile shower, soaker tub, and new vanity. Upper level complete with it's own remodeled kitchen that is perfect for multi-generational living or overnight guests. Generous room sizes and plenty of flex rooms make this home one that you can grow in. No shortage of storage with the full basement and 2 stall garage. Other updates include: furnace, a/c, windows, and more. Come be a part of this great neighborhood, close to Bradley, hospitals, and interstate access. Schedule a showing today!
-
2026-01-01historical
-
2025-11-09price
-
2025-10-11price
-
2025-09-26price
-
2025-09-17Active
-
2025-09-14price
-
2025-08-28historical
-
2021-08-06historical
-
2021-08-06historical
-
2019-09-20soldstatus $73,000
-
2019-09-19soldstatus $73,000
-
2019-08-23$89,900
-
2016-07-07historical
-
1990-03-01soldstatus $39,500
ⓘ Source: listings_history table (triggers on properties + properties_extension) + one-shot
backfill from property_details.listing_events for pre-trigger history.
Tax reassessment forecast IL · Partial reset (capped growth)
- Current annual tax
- $2,452 · $204/mo
- Projected year-2 tax
- $3,949 · $329/mo
- Expected delta
- +$1,497/yr (+$125/mo · 61.0%)
ⓘ Screening estimate from a state-policy table — verify with the county assessor before closing.
Climate risk First Street
- Flood 1/10 Low FEMA zone X · 0% chance over 30 yrs
- Wildfire 1/10 Low
- Heat 3/10 Moderate 7 d/yr ≥105°F today · 17 d/yr by 30 yrs out
- Wind 2/10 Low 100% chance of damaging wind over 30 yrs
- Air quality 3/10 Moderate 1 unhealthy d/yr today · 3 by 30 yrs out
Nearby sold comps map
Loading sold comps map…
Walkable amenities ~0.75 mi
Loading nearby amenities…
Taxation est. · year 1
- Rental income
- $28,212
- − Mortgage interest
- −$13,438
- − Property taxes
- −$2,452
- − Insurance
- −$1,200
- − Repairs & maintenance
- −$2,257
- − Management
- −$2,257
- − Depreciation
- −$6,979
- Taxable loss
- −$371
- Est. tax savings @ 24.0%
- +$89
- After-tax cash flow
- $3,628/yr
For passive investors: Depreciation is non-cash, so a rental often shows a tax loss while cash-flowing — sheltering income. Rental losses are passive: they offset passive income freely, and up to $25,000/yr can offset ordinary (W-2) income if you actively participate and your MAGI is under $100k (phasing out to $0 by $150k); unused losses carry forward. On sale, claimed depreciation is recaptured at up to 25%, and gains may owe capital-gains tax (a 1031 exchange can defer both). Figures are a year-1 estimate at your 24.0% rate — not tax advice; consult a CPA.
Schools (NCES district)
- District
- Peoria SD 150
- NCES district ID
- 1731230
- Math proficiency
- 11% ▼ -5.00%
- Reading proficiency
- 14% ▼ -4.00%
- Median HH income
- $41,951
- Composite
- 10.92/100
- National rank
- #9751
- State rank
- #554 of 620 in IL
Livability — Peoria
- Score
- 73/100
- State rank
- #270
- US rank
- #5096
Category grades
Schools grade is shown separately in the Schools card above.
Census & demographics
- Census place
- Peoria, IL
- County
- Peoria County · 120,495 people
- City population
- 114,670
- Metro
- Peoria, IL
- Population (ZIP)
- 6,684
- Household income
- $39,196
- Rent vs Own
- Severe rent burden
- 620.0
Population outlook (Peoria County) Hauer SSP2
- Today (2025)
- 183,007 people
- By 2030
- 179,643 · -1.8%
- By 2040
- 171,782 · -6.1%
- By 2050
- 163,508 · -10.7%
- By 2075
- 140,178 · -23.4%
- By 2100
- 114,493 · -37.4%
Race, ethnicity, and origin ACS 2023
- Neighborhood character
- Predominantly White (66%)
- Race & ethnicity
- White 66% Black 17% Two or more races 9% Hispanic / Latino 8% Asian 3%
- Hispanic origin (detail)
- Mexican 6%
- Common ancestry
- Romanian 4% Slovak 2% Lithuanian 2%
- Foreign-born
- 4% · Vietnam, Canada
- Languages at home
- 94% English-only · Spanish 3% Other Indo-European 1% Chinese 1%
Political lean MEDSL · Peoria
- 2024 margin
- Toss-up / Even · D 51.5% · R 46.9% · Other 1.6%
- 2008→2024 swing
- -9.2pp toward R · 2008: 13.9pp · 2024: 4.7pp
- All cycles
- 2024: D+4.7 2020: D+6.3 2016: D+2.8 2012: D+4.4 2008: D+13.9
Not yet ingested
- Civics
- —
Market trends
- HPI YoY
- ▼ -85.67%
- Current HPI
- 166.329
- Rent YoY
- —
- Metro
- Peoria, IL
- State GDP YoY
- ▲ 1.59%
- F500 in state
- 60
Industry mix (Fortune 500 HQ in IL)
| Industry | F500 HQs | Revenue |
|---|---|---|
| Insurance | 4 | $201B |
|
||
| Consumer Goods | 4 | $87B |
|
||
| Industrial Machinery | 3 | $64B |
|
||
| Healthcare | 2 | $55B |
|
||
| Retail / Pharmacy | 1 | $148B |
|
||
| Agriculture / Food | 1 | $86B |
|
||
Price history
+507.3% since first listed16 events — show timeline
- 2026-04-29 Price Changed $239,900 RMLSA as Distributed by MLS Grid
- 2026-04-02 Listed $250,000 RMLSA as Distributed by MLS Grid
- 2026-01-01 Listing Removed — RMLSA as Distributed by MLS Grid
- 2025-11-09 Price Changed — RMLSA as Distributed by MLS Grid
- 2025-10-11 Price Changed — RMLSA as Distributed by MLS Grid
- 2025-09-26 Price Changed — RMLSA as Distributed by MLS Grid
- 2025-09-17 Listed — RMLSA as Distributed by MLS Grid
- 2025-09-14 Price Changed — RMLSA as Distributed by MLS Grid
- 2025-08-28 Coming Soon — RMLSA as Distributed by MLS Grid
- 2021-08-06 Listing Removed — RMLSA as Distributed by MLS Grid
- 2021-08-06 Listing Removed — RMLSA as Distributed by MLS Grid
- 2019-09-20 Sold (Public Records) $73,000 Public Records
- 2019-09-19 Sold (MLS) $73,000 RMLSA as Distributed by MLS Grid
- 2019-08-23 Listed $89,900 RMLSA as Distributed by MLS Grid
- 2016-07-07 Listing Removed — RMLSA as Distributed by MLS Grid
- 1990-03-01 Sold (Public Records) $39,500 Public Records
Property tax history
-3.9%/yrLatest (2024): $2,452 · +8.7% YoY. Source: county tax records.
Cash-flow waterfall
monthlySold comps — $/sqft
last 12 mo · ≤1 miLoading sold comps…