214 E Cholla Ln · Florence, AZ
Flood risk 3/10 · Minor
- FEMA flood zone
- X (unshaded)
- Chance of flooding over 30 yrs
- 0.2%
- Est. flood insurance / yr
- $507 – $1,088
Fire risk 5/10 · Moderate
- Est. fire insurance / yr
- $610 – $1,132
Heat risk 8/10 · Major
- Hot days now (above 112°F)
- 3 days/yr
- Hot days in 30 yrs
- 7 days/yr
Wind risk 1/10 · Minimal
- Chance of severe wind over 30 yrs
- —
Air-quality risk 2/10 · Minimal
- Unhealthy air days now
- 0 days/yr
- Unhealthy air days in 30 yrs
- 1 days/yr
Risk factors via First Street. Map © Google.
Why this score? — see what drove the B+ grade
The composite is a weighted blend of 9 inputs, each scored 0–100. Each bar is that input's sub-score; the figure is the points it added to the 100-point composite (weight × sub-score).
- Cash flow +30.0/30.0
- ARV discount +15.0/15.0
- 1% rule +10.0/10.0
- DSCR +10.0/10.0
- Livability +3.0/5.0
- Rent growth +2.8/5.0
- Condition / age +2.5/5.0
- Schools +1.8/10.0
- Appreciation +0.0/10.0
$65,000
🖨 Deal sheet (PDF) 📄 Offer letter ✓ Due diligence
Listing remarks
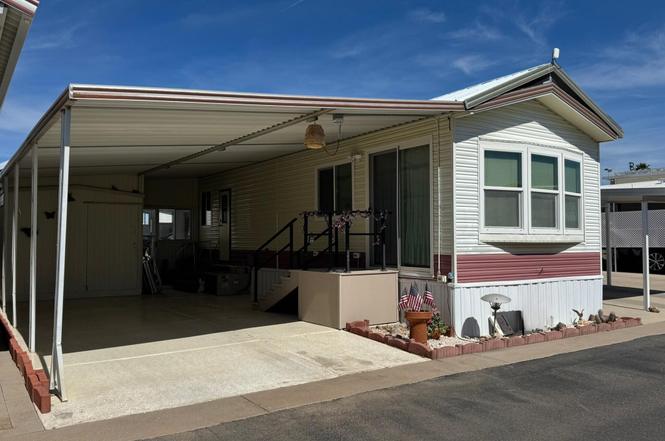
This 1-bed park model in Florence offers simple desert living in Caliente Casa de Sol where you own the land. Built in 1988, this Cavco Carme Park Model features 1 bedroom, 1 bath, and 408 sq ft of living space on a 30x41 lot located on the sunny side of the street. Great potential with light TLC. Home offers a layout with comfortable living, dining, and kitchen space. Situated on the sunny side of the street, and has excellent natural light. A little TLC will make this an ideal winter retreat or full time residence. Caliente Casa de Sol is a gated 55+ active adult community in Florence, Arizona known for its active lifestyle and well maintained environment. Residents enjoy access to a heat
Key facts
- 1,229 sq ft lot
- Parking
- Community pool
Property features AI
Finance
- HOA & community: Has association; Annual association fee of $836 covering grounds maintenance; Community pool; Community spa (heated); Pickleball courts; Golf; Community laundry (coin-op); Biking/walking paths; Fitness center
Exterior
- Parking: 1 covered parking space; Additional purchasable parking; 1 carport space
- Utilities: City water; Public sewer; Utilities: see remarks
- Home design: Manufactured/mobile home; Fee simple ownership
- Construction: Metal siding; Wood frame construction; Painted exterior; Metal roof
- Exterior features: Shed(s); Private maintained road; Asphalt road surface
Interior
- Kitchen: Built-in microwave; Refrigerator; Dishwasher
- Bedrooms: 1 possible bedroom
- Flooring: Carpet; Laminate
- Bathrooms: 1 full bathroom
- Heating & cooling: Electric heating; Central air; Ceiling fans
- Interior features: High-speed internet; Eat-in kitchen; Vaulted ceilings; Full bathroom in primary bedroom; Low-emissivity, dual-pane vinyl frame windows
Neighborhood map
What this means for you Summary
Snapshot
- This is a 1-bed/1.0-bath manufactured listed at $65k.
Deal economics
- At list price, monthly cash flow is $449 ($5k/yr) — positive.
- The deal already cash-flows at list — no discount required.
- Meets the 1% rule at list price ($1k rent vs $65k).
- Recommended offer: $59k (9.0% below list) — sets the bar for market timing.
- Cap rate 14.6% vs local median 4.2% in Florence — top-decile yield for the area; either an underpriced asset or a hidden risk that comps aren't pricing in. Stress-test before assuming the spread holds.
Location & tenants
- Location reads 60/100 on livability (#187 in AZ) — a middle-class / working-renter tenant base. Strengths: crime A+, cost of living A+, housing A+; Watch: amenities F, commute F, health & safety F.
- Florence Unified School District (4437) (rural): math 16% / reading 24% proficiency, ranked #178 of 249 in AZ (top 72%) — low school quality limits family demand, transient renter base, plan for 1-2y turnover.
- Zoned schools: Florence K-8 (math 17% / reading 23%, grade F, #742 of 1,109 statewide, top 67%, 771 students, 56% FRL); Florence High School (math 8% / reading 12%, grade F, #343 of 381 statewide, top 93%, 796 students, 44% FRL).
- Market conditions: Rents rising (+1.3%/yr); 714 active listings in the ZIP; solid renter incomes; 9,504 units permitted in Pinal County in 2024 (776 in 5+ unit buildings).
- This rent is only 17% of the median local income ($79k/yr) — well below the 30% rent-burden line; pricing power to push rent on renewal without tenant pushback.
Forward outlook
- Local home prices are declining (-3.0%/yr); year-one equity from $449 of loan paydown is wiped out by about $2k of value loss. Plan a longer hold.
- At projected returns (-3.0% appreciation + 1.3% rent growth), your $18k cash investment doubles in ~5 years — after that, you're playing with house money.
Negotiation context
- It's been on market 105 days — a 9% lower offer ($59k) is reasonable based on typical stale-listing flexibility.
- Current owner paid $28k; list at $65k implies a 136% gain — meaningful room to come down on a strong offer.
Risks & watch-outs
- Climate carrying-cost: moderate wildfire risk; extreme-heat days projected 3→7/yr by 2055 (HVAC capex compounding) — expect insurance premiums to compound above CPI over the hold.
Questions for the listing agent
- It's been on market 105 days. Have you received any prior offers? Is the seller open to a 9% concession, seller financing, or rate buy-down credit?
- What does the HOA fee cover, when was the last increase, and are there any pending special assessments or reserve-fund shortfalls?
- Why hasn't it sold? Are there any deal-killer items the seller is aware of (foundation, flood, title, zoning, code violations)?
- Is there a deadline driving the sale (1031 exchange, divorce, estate, relocation)? That informs how much negotiation room exists.
- Schools are F-rated, which usually means shorter tenancies and higher turnover. Who's the typical renter profile here, and what's been the actual vacancy rate?
- What's the average days-on-market for RENTAL listings here right now (not sales)? A rising rental-DOM trend means longer vacancies and softer asking-rent achievability than the comps imply.
- What's the recent tenant-quality profile in this submarket — average credit score on applications, eviction rate, late-payment / NSF rate, and stable-employment percentage? A property-management company in the area should have these aggregated.
- How much new for-sale + rental construction is in the pipeline within 1–3 miles? Heavy new supply typically softens prices + rents 12–24 months out; constrained supply supports both.
Investment metrics
- 1% rule
- 1.77% ✓
- Cap rate
- 14.59%
- Cash-on-cash
- 29.63%
- DSCR
- 2.32
- GRM
- 4.7
CMA / ARV
- ARV (on-the-fly)
- $86,100
- Comps found
- 12
Show comp detail 12 sales within ~0.75 mi
| Address | Dist | Beds/Ba | Sqft | Sold | Price | $/sf | Match |
|---|---|---|---|---|---|---|---|
| 210 E Hedge Dr | 0.02mi | 1/1.0 | 409 (-0%) | 6mo | $79,000 | $193 | 94 |
| 208 E Hedge Dr | 0.03mi | 1/1.0 | 392 (-4%) | 1mo | $38,000 | $97 | 90 |
| 204 E Gila Dr | 0.07mi | 1/1.0 | 397 (-3%) | 1mo | $125,000 | $315 | 90 |
| 404 E Ocotillo Dr | 0.18mi | 1/1.0 | 409 (-0%) | 1mo | $43,000 | $105 | 90 |
| 102 E Barrel Cactus Ln | 0.13mi | 1/1.0 | 386 (-6%) | 1mo | $113,000 | $293 | 84 |
| 328 E Palo Verde Ln | 0.15mi | 1/1.0 | 420 (+2%) | 7mo | $137,500 | $327 | 83 |
| 411 E Barrel Cactus Ln | 0.20mi | 1/1.0 | 421 (+3%) | 5mo | $115,000 | $273 | 82 |
| 107 E Maricopa Blvd | 0.14mi | 1/1.0 | 386 (-6%) | 4mo | $81,000 | $210 | 80 |
| 513 E Barrel Cactus Ln | 0.28mi | 1/1.0 | 421 (+3%) | 6mo | $59,900 | $142 | 78 |
| 203 E Cholla Ln | 0.03mi | 1/1.0 | 450 (+10%) | 6mo | $41,000 | $91 | 77 |
| 3551 N Vista Del Sol -- | 0.33mi | 1/1.0 | 385 (-6%) | 1mo | $95,000 | $247 | 73 |
| 107 E Cholla Ln | 0.10mi | 1/1.0 | 363 (-12%) | 4mo | $55,000 | $152 | 73 |
Match score weights: distance 35% · size 25% · config 20% · recency 20%. Top-matched comps best support the ARV.
Projected returns pro-forma
-3.0% appreciation · 1.27% rent growth · sell at horizon
- IRR
- 22.2%
- Equity multiple
- 1.89×
- Total profit
- $16,151
- Equity at exit
- $9,692
- IRR
- 29.0%
- Equity multiple
- 3.38×
- Total profit
- $43,229
- Equity at exit
- $5,620
Cash invested: $18,200 (down + closing). Projections, not guarantees.
Landlord ↔ Tenant lean methodology
- Overall (STATE)
- 87 Strongly Landlord-Friendly
- State Arizona
- 87 Strongly Landlord-Friendly · R+3
- County
- — inherits STATE
- City
- — inherits STATE
ZIP-level market 85132
- Home prices YoY
- -5.2%
- Rents YoY
- 1.3%
- Active inventory
- 714
- Price-to-rent
- 4.7×
Monthly cashflow live
- Estimated rent
- $1,148 medium interval (Pro) →
- Mortgage (P&I)
- −$341
- Tax from tax record
- −$20 /mo · $235/yr
- Insurance
- −$27
- HOA
- −$70
- Vacancy / Maint / Mgmt
- −$241
- Net cashflow
- $449
Break-even live
Sensitivity live
| Price | -10% $486 | -5% $468 | +0% $449 | +5% $431 | +10% $413 |
|---|---|---|---|---|---|
| Rent | -10% $359 | -5% $404 | +0% $449 | +5% $495 | +10% $540 |
| Rate | -1.0pp $482 | -0.5pp $466 | base $449 | +0.5pp $433 | +1.0pp $415 |
UW: 25.0% down · 7.5% · 30yr · 1.5% tax · 5.0% vac · 8.0% maint · 8.0% mgmt
Financing live
Cash to close
- Down payment
- $16,250
- Closing costs
- $1,950
- Reserves months
- —
- Total cash needed
- —
Loan-product check · same deal, 3 products live
Conventional
25% down · 7.5% · 30yr
- Down + closing
- —
- Monthly P&I
- —
- Monthly cashflow
- —
- DSCR
- —
- Eligible?
- —
Personal DTI + credit; lowest rate.
DSCR
20% down · 8.5% · 30yr
- Down + closing
- —
- Monthly P&I
- —
- Monthly cashflow
- —
- DSCR
- —
- Eligible?
- —
No personal income docs; deal must DSCR.
Hard money
10% down · 12.0% · 12mo
- Down + closing
- —
- Monthly P&I
- —
- Monthly cashflow
- —
- DSCR
- —
- Eligible?
- —
Short-term bridge; refi at stabilization.
HOA detail
- Monthly dues
- $70 · $840/yr
- Likely covers
- security
Listing history 19 events
-
2026-06-17status $65,000 Pending 105 DOM
-
2026-06-17days on market $65,000 Under Contract Accepting Backups 105 DOM
-
2026-06-16days on market $65,000 Under Contract Accepting Backups 104 DOM
-
2026-06-15days on market $65,000 Under Contract Accepting Backups 103 DOM
-
2026-06-13days on market $65,000 Under Contract Accepting Backups 101 DOM
-
2026-06-13days on market $65,000 Under Contract Accepting Backups 100 DOM
-
2026-06-09days on market $65,000 Under Contract Accepting Backups 97 DOM
-
2026-06-08days on market $65,000 Under Contract Accepting Backups 96 DOM
-
2026-06-07days on market $65,000 Under Contract Accepting Backups 95 DOM
-
2026-06-04days on market $65,000 Under Contract Accepting Backups 92 DOM
-
2026-06-03days on market $65,000 Under Contract Accepting Backups 91 DOM
-
2026-06-02days on market $65,000 Under Contract Accepting Backups 90 DOM
-
2026-06-01days on market $65,000 Under Contract Accepting Backups 89 DOM
-
2026-05-31days on market $65,000 Under Contract Accepting Backups 88 DOM
-
2026-04-24historical Under Contract Accepting Backups
-
2026-03-04$65,000 Active
-
2026-03-01price $65,000
-
2001-02-27soldstatus $27,500
-
1987-11-24soldstatus $7,200
ⓘ Source: listings_history table (triggers on properties + properties_extension) + one-shot
backfill from property_details.listing_events for pre-trigger history.
Tax reassessment forecast AZ · Resets to sale price
- Current annual tax
- $235 · $20/mo
- Projected year-2 tax
- $429 · $36/mo
- Expected delta
- +$194/yr (+$16/mo · 82.9%)
ⓘ Screening estimate from a state-policy table — verify with the county assessor before closing.
Climate risk First Street
- Flood 3/10 Moderate FEMA zone X (unshaded) · 20% chance over 30 yrs
- Wildfire 5/10 Major
- Heat 8/10 Severe 3 d/yr ≥112°F today · 7 d/yr by 30 yrs out
- Wind 1/10 Low
- Air quality 2/10 Low 0 unhealthy d/yr today · 1 by 30 yrs out
Nearby sold comps map
Loading sold comps map…
Walkable amenities ~0.75 mi
Loading nearby amenities…
Taxation est. · year 1
- Rental income
- $13,776
- − Mortgage interest
- −$3,641
- − Property taxes
- −$235
- − Insurance
- −$325
- − Repairs & maintenance
- −$1,102
- − Management
- −$1,102
- − HOA
- −$840
- − Depreciation
- −$1,891
- Taxable income
- $4,641
- Est. tax owed @ 24.0%
- −$1,114
- After-tax cash flow
- $4,280/yr
For passive investors: Depreciation is non-cash, so a rental often shows a tax loss while cash-flowing — sheltering income. Rental losses are passive: they offset passive income freely, and up to $25,000/yr can offset ordinary (W-2) income if you actively participate and your MAGI is under $100k (phasing out to $0 by $150k); unused losses carry forward. On sale, claimed depreciation is recaptured at up to 25%, and gains may owe capital-gains tax (a 1031 exchange can defer both). Figures are a year-1 estimate at your 24.0% rate — not tax advice; consult a CPA.
Schools (NCES district)
- District
- Florence Unified School District (4437)
- NCES district ID
- 0402920
- Math proficiency
- 16% ▼ -11.00%
- Reading proficiency
- 24% ▼ -7.00%
- Median HH income
- $54,426
- Composite
- 18.31/100
- National rank
- #8950
- State rank
- #178 of 249 in AZ
Livability — Florence
- Score
- 60/100
- State rank
- #187
- US rank
- #19483
Category grades
Schools grade is shown separately in the Schools card above.
Census & demographics
- Census place
- Florence, AZ
- County
- Pinal County · 399,947 people
- City population
- 38,671
- Metro
- Phoenix-Mesa-Chandler, AZ
- Population (ZIP)
- 38,671
- Household income
- $79,000
- Rent vs Own
- Severe rent burden
- 102.0
Population outlook (Pinal County) Hauer SSP2
- Today (2025)
- 437,574 people
- By 2030
- 446,903 · +2.1%
- By 2040
- 452,589 · +3.4%
- By 2050
- 444,126 · +1.5%
- By 2075
- 430,300 · -1.7%
- By 2100
- 393,536 · -10.1%
Race, ethnicity, and origin ACS 2023
- Neighborhood character
- Diverse neighborhood (Simpson 0.56)
- Race & ethnicity
- White 59% Hispanic / Latino 28% Two or more races 9% Black 7% Native American 3%
- Hispanic origin (detail)
- Mexican 23%
- Common ancestry
- Italian 5% Portuguese 2% Romanian 2%
- Foreign-born
- 9% · Canada
- Languages at home
- 79% English-only · Spanish 17% German/W. Germanic 1% Russian/Polish/Slavic 1%
Political lean MEDSL · Pinal
- 2024 margin
- Strong R (+22.1) · D 38.5% · R 60.6%
- 2008→2024 swing
- -7.6pp toward R · 2008: -14.5pp · 2024: -22.1pp
- All cycles
- 2024: R+22.1 2020: R+17.3 2016: R+19.3 2012: R+17.1 2008: R+14.5
Not yet ingested
- Civics
- —
Market trends
- HPI YoY
- ▼ -12.75%
- Current HPI
- 233.6644
- Rent YoY
- ▲ 1.27%
- Metro
- Phoenix-Mesa-Chandler, AZ
- State GDP YoY
- ▲ 4.54%
- F500 in state
- 20
Industry mix (Fortune 500 HQ in AZ)
| Industry | F500 HQs | Revenue |
|---|---|---|
| Technology | 2 | $13B |
|
||
| Mining / Metals | 1 | $23B |
|
||
| Environmental Services | 1 | $16B |
|
||
| Metals / Steel | 1 | $14B |
|
||
| Technology Distribution | 1 | $9B |
|
||
| Homebuilding | 1 | $8B |
|
||
Price history
+802.8% since first listed5 events — show timeline
- 2026-04-24 Contingent — ARMLS
- 2026-03-04 Listed $65,000 ARMLS
- 2026-03-01 Price Changed $65,000 ARMLS
- 2001-02-27 Sold (Public Records) $27,500 Public Records
- 1987-11-24 Sold (Public Records) $7,200 Public Records
Property tax history
-0.5%/yrLatest (2025): $235 · +2.4% YoY. Source: county tax records.
Cash-flow waterfall
monthlySold comps — $/sqft
last 12 mo · ≤1 miLoading sold comps…