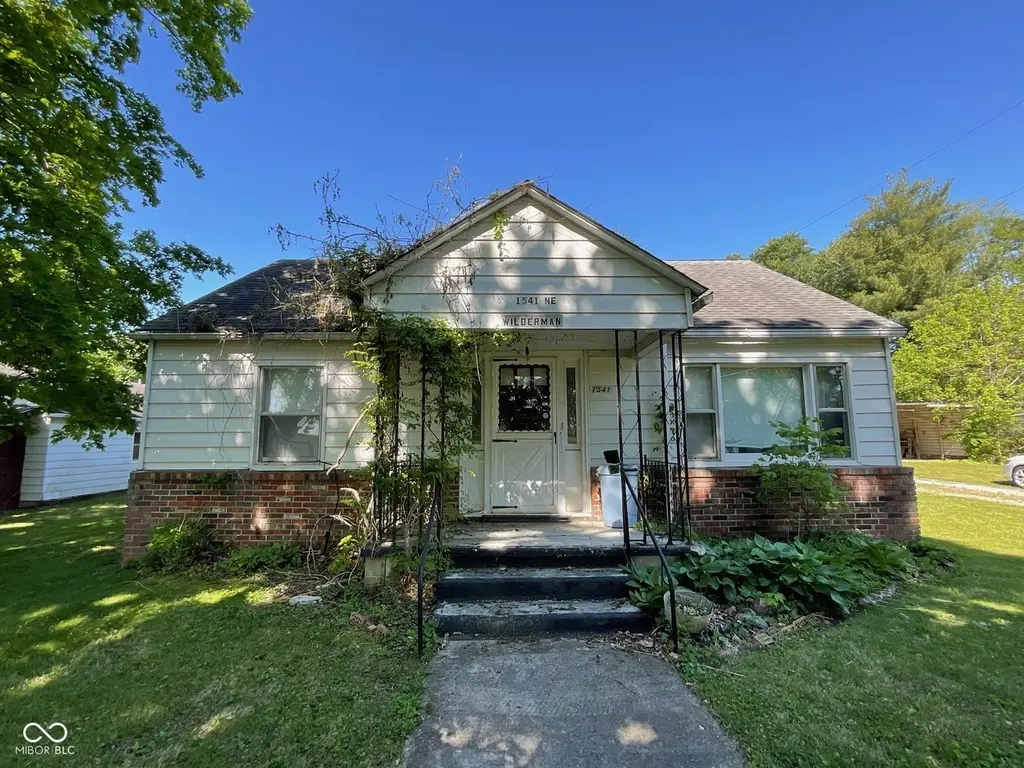
1541 N East St · Montezuma, IN
Flood risk 1/10 · Minimal
- FEMA flood zone
- X (unshaded)
- Chance of flooding over 30 yrs
- 0.0%
- Est. flood insurance / yr
- $473 – $860
Fire risk 1/10 · Minimal
- Est. fire insurance / yr
- $717 – $1,331
Heat risk 4/10 · Minor
- Hot days now (above 105°F)
- 7 days/yr
- Hot days in 30 yrs
- 18 days/yr
Wind risk 2/10 · Minimal
- Chance of severe wind over 30 yrs
- 1.0%
Air-quality risk 2/10 · Minimal
- Unhealthy air days now
- 1 days/yr
- Unhealthy air days in 30 yrs
- 2 days/yr
Risk factors via First Street. Map © Google.
Why this score? — see what drove the A- grade
The composite is a weighted blend of 9 inputs, each scored 0–100. Each bar is that input's sub-score; the figure is the points it added to the 100-point composite (weight × sub-score).
- Cash flow +30.0/30.0
- ARV discount +15.0/15.0
- DSCR +10.0/10.0
- 1% rule +8.9/10.0
- Appreciation +5.5/10.0
- Livability +3.2/5.0
- Schools +3.0/10.0
- Rent growth +2.5/5.0
- Condition / age +2.5/5.0
$79,900
🖨 Deal sheet 📄 Offer letter ✓ Due diligence
Listing remarks
Welcome to 1541 North East Street in the charming town of Montezuma! This inviting bungalow-style home, built in 1951, offers 1,386 square feet of comfortable living space and sits on a . 27-acre lot - plus an additional adjoining . 27-acre lot included with the property, giving you extra space and possibilities. Nestled in a peaceful neighborhood surrounded by mature trees, this property is full of character, warmth, and potential. Inside, you'll find two bedrooms, one full bath, one half-bath, a walk-in shower, spacious kitchen with double oven, full basement, cozy porch, and timeless bungalow charm throughout. Whether you're looking for a comfortable place to call home, room to grow, or
Key facts
- Spacious kitchen
- Double oven
- Bungalow style home
Tags
Property features AI
Finance
- Other: Approximately 0.27-acre lot (about 1/4–1/2 acre); Has additional parcel(s)
Exterior
- Parking: Carport
- Utilities: Public water; Municipal sewer connected; No solid waste service listed
- Home design: Single family residence; One story
- Construction: Aluminum siding and brick exterior; Block foundation
- Exterior features: Covered patio/porch; City lot with access
Interior
- Kitchen: Gas cooktop; Double oven; Range hood; Microwave
- Bedrooms: Two main-level bedrooms
- Bathrooms: One full bath and one half bath on the main level
- Heating & cooling: Forced air heating (natural gas); Central air conditioning
- Interior features: Finished basement with partial finished ceiling
- Laundry & utility: Laundry in basement
Neighborhood map
What this means for you Summary
Snapshot
- This is a 2-bed/1.5-bath single-family listed at $80k.
Deal economics
- At list price, monthly cash flow is $324 ($4k/yr) — positive.
- The deal already cash-flows at list — no discount required.
- Meets the 1% rule at list price ($1k rent vs $80k).
Location & tenants
- Location reads 65/100 on livability (#314 in IN) — a middle-class / working-renter tenant base. Strengths: cost of living A+, housing A+, health & safety A; Watch: employment C-, crime D+, amenities F.
- Southwest Parke Community School Corporation (rural): math 34% / reading 36% proficiency, ranked #195 of 301 in IN (top 65%) — families likely to look elsewhere, expect single-tenant / working-renter base with shorter leases.
- Zoned schools: Montezuma Elementary School (math 47% / reading 37%, grade F, #434 of 994 statewide, top 48%, 232 students, 66% FRL); Riverton Parke Jr-Sr High School (math 23% / reading 39%, grade F, #303 of 369 statewide, top 82%, 472 students, 53% FRL).
- Market conditions: 10 active listings in the ZIP; 61 units permitted in Parke County in 2024 (0 in 5+ unit buildings).
Forward outlook
- In year one you build about $1k of equity ($552 loan paydown + $874 appreciation (1.1% local appreciation)).
- Parke County population projected at -10% by 2050 — secular population decline; favor cash flow + early exit over multi-decade hold.
- At projected returns (1.1% appreciation + 3.0% rent growth), your $22k cash investment doubles in ~4 years — after that, you're playing with house money.
Negotiation context
- Only 6 days on market — expect competitive offers; lowballing is unlikely to land.
Risks & watch-outs
- Watch-outs: built in 1951 — expect roof / HVAC / electrical / plumbing capex.
Questions for the listing agent
- Built in 1951 — when were the roof, HVAC, electrical panel, plumbing, and water heater last replaced?
- Is there a deadline driving the sale (1031 exchange, divorce, estate, relocation)? That informs how much negotiation room exists.
- Schools are D-rated, which usually means shorter tenancies and higher turnover. Who's the typical renter profile here, and what's been the actual vacancy rate?
- Crime grade is D in this area — have there been break-ins, vandalism, or insurance claims at this property in the last 3 years? What carrier currently insures it and at what premium?
- What's the average days-on-market for RENTAL listings here right now (not sales)? A rising rental-DOM trend means longer vacancies and softer asking-rent achievability than the comps imply.
- What's the recent tenant-quality profile in this submarket — average credit score on applications, eviction rate, late-payment / NSF rate, and stable-employment percentage? A property-management company in the area should have these aggregated.
- How much new for-sale + rental construction is in the pipeline within 1–3 miles? Heavy new supply typically softens prices + rents 12–24 months out; constrained supply supports both.
Investment metrics
- 1% rule
- 1.39% ✓
- Cap rate
- 11.16%
- Cash-on-cash
- 17.38%
- DSCR
- 1.77
- GRM
- 6.0
CMA / ARV
- ARV (on-the-fly)
- $121,968
- Comps found
- 3
Show comp detail 3 sales within ~0.75 mi
| Address | Dist | Beds/Ba | Sqft | Sold | Price | $/sf | Match |
|---|---|---|---|---|---|---|---|
| 354 Bloomingdale Rd | 0.19mi | 2/1.0 | 1,458 (+5%) | 4mo | $120,000 | $82 | 77 |
| 425 E Sylvester St | 0.30mi | 3/1.0 (+1) | 1,247 (-10%) | 1mo | $109,900 | $88 | 62 |
| 1696 N Washington St | 0.14mi | 3/1.0 (+1) | 1,456 (+5%) | 22mo | $150,000 | $103 | 60 |
Match score weights: distance 35% · size 25% · config 20% · recency 20%. Top-matched comps best support the ARV.
Projected returns pro-forma
1.09% appreciation · 3.0% rent growth · sell at horizon
- IRR
- 19.6%
- Equity multiple
- 2.01×
- Total profit
- $22,515
- Equity at exit
- $27,666
- IRR
- 22.6%
- Equity multiple
- 3.76×
- Total profit
- $61,704
- Equity at exit
- $37,068
Cash invested: $22,372 (down + closing). Projections, not guarantees.
Landlord ↔ Tenant lean methodology
- Overall (STATE)
- 90 Strongly Landlord-Friendly
- State Indiana
- 90 Strongly Landlord-Friendly · R+11
- County
- — inherits STATE
- City
- — inherits STATE
ZIP-level market 47862
- Home prices YoY
- 0.5%
- Active inventory
- 10
- Price-to-rent
- 6.0×
Monthly cashflow live
- Estimated rent
- $1,109 medium interval (Pro) →
- Mortgage (P&I)
- −$419
- Tax est. 1.5%
- −$100 /mo · $1,198/yr
- Insurance
- −$33
- HOA
- −$0
- Vacancy / Maint / Mgmt
- −$233
- Net cashflow
- $324
Break-even live
UW: 25.0% down · 7.5% · 30yr · 1.5% tax · 5.0% vac · 8.0% maint · 8.0% mgmt
Financing live
Cash to close
- Down payment
- $19,975
- Closing costs
- $2,397
- Reserves months
- —
- Total cash needed
- —
Loan-product check · same deal, 3 products live
Conventional
25% down · 7.5% · 30yr
- Down + closing
- —
- Monthly P&I
- —
- Monthly cashflow
- —
- DSCR
- —
- Eligible?
- —
Personal DTI + credit; lowest rate.
DSCR
20% down · 8.5% · 30yr
- Down + closing
- —
- Monthly P&I
- —
- Monthly cashflow
- —
- DSCR
- —
- Eligible?
- —
No personal income docs; deal must DSCR.
Hard money
10% down · 12.0% · 12mo
- Down + closing
- —
- Monthly P&I
- —
- Monthly cashflow
- —
- DSCR
- —
- Eligible?
- —
Short-term bridge; refi at stabilization.
Listing history 2 events
-
2026-05-19status Pending
-
2026-05-13$79,900 Active
ⓘ Source: listings_history table (triggers on properties + properties_extension) + one-shot
backfill from property_details.listing_events for pre-trigger history.
Climate risk First Street
- Flood 1/10 Low FEMA zone X (unshaded) · 0% chance over 30 yrs
- Wildfire 1/10 Low
- Heat 4/10 Moderate 7 d/yr ≥105°F today · 18 d/yr by 30 yrs out
- Wind 2/10 Low 100% chance of damaging wind over 30 yrs
- Air quality 2/10 Low 1 unhealthy d/yr today · 2 by 30 yrs out
Nearby sold comps map
Loading sold comps map…
Walkable amenities ~0.75 mi
Loading nearby amenities…
Taxation est. · year 1
- Rental income
- $13,309
- − Mortgage interest
- −$4,476
- − Property taxes
- −$1,198
- − Insurance
- −$400
- − Repairs & maintenance
- −$1,065
- − Management
- −$1,065
- − Depreciation
- −$2,324
- Taxable income
- $2,782
- Est. tax owed @ 24.0%
- −$668
- After-tax cash flow
- $3,221/yr
For passive investors: Depreciation is non-cash, so a rental often shows a tax loss while cash-flowing — sheltering income. Rental losses are passive: they offset passive income freely, and up to $25,000/yr can offset ordinary (W-2) income if you actively participate and your MAGI is under $100k (phasing out to $0 by $150k); unused losses carry forward. On sale, claimed depreciation is recaptured at up to 25%, and gains may owe capital-gains tax (a 1031 exchange can defer both). Figures are a year-1 estimate at your 24.0% rate — not tax advice; consult a CPA.
Schools (NCES district)
- District
- Southwest Parke Community School Corporation
- NCES district ID
- 1810900
- Math proficiency
- 34% ▼ -4.00%
- Reading proficiency
- 36% ▼ -6.00%
- Median HH income
- $42,288
- Composite
- 29.61/100
- National rank
- #6474
- State rank
- #195 of 301 in IN
Livability — Montezuma
- Score
- 65/100
- State rank
- #314
- US rank
- #12442
Category grades
Schools grade is shown separately in the Schools card above.
Census & demographics
- Census place
- Montezuma, IN
- Population (ZIP)
- 1,262
Population outlook (Parke County) Hauer SSP2
- Today (2025)
- 15,937 people
- By 2030
- 15,467 · -2.9%
- By 2040
- 14,793 · -7.2%
- By 2050
- 14,318 · -10.2%
- By 2075
- 13,484 · -15.4%
- By 2100
- 12,236 · -23.2%
Race, ethnicity, and origin ACS 2023
- Neighborhood character
- Predominantly White (87%)
- Race & ethnicity
- White 87% Two or more races 10% Hispanic / Latino 10% Black 2%
- Hispanic origin (detail)
- Mexican 10%
- Common ancestry
- Iranian 2% Slovak 2% Romanian 2%
- Foreign-born
- 2% · Canada, Jamaica
- Languages at home
- 95% English-only · Spanish 5%
Political lean MEDSL · Parke
- 2024 margin
- Solid R (+56.9) · D 20.6% · R 77.5% · Other 1.9%
- 2008→2024 swing
- -42.8pp toward R · 2008: -14.1pp · 2024: -56.9pp
- All cycles
- 2024: R+56.9 2020: R+55.5 2016: R+52.0 2012: R+32.6 2008: R+14.1
Not yet ingested
- Civics
- —
Market trends
- HPI YoY
- ▲ 1.09%
- Current HPI
- 212.829
- Rent YoY
- —
- Metro
- —
- State GDP YoY
- ▲ 2.90%
- F500 in state
- 18
Industry mix (Fortune 500 HQ in IN)
| Industry | F500 HQs | Revenue |
|---|---|---|
| Industrial Machinery | 2 | $37B |
|
||
| Healthcare | 1 | $177B |
|
||
| Pharmaceuticals | 1 | $45B |
|
||
| Metals / Steel | 1 | $18B |
|
||
| Agriculture | 1 | $17B |
|
||
| Packaging | 1 | $12B |
|
||
Price history
2 events — show timeline
- 2026-05-19 Pending — MIBOR as Distributed by MLS Grid
- 2026-05-13 Listed $79,900 MIBOR as Distributed by MLS Grid
Cash-flow waterfall
monthlySold comps — $/sqft
last 12 mo · ≤1 miLoading sold comps…