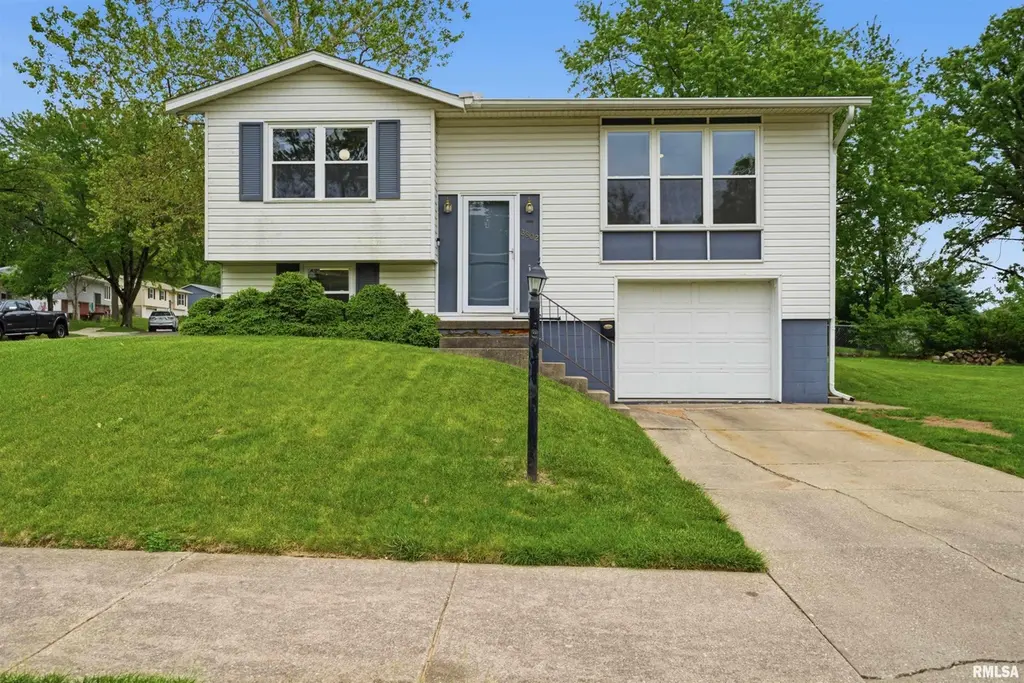
3802 W Creighton Ter · Peoria, IL
Flood risk 1/10 · Minimal
- FEMA flood zone
- X
- Chance of flooding over 30 yrs
- 0.0%
- Est. flood insurance / yr
- $473 – $860
Fire risk 1/10 · Minimal
- Est. fire insurance / yr
- $804 – $1,492
Heat risk 3/10 · Minor
- Hot days now (above 104°F)
- 7 days/yr
- Hot days in 30 yrs
- 18 days/yr
Wind risk 2/10 · Minimal
- Chance of severe wind over 30 yrs
- 1.0%
Air-quality risk 2/10 · Minimal
- Unhealthy air days now
- 1 days/yr
- Unhealthy air days in 30 yrs
- 2 days/yr
Risk factors via First Street. Map © Google.
Why this score? — see what drove the F grade
The composite is a weighted blend of 9 inputs, each scored 0–100. Each bar is that input's sub-score; the figure is the points it added to the 100-point composite (weight × sub-score).
- Cash flow +15.0/30.0
- DSCR +4.6/10.0
- 1% rule +4.3/10.0
- Livability +3.7/5.0
- Rent growth +2.5/5.0
- Condition / age +2.5/5.0
- Schools +1.1/10.0
- ARV discount +0.0/15.0
- Appreciation +0.0/10.0
$159,900
🖨 Deal sheet 📄 Offer letter ✓ Due diligence
Listing remarks
Take a look at this spacious 3 bedroom home sitting on a large corner lot in Richwoods School District. Living room features beautiful hardwood flooring and large picture window to let in plenty of natural light. All 3 bedrooms complete with hardwood flooring and fresh paint. Entertain guests or have movie night in the lower level family room. You will love the extra storage options with the oversized garage and new shed. New furnace, a/c, and roof 2023. Gutter Guards 2024 and water heater 2025. So much to love about this home. .. Schedule a showing today!
Key facts
- 8,276 sq ft lot
- Garage
- Built 1968
Property features AI
Finance
- Other: Corner lot dimensions approximately 110 x 75
- HOA & community: No association fee
Exterior
- Parking: Attached garage with 1 space; On-street parking available; Paved parking
- Utilities: Public water; Public sewer
- Home design: Single-family residence; Built in 1968
- Construction: Shingle roof; Built in 1968
- Exterior features: Replacement windows; Shingle roof; Corner, level lot; Paved road access
Interior
- Kitchen: Kitchen on main level
- Bedrooms: 3 bedrooms; bedrooms on main level
- Flooring: Hardwood flooring in bedrooms and living room; Carpet in lower-level family room; Vinyl flooring in kitchen; Other flooring in lower-level laundry
- Bathrooms: 1 full bathroom
- Heating & cooling: Forced-air heating; Gas water heater; Central air conditioning
- Interior features: Wood-burning stove in family room (non-functional); Fireplace present (non-functional)
- Laundry & utility: Laundry room on lower level
Neighborhood map
What this means for you Summary
Snapshot
- This is a 3-bed/1.0-bath single-family listed at $160k.
Deal economics
- At list price, monthly cash flow is $51 ($611/yr) — positive.
- The deal already cash-flows at list — no discount required.
- To meet the 1% rule (rent ≥ 1% of price), the offer needs to be $148k (7.5% below list).
- Recommended offer: $148k (7.5% below list) — sets the bar for 1% rule.
Location & tenants
- Location reads 73/100 on livability (#270 in IL) — a middle-class / working-renter tenant base. Strengths: commute A+, cost of living A+, housing A+; Watch: employment D+, crime F.
- Peoria SD 150 (urban): math 11% / reading 14% proficiency, ranked #554 of 620 in IL (top 89%) — low school quality limits family demand, transient renter base, plan for 1-2y turnover; 70% free/reduced lunch — lower-income household profile, screen leases tightly.
- Zoned schools: Charter Oak Primary School (math 27% / reading 27%, grade F, #749 of 2,056 statewide, top 40%, 326 students, 0% FRL); Mark W Bills Middle School (math 12% / reading 17%, grade F, #517 of 665 statewide, top 79%, 262 students, 0% FRL); Richwoods High School (math 30% / reading 35%, grade F, #152 of 693 statewide, top 22%, 1,580 students, 0% FRL) — zoned schools average 0% FRL vs 70% district-wide (70 pts lower); this property's tenant base skews higher-income than the district average.
- Zoned-school proficiency averages 25% at this address vs 12% district-wide (+12 pts) — the actual schools serving this property are materially stronger than the Peoria SD 150 average implies; a family-tenant draw the district grade alone would hide.
- Market conditions: 127 active listings in the ZIP; 7 comparable units currently listed for rent nearby; rentals leasing fast (median 14d on market — plan ~1-2 weeks tenant-placement turnaround); 43% of comp listings sitting > 30 days — soft ceiling on asking rent; solid renter incomes; 73 units permitted in Peoria County in 2024 (0 in 5+ unit buildings).
Forward outlook
- Local home prices are declining (-3.0%/yr); year-one equity from $1k of loan paydown is wiped out by about $5k of value loss. Plan a longer hold.
- Peoria County population projected at -11% by 2050 — secular population decline; favor cash flow + early exit over multi-decade hold.
Negotiation context
- It's been on market 23 days — a 2% lower offer ($158k) is reasonable based on typical stale-listing flexibility.
Questions for the listing agent
- Built in 1968 — when were the roof, HVAC, electrical panel, plumbing, and water heater last replaced?
- Is there a deadline driving the sale (1031 exchange, divorce, estate, relocation)? That informs how much negotiation room exists.
- Schools are F-rated, which usually means shorter tenancies and higher turnover. Who's the typical renter profile here, and what's been the actual vacancy rate?
- Crime grade is F in this area — have there been break-ins, vandalism, or insurance claims at this property in the last 3 years? What carrier currently insures it and at what premium?
- The area grade is low — what's the realistic commute time and amenity access for the typical tenant pool here? Any planned neighborhood developments (good or bad) we should know about?
- What's the average days-on-market for RENTAL listings here right now (not sales)? A rising rental-DOM trend means longer vacancies and softer asking-rent achievability than the comps imply.
- What's the recent tenant-quality profile in this submarket — average credit score on applications, eviction rate, late-payment / NSF rate, and stable-employment percentage? A property-management company in the area should have these aggregated.
- How much new for-sale + rental construction is in the pipeline within 1–3 miles? Heavy new supply typically softens prices + rents 12–24 months out; constrained supply supports both.
Investment metrics
- 1% rule
- 0.93% ✗
- Cap rate
- 6.68%
- Cash-on-cash
- 1.36%
- DSCR
- 1.06
- GRM
- 9.0
CMA / ARV
- ARV (on-the-fly)
- $131,506
- Comps found
- 9
Show comp detail 9 sales within ~0.75 mi
| Address | Dist | Beds/Ba | Sqft | Sold | Price | $/sf | Match |
|---|---|---|---|---|---|---|---|
| 6345 N Randwick Rd | 0.15mi | 3/1.5 | 1,465 (+5%) | 2mo | $140,500 | $96 | 81 |
| 3813 W Brighton Ave | 0.20mi | 3/1.0 | 1,533 (+10%) | 11mo | $139,900 | $91 | 65 |
| 3909 W Creighton Ter | 0.14mi | 3/1.5 | 1,248 (-11%) | 13mo | $143,000 | $115 | 63 |
| 3702 W Creighton Ter | 0.06mi | 3/1.0 | 1,603 (+15%) | 12mo | $150,000 | $94 | 63 |
| 3713 W Pagewood Dr | 0.28mi | 4/1.5 (+1) | 1,555 (+11%) | 0mo | $92,900 | $60 | 61 |
| 3817 W Pagewood Dr | 0.33mi | 3/2.0 | 1,440 (+3%) | 23mo | $125,000 | $87 | 56 |
| 3803 W Carmel Ave | 0.27mi | 3/1.5 | 1,525 (+9%) | 18mo | $108,000 | $71 | 56 |
| 4324 W Shawnda Ct | 0.62mi | 2/1.5 (-1) | 1,258 (-10%) | 9mo | $130,000 | $103 | 40 |
| 4410 W Cathy Cir | 0.66mi | 2/2.0 (-1) | 1,189 (-15%) | 0mo | $124,900 | $105 | 35 |
Match score weights: distance 35% · size 25% · config 20% · recency 20%. Top-matched comps best support the ARV.
Projected returns pro-forma
-3.0% appreciation · 3.0% rent growth · sell at horizon
- IRR
- -14.1%
- Equity multiple
- 0.49×
- Total profit
- $-22,637
- Equity at exit
- $23,842
- IRR
- -5.3%
- Equity multiple
- 0.66×
- Total profit
- $-15,413
- Equity at exit
- $13,825
Cash invested: $44,772 (down + closing). Projections, not guarantees.
Landlord ↔ Tenant lean methodology
- Overall (STATE)
- 43 Moderately Tenant-Leaning
- State Illinois
- 43 Moderately Tenant-Leaning · D+7
- County
- — inherits STATE
- City
- — inherits STATE
ZIP-level market 61615
- Home prices YoY
- -32.2%
- Active inventory
- 127
- Price-to-rent
- 9.0×
Monthly cashflow live
- Estimated rent
- $1,479 high interval (Pro) →
- Mortgage (P&I)
- −$839
- Tax from tax record
- −$212 /mo · $2,549/yr
- Insurance
- −$67
- HOA
- −$0
- Vacancy / Maint / Mgmt
- −$311
- Net cashflow
- $51
Break-even live
UW: 25.0% down · 7.5% · 30yr · 1.5% tax · 5.0% vac · 8.0% maint · 8.0% mgmt
Financing live
Cash to close
- Down payment
- $39,975
- Closing costs
- $4,797
- Reserves months
- —
- Total cash needed
- —
Loan-product check · same deal, 3 products live
Conventional
25% down · 7.5% · 30yr
- Down + closing
- —
- Monthly P&I
- —
- Monthly cashflow
- —
- DSCR
- —
- Eligible?
- —
Personal DTI + credit; lowest rate.
DSCR
20% down · 8.5% · 30yr
- Down + closing
- —
- Monthly P&I
- —
- Monthly cashflow
- —
- DSCR
- —
- Eligible?
- —
No personal income docs; deal must DSCR.
Hard money
10% down · 12.0% · 12mo
- Down + closing
- —
- Monthly P&I
- —
- Monthly cashflow
- —
- DSCR
- —
- Eligible?
- —
Short-term bridge; refi at stabilization.
Rent comps 7 comps
| Address | Beds | Baths | Sqft | Rent | $/sqft | DOM | Units | Dist |
|---|---|---|---|---|---|---|---|---|
| 3910 W Verner Dr Peoria, IL | 4.0 | 2.0 | 1776 | $1,800 | $1.01 | 43d | 1 | 0.43mi |
| 4105 W Hollow Creek Dr Peoria, IL | 2.0 | 2.0 | 1121 | $1,300 | $1.16 | 13d | 3 | 0.50mi |
| 2913 W Cannes Dr Unit C Peoria, IL | 2.0 | 2.0 | 884 | $1,150 | $1.30 | 43d | 1 | 0.83mi |
| 5505 N Frostwood Pkwy Peoria, IL | 2.0 | 2.0 | 1030 | $1,490 | $1.45 | 13d | 1 | 0.86mi |
| 2800 W War Memorial Dr Peoria, IL | 2.0 | 1.5 | 950 | $949 | $1.00 | 13d | 3 | 0.94mi |
| 3207 W Willow Knolls Dr Peoria, IL | 2.0 | 1.5 | 1000 | $1,100 | $1.10 | 43d | 1 | 0.99mi |
| 6900 N Summershade Cir Peoria, IL | 1.0–2.0 | 1.0–2.0 | 832 | $1,340 | $1.61 | 13d | 3 | 1.21mi |
Listing history 11 events
-
2026-06-13statusdays on market $159,900 Pending 23 DOM
-
2026-06-10days on market $159,900 Active 22 DOM
-
2026-06-09days on market $159,900 Active 21 DOM
-
2026-06-08days on market $159,900 Active 20 DOM
-
2026-06-07days on market $159,900 Active 19 DOM
-
2026-06-03days on market $159,900 Active 15 DOM
-
2026-06-02days on market $159,900 Active 14 DOM
-
2026-06-01days on market $159,900 Active 13 DOM
-
2026-05-31days on market $159,900 Active 12 DOM
-
2026-05-30days on market $159,900 Active 11 DOM
-
2026-05-18$159,900 Active
ⓘ Source: listings_history table (triggers on properties + properties_extension) + one-shot
backfill from property_details.listing_events for pre-trigger history.
Tax reassessment forecast IL · Partial reset (capped growth)
- Current annual tax
- $2,549 · $212/mo
- Projected year-2 tax
- $3,089 · $257/mo
- Expected delta
- +$540/yr (+$45/mo · 21.2%)
ⓘ Screening estimate from a state-policy table — verify with the county assessor before closing.
Climate risk First Street
- Flood 1/10 Low FEMA zone X · 0% chance over 30 yrs
- Wildfire 1/10 Low
- Heat 3/10 Moderate 7 d/yr ≥104°F today · 18 d/yr by 30 yrs out
- Wind 2/10 Low 100% chance of damaging wind over 30 yrs
- Air quality 2/10 Low 1 unhealthy d/yr today · 2 by 30 yrs out
Nearby sold comps map
Loading sold comps map…
Walkable amenities ~0.75 mi
Loading nearby amenities…
Taxation est. · year 1
- Rental income
- $17,749
- − Mortgage interest
- −$8,957
- − Property taxes
- −$2,549
- − Insurance
- −$800
- − Repairs & maintenance
- −$1,420
- − Management
- −$1,420
- − Depreciation
- −$4,652
- Taxable loss
- −$2,048
- Est. tax savings @ 24.0%
- +$491
- After-tax cash flow
- $1,103/yr
For passive investors: Depreciation is non-cash, so a rental often shows a tax loss while cash-flowing — sheltering income. Rental losses are passive: they offset passive income freely, and up to $25,000/yr can offset ordinary (W-2) income if you actively participate and your MAGI is under $100k (phasing out to $0 by $150k); unused losses carry forward. On sale, claimed depreciation is recaptured at up to 25%, and gains may owe capital-gains tax (a 1031 exchange can defer both). Figures are a year-1 estimate at your 24.0% rate — not tax advice; consult a CPA.
Schools (NCES district)
- District
- Peoria SD 150
- NCES district ID
- 1731230
- Math proficiency
- 11% ▼ -5.00%
- Reading proficiency
- 14% ▼ -4.00%
- Median HH income
- $41,951
- Composite
- 10.92/100
- National rank
- #9751
- State rank
- #554 of 620 in IL
Livability — Peoria
- Score
- 73/100
- State rank
- #270
- US rank
- #5096
Category grades
Schools grade is shown separately in the Schools card above.
Census & demographics
- Census place
- Peoria, IL
- County
- Peoria County · 120,495 people
- City population
- 114,670
- Metro
- Peoria, IL
- Population (ZIP)
- 23,523
- Household income
- $79,817
- Rent vs Own
- Severe rent burden
- 833.0
Population outlook (Peoria County) Hauer SSP2
- Today (2025)
- 183,007 people
- By 2030
- 179,643 · -1.8%
- By 2040
- 171,782 · -6.1%
- By 2050
- 163,508 · -10.7%
- By 2075
- 140,178 · -23.4%
- By 2100
- 114,493 · -37.4%
Race, ethnicity, and origin ACS 2023
- Neighborhood character
- Predominantly White (72%)
- Race & ethnicity
- White 72% Asian 10% Black 8% Hispanic / Latino 7% Two or more races 5%
- Hispanic origin (detail)
- Mexican 5%
- Common ancestry
- Italian 3% Romanian 3% Lithuanian 2%
- Foreign-born
- 13% · China, Canada, Jamaica
- Languages at home
- 83% English-only · Other Indo-European 4% Spanish 4% Chinese 3%
Political lean MEDSL · Peoria
- 2024 margin
- Toss-up / Even · D 51.5% · R 46.9% · Other 1.6%
- 2008→2024 swing
- -9.2pp toward R · 2008: 13.9pp · 2024: 4.7pp
- All cycles
- 2024: D+4.7 2020: D+6.3 2016: D+2.8 2012: D+4.4 2008: D+13.9
Not yet ingested
- Civics
- —
Market trends
- HPI YoY
- ▼ -79.30%
- Current HPI
- 166.9745
- Rent YoY
- —
- Metro
- Peoria, IL
- State GDP YoY
- ▲ 1.59%
- F500 in state
- 60
Industry mix (Fortune 500 HQ in IL)
| Industry | F500 HQs | Revenue |
|---|---|---|
| Insurance | 4 | $201B |
|
||
| Consumer Goods | 4 | $87B |
|
||
| Industrial Machinery | 3 | $64B |
|
||
| Healthcare | 2 | $55B |
|
||
| Retail / Pharmacy | 1 | $148B |
|
||
| Agriculture / Food | 1 | $86B |
|
||
Price history
1 event — show timeline
- 2026-05-18 Listed $159,900 RMLSA as Distributed by MLS Grid
Property tax history
+5.6%/yrLatest (2024): $2,549 · +33.1% YoY. Source: county tax records.
Cash-flow waterfall
monthlySold comps — $/sqft
last 12 mo · ≤1 miLoading sold comps…