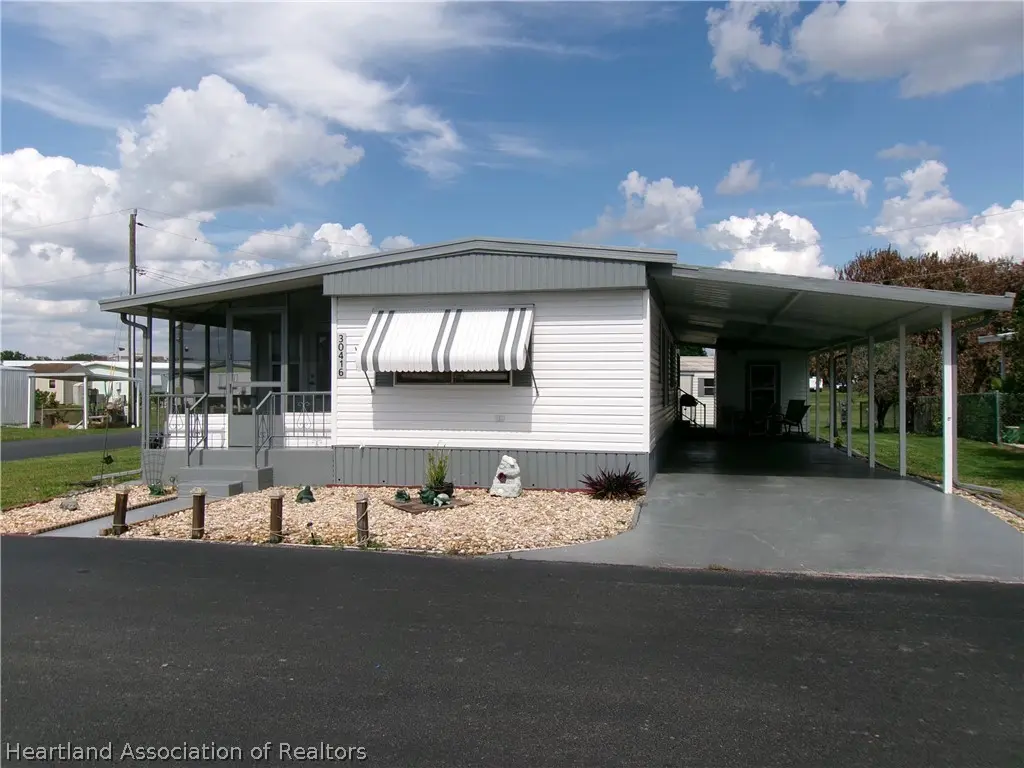
30416 Sunrise Blvd · Sebring, FL
Flood risk 1/10 · Minimal
- FEMA flood zone
- A
- Chance of flooding over 30 yrs
- 0.0%
- Est. flood insurance / yr
- $1,009 – $1,996
Fire risk 3/10 · Minor
- Est. fire insurance / yr
- $947 – $1,759
Heat risk 8/10 · Major
- Hot days now (above 108°F)
- 6 days/yr
- Hot days in 30 yrs
- 21 days/yr
Wind risk 9/10 · Severe
- Chance of severe wind over 30 yrs
- 99.0%
Air-quality risk 2/10 · Minimal
- Unhealthy air days now
- 1 days/yr
- Unhealthy air days in 30 yrs
- 1 days/yr
Risk factors via First Street. Map © Google.
Why this score? — see what drove the C+ grade
The composite is a weighted blend of 9 inputs, each scored 0–100. Each bar is that input's sub-score; the figure is the points it added to the 100-point composite (weight × sub-score).
- Cash flow +30.0/30.0
- 1% rule +10.0/10.0
- DSCR +10.0/10.0
- Schools +3.6/10.0
- Livability +3.3/5.0
- Condition / age +2.5/5.0
- Rent growth +2.4/5.0
- ARV discount +0.7/15.0
- Appreciation +0.0/10.0
$89,400
🖨 Deal sheet 📄 Offer letter ✓ Due diligence
Listing remarks
This is a nice mobile home on a corner lot with on one behind it yet. 2 bedrooms 2 baths. 1 bedroom up front with a bathroom the other bedroom at the back. The living room opens directly to a large family room 9x27. Back part is the dining area front is like a sitting area. A very deep carport with a utility room with a washer and dryer. Extra storage shed in the backyard. This is a plus the lot is actually owned. No 99-year lease or a rental. HOA fee includes the clubhouse, pool and shuffleboard. This park has drug store and restaurant outside the entrance. But US 27 is right there to go to all of the other stores. Current furniture is staying but must be on the contract. Seller says a new
Key facts
- Large family room
- Utility room
- Owned lot
Tags
Property features AI
Finance
- HOA & community: Homeowners association with $80 monthly fee; Senior community; Community clubhouse
Exterior
- Parking: Carport (1 space)
- Utilities: Public water; Public sewer
- Home design: Residential mobile home; Single-story
- Construction: Metal siding; Vinyl siding; Metal/other roof; Hillcrest model mobile home
- Exterior features: Front porch (screened); Community pool (none on-site)
Interior
- Kitchen: Oven; Range; Refrigerator
- Flooring: Vinyl flooring
- Bathrooms: 2 full bathrooms
- Heating & cooling: Central heating (electric); Central air conditioning (electric)
- Interior features: Furnished; 11 total rooms
Neighborhood map
What this means for you Summary
Snapshot
- This is a 3-bed/2.0-bath manufactured listed at $89k.
Deal economics
- At list price, monthly cash flow is $368 ($4k/yr) — positive.
- The deal already cash-flows at list — no discount required.
- Meets the 1% rule at list price ($1k rent vs $89k).
- Recommended offer: $88k (1.5% below list) — sets the bar for market timing.
- Cap rate 12.9% vs local median 4.3% in Sebring — top-decile yield for the area; either an underpriced asset or a hidden risk that comps aren't pricing in. Stress-test before assuming the spread holds.
Location & tenants
- Location reads 66/100 on livability (#618 in FL) — a middle-class / working-renter tenant base. Strengths: cost of living A+, housing A+, health & safety A; Watch: amenities F, commute F, employment F.
- Highlands (other): math 45% / reading 43% proficiency, ranked #54 of 73 in FL (top 74%) — families likely to look elsewhere, expect single-tenant / working-renter base with shorter leases; 68% free/reduced lunch — lower-income household profile, screen leases tightly.
- Zoned schools: Cracker Trail Elementary School (math 60% / reading 58%, grade B-, #722 of 2,144 statewide, top 34%, 692 students, 62% FRL); Sebring Middle School (math 52% / reading 40%, grade D+, #300 of 571 statewide, top 53%, 815 students, 64% FRL); Sebring High School (math 32% / reading 48%, grade F, #296 of 667 statewide, top 45%, 1,809 students, 56% FRL).
- Market conditions: Rents soft (-0.3%/yr); 475 active listings in the ZIP; 1 comparable units currently listed for rent nearby; 980 units permitted in Highlands County in 2024 (80 in 5+ unit buildings).
- This rent runs 36% of the median local income ($50k/yr) — at the standard rent-burdened threshold; future hikes will face affordability resistance.
Forward outlook
- Local home prices are declining (-3.0%/yr); year-one equity from $618 of loan paydown is wiped out by about $3k of value loss. Plan a longer hold.
Negotiation context
- It's been on market 18 days — a 2% lower offer ($88k) is reasonable based on typical stale-listing flexibility.
- Current owner paid $75k; 19% above their basis — modest negotiation headroom, anchor on the comps not their cost.
Risks & watch-outs
- Watch-outs: flood insurance adds $125/mo.
- Climate carrying-cost: in FEMA flood zone A (mandatory federal flood insurance); severe wind risk, 99% chance of damaging wind over 30y; extreme-heat days projected 6→21/yr by 2055 (HVAC capex compounding) — expect insurance premiums to compound above CPI over the hold.
Questions for the listing agent
- What's the actual annual flood-insurance premium (NFIP or private), and is the property in a SFHA with mandatory coverage?
- What does the HOA fee cover, when was the last increase, and are there any pending special assessments or reserve-fund shortfalls?
- Is there a deadline driving the sale (1031 exchange, divorce, estate, relocation)? That informs how much negotiation room exists.
- Schools are D-rated, which usually means shorter tenancies and higher turnover. Who's the typical renter profile here, and what's been the actual vacancy rate?
- What's the average days-on-market for RENTAL listings here right now (not sales)? A rising rental-DOM trend means longer vacancies and softer asking-rent achievability than the comps imply.
- What's the recent tenant-quality profile in this submarket — average credit score on applications, eviction rate, late-payment / NSF rate, and stable-employment percentage? A property-management company in the area should have these aggregated.
- How much new for-sale + rental construction is in the pipeline within 1–3 miles? Heavy new supply typically softens prices + rents 12–24 months out; constrained supply supports both.
Investment metrics
- 1% rule
- 1.65% ✓
- Cap rate
- 12.91%
- Cash-on-cash
- 23.63%
- DSCR
- 2.05
- GRM
- 5.0
CMA / ARV
- ARV (on-the-fly)
- $77,616
- Comps found
- 12
Show comp detail 12 sales within ~0.75 mi
| Address | Dist | Beds/Ba | Sqft | Sold | Price | $/sf | Match |
|---|---|---|---|---|---|---|---|
| 30495 Tiger Tail Rd | 0.26mi | 2/1.5 (-1) | 720 (-8%) | 10mo | $70,000 | $97 | 59 |
| 30523 Francis St | 0.26mi | 2/2.0 (-1) | 672 (-14%) | 3mo | $62,000 | $92 | 56 |
| 8070 Von Maxcy Rd | 0.26mi | 2/2.0 (-1) | 672 (-14%) | 4mo | $60,000 | $89 | 56 |
| 8094 Von Maxcy Rd | 0.21mi | 3/2.0 | 888 (+13%) | 16mo | $87,900 | $99 | 55 |
| 2720 Las Vegas Blvd | 0.42mi | 2/2.0 (-1) | 720 (-8%) | 11mo | $55,000 | $76 | 53 |
| 30408 Francis St | 0.14mi | 2/2.0 (-1) | 672 (-14%) | 16mo | $67,000 | $100 | 51 |
| 2732 Desoto Rd | 0.37mi | 2/2.0 (-1) | 876 (+12%) | 10mo | $77,000 | $88 | 50 |
| 8019 Von Maxcy Rd | 0.36mi | 2/2.0 (-1) | 672 (-14%) | 11mo | $30,000 | $45 | 46 |
| 2942 San Francisco Ln | 0.50mi | 2/1.0 (-1) | 672 (-14%) | 3mo | $77,450 | $115 | 42 |
| 3121 Paradise Path | 0.62mi | 2/1.5 (-1) | 672 (-14%) | 3mo | $77,500 | $115 | 38 |
| 2932 Desoto Rd | 0.47mi | 2/2.0 (-1) | 672 (-14%) | 16mo | $72,000 | $107 | 36 |
| 3050 San Francisco Ln | 0.56mi | 2/2.0 (-1) | 672 (-14%) | 15mo | $79,900 | $119 | 32 |
Match score weights: distance 35% · size 25% · config 20% · recency 20%. Top-matched comps best support the ARV.
Projected returns pro-forma
-3.0% appreciation · 0.0% rent growth · sell at horizon
- IRR
- 5.1%
- Equity multiple
- 1.19×
- Total profit
- $4,743
- Equity at exit
- $13,330
- IRR
- 11.0%
- Equity multiple
- 1.72×
- Total profit
- $18,105
- Equity at exit
- $7,730
Cash invested: $25,032 (down + closing). Projections, not guarantees.
Landlord ↔ Tenant lean methodology
- Overall (STATE)
- 87 Strongly Landlord-Friendly
- State Florida
- 87 Strongly Landlord-Friendly · R+3
- County
- — inherits STATE
- City
- — inherits STATE
ZIP-level market 33870
- Home prices YoY
- -20.0%
- Rents YoY
- -0.3%
- Active inventory
- 475
- Price-to-rent
- 5.0×
Monthly cashflow live
- Estimated rent
- $1,478 medium interval (Pro) →
- Mortgage (P&I)
- −$469
- Tax from tax record
- −$88 /mo · $1,058/yr
- Insurance
- −$37
- Flood insurance flood zone
- −$125 /mo · $1,502/yr
- HOA
- −$80
- Vacancy / Maint / Mgmt
- −$310
- Net cashflow
- $368
Break-even live
UW: 25.0% down · 7.5% · 30yr · 1.5% tax · 5.0% vac · 8.0% maint · 8.0% mgmt
Financing live
Cash to close
- Down payment
- $22,350
- Closing costs
- $2,682
- Reserves months
- —
- Total cash needed
- —
Loan-product check · same deal, 3 products live
Conventional
25% down · 7.5% · 30yr
- Down + closing
- —
- Monthly P&I
- —
- Monthly cashflow
- —
- DSCR
- —
- Eligible?
- —
Personal DTI + credit; lowest rate.
DSCR
20% down · 8.5% · 30yr
- Down + closing
- —
- Monthly P&I
- —
- Monthly cashflow
- —
- DSCR
- —
- Eligible?
- —
No personal income docs; deal must DSCR.
Hard money
10% down · 12.0% · 12mo
- Down + closing
- —
- Monthly P&I
- —
- Monthly cashflow
- —
- DSCR
- —
- Eligible?
- —
Short-term bridge; refi at stabilization.
Rent comps 1 comps
| Address | Beds | Baths | Sqft | Rent | $/sqft | DOM | Units | Dist |
|---|---|---|---|---|---|---|---|---|
| 8761 Watersound Cir Sebring, FL | 2.0–3.0 | 2.0 | 1090 | $1,600 | $1.47 | 21d | 1 | 1.18mi |
HOA detail
- Monthly dues
- $80 · $960/yr
- Likely covers
- pool
Listing history 9 events
-
2026-06-02days on market $89,400 Active 18 DOM
-
2026-06-01days on market $89,400 Active 17 DOM
-
2026-05-31days on market $89,400 Active 16 DOM
-
2026-05-30days on market $89,400 Active 15 DOM
-
2026-05-15$89,400 Active
-
2023-04-27soldstatus $75,000
-
2021-07-21soldstatus $55,000
-
1996-01-16soldstatus $30,000
-
1992-03-01soldstatus $33,000
ⓘ Source: listings_history table (triggers on properties + properties_extension) + one-shot
backfill from property_details.listing_events for pre-trigger history.
Tax reassessment forecast FL · Resets to sale price
- Current annual tax
- $1,058 · $88/mo
- Projected year-2 tax
- $1,058 · $88/mo
- Expected delta
- $0/yr ($0/mo · 0.0%)
ⓘ Screening estimate from a state-policy table — verify with the county assessor before closing.
Climate risk First Street
- Flood 1/10 Low FEMA zone A · 0% chance over 30 yrs
- Wildfire 3/10 Moderate
- Heat 8/10 Severe 6 d/yr ≥108°F today · 21 d/yr by 30 yrs out
- Wind 9/10 Extreme 99% chance of damaging wind over 30 yrs
- Air quality 2/10 Low 1 unhealthy d/yr today · 1 by 30 yrs out
Nearby sold comps map
Loading sold comps map…
Walkable amenities ~0.75 mi
Loading nearby amenities…
Taxation est. · year 1
- Rental income
- $17,731
- − Mortgage interest
- −$5,008
- − Property taxes
- −$1,058
- − Insurance
- −$1,949
- − Repairs & maintenance
- −$1,418
- − Management
- −$1,418
- − HOA
- −$960
- − Depreciation
- −$2,601
- Taxable income
- $3,318
- Est. tax owed @ 24.0%
- −$796
- After-tax cash flow
- $3,618/yr
For passive investors: Depreciation is non-cash, so a rental often shows a tax loss while cash-flowing — sheltering income. Rental losses are passive: they offset passive income freely, and up to $25,000/yr can offset ordinary (W-2) income if you actively participate and your MAGI is under $100k (phasing out to $0 by $150k); unused losses carry forward. On sale, claimed depreciation is recaptured at up to 25%, and gains may owe capital-gains tax (a 1031 exchange can defer both). Figures are a year-1 estimate at your 24.0% rate — not tax advice; consult a CPA.
Schools (NCES district)
- District
- Highlands
- NCES district ID
- 1200840
- Math proficiency
- 45% ▼ -7.00%
- Reading proficiency
- 43% ▼ -3.00%
- Median HH income
- $35,276
- Composite
- 36.42/100
- National rank
- #4672
- State rank
- #54 of 73 in FL
Livability — Sebring
- Score
- 66/100
- State rank
- #618
- US rank
- #11992
Category grades
Schools grade is shown separately in the Schools card above.
Census & demographics
- County
- Highlands County · 98,898 people
- City population
- 50,797
- Metro
- Sebring-Avon Park, FL
- Population (ZIP)
- 25,195
- Household income
- $49,942
- Rent vs Own
- Severe rent burden
- 994.0
Population outlook (Highlands County) Hauer SSP2
- Today (2025)
- 99,674 people
- By 2030
- 99,615 · -0.1%
- By 2040
- 99,342 · -0.3%
- By 2050
- 98,242 · -1.4%
- By 2075
- 93,291 · -6.4%
- By 2100
- 79,894 · -19.8%
Race, ethnicity, and origin ACS 2023
- Neighborhood character
- Diverse neighborhood (Simpson 0.57)
- Race & ethnicity
- White 60% Hispanic / Latino 22% Black 13% Two or more races 10% Asian 1%
- Hispanic origin (detail)
- Mexican 8% Puerto Rican 7% Cuban 5%
- Common ancestry
- Slovak 2% Romanian 1% Lithuanian 1%
- Foreign-born
- 10% · Canada, Jamaica, China
- Languages at home
- 80% English-only · Spanish 16% Other Indo-European 1% French/Haitian/Cajun 1%
Political lean MEDSL · Highlands
- 2024 margin
- Solid R (+40.8) · D 29.3% · R 70.1%
- 2008→2024 swing
- -22.7pp toward R · 2008: -18.1pp · 2024: -40.8pp
- All cycles
- 2024: R+40.8 2020: R+34.4 2016: R+32.0 2012: R+23.0 2008: R+18.1
Not yet ingested
- Civics
- —
Market trends
- HPI YoY
- ▼ -68.68%
- Current HPI
- 273.9861
- Rent YoY
- ▼ -0.29%
- Metro
- Sebring-Avon Park, FL
- State GDP YoY
- ▲ 3.28%
- F500 in state
- 36
Industry mix (Fortune 500 HQ in FL)
| Industry | F500 HQs | Revenue |
|---|---|---|
| Industrial Technology | 2 | $29B |
|
||
| Insurance | 2 | $17B |
|
||
| Retail | 1 | $60B |
|
||
| Technology Distribution | 1 | $58B |
|
||
| Homebuilding | 1 | $35B |
|
||
| Technology Manufacturing | 1 | $35B |
|
||
Price history
+170.9% since first listed5 events — show timeline
- 2026-05-15 Listed $89,400 HAOR as distributed by MLS GRID
- 2023-04-27 Sold (Public Records) $75,000 Public Records
- 2021-07-21 Sold (Public Records) $55,000 Public Records
- 1996-01-16 Sold (Public Records) $30,000 Public Records
- 1992-03-01 Sold (Public Records) $33,000 Public Records
Property tax history
+19.1%/yrLatest (2025): $1,058 · +8.3% YoY. Source: county tax records.
Cash-flow waterfall
monthlySold comps — $/sqft
last 12 mo · ≤1 miLoading sold comps…