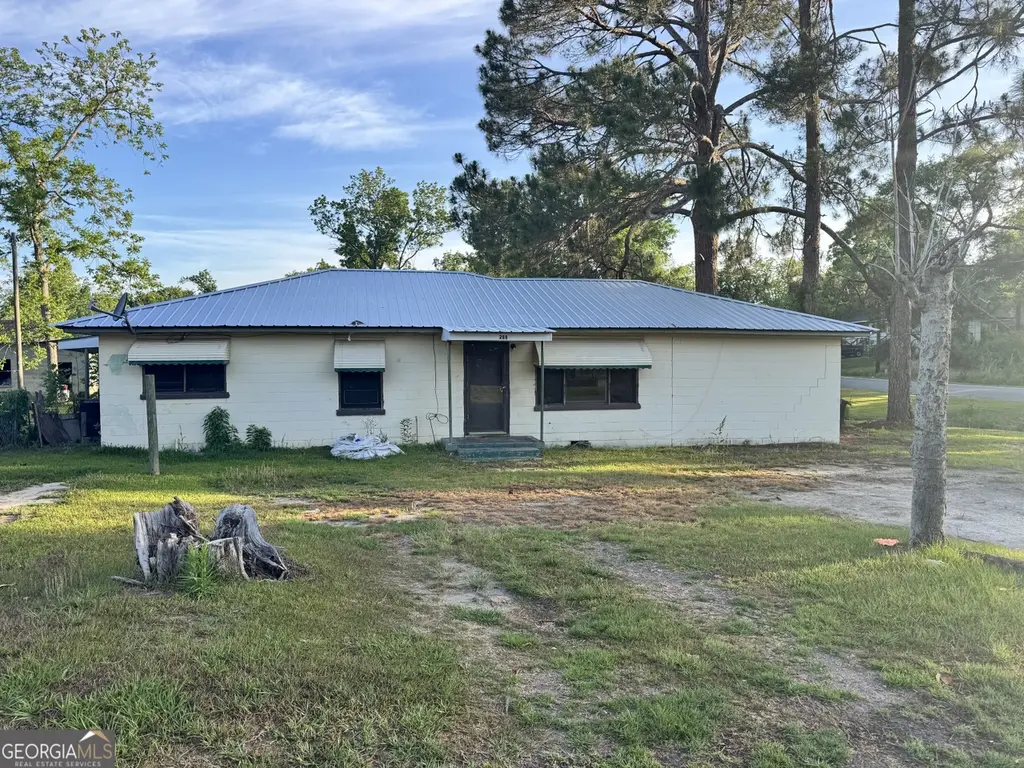
269 E Grady Ave · Lyons, GA
Flood risk 4/10 · Minor
- FEMA flood zone
- X (unshaded)
- Chance of flooding over 30 yrs
- 0.24%
- Est. flood insurance / yr
- $507 – $1,088
Fire risk 4/10 · Minor
- Est. fire insurance / yr
- $963 – $1,789
Heat risk 8/10 · Major
- Hot days now (above 109°F)
- 7 days/yr
- Hot days in 30 yrs
- 18 days/yr
Wind risk 8/10 · Major
- Chance of severe wind over 30 yrs
- 80.0%
Air-quality risk 2/10 · Minimal
- Unhealthy air days now
- 1 days/yr
- Unhealthy air days in 30 yrs
- 1 days/yr
Risk factors via First Street. Map © Google.
Why this score? — see what drove the A- grade
The composite is a weighted blend of 9 inputs, each scored 0–100. Each bar is that input's sub-score; the figure is the points it added to the 100-point composite (weight × sub-score).
- Cash flow +30.0/30.0
- ARV discount +10.7/15.0
- 1% rule +10.0/10.0
- DSCR +10.0/10.0
- Appreciation +10.0/10.0
- Livability +3.1/5.0
- Schools +2.8/10.0
- Rent growth +2.5/5.0
- Condition / age +2.5/5.0
$39,999
🖨 Deal sheet 📄 Offer letter ✓ Due diligence
Listing remarks
Calling all investors, flippers, or DIY dreamers! This property is packed with potential and ready for a new vision!Whether you're looking to renovate and resell, create a rental property, or customize your own home, this fixer upper offers a great opportunity to build equity. Check out this home on a corner lot within the city limits.
Key facts
- 0.25 acre lot
- Built 1956
Property features AI
Finance
- HOA & community: No homeowners association
Exterior
- Parking: Off-street parking
- Utilities: Public water; Public sewer; Electricity available; Cable available
- Home design: Single-family residence (house); Built in 1956; Property described as a fixer
- Construction: Block construction; Metal roof; Total building area listed as 1596 (public records)
- Exterior features: Corner lot
Interior
- Kitchen: No appliances listed
- Bedrooms: Three bedrooms on the main level
- Flooring: Flooring described as 'Other'
- Bathrooms: One full bathroom on the main level
- Heating & cooling: No heating; No cooling
- Interior features: One-level layout; Family room
- Laundry & utility: Laundry described as 'Other'
Neighborhood map
What this means for you Summary
Snapshot
- This is a 3-bed/1.0-bath single-family listed at $40k.
Deal economics
- At list price, monthly cash flow is $1k ($12k/yr) — positive.
- The deal already cash-flows at list — no discount required.
- Meets the 1% rule at list price ($2k rent vs $40k).
Location & tenants
- Location reads 61/100 on livability (#330 in GA) — a middle-class / working-renter tenant base. Strengths: cost of living A+, housing A; Watch: health & safety C-, schools F, amenities F.
- Toombs County (rural): math 36% / reading 31% proficiency, ranked #77 of 174 in GA (top 44%) — families likely to look elsewhere, expect single-tenant / working-renter base with shorter leases; 72% free/reduced lunch — lower-income household profile, screen leases tightly.
- Market conditions: 44 active listings in the ZIP; 33 units permitted in Toombs County in 2024 (0 in 5+ unit buildings).
Forward outlook
- In year one you build about $4k of equity ($276 loan paydown + $4k appreciation (10.0% local appreciation)).
- Toombs County population projected at -11% by 2050 — secular population decline; favor cash flow + early exit over multi-decade hold.
- At projected returns (10.0% appreciation + 3.0% rent growth), your $11k cash investment doubles in ~1 year — after that, you're playing with house money.
- By year 7, paydown + projected appreciation supports a ~$31k cash-out refi (75% LTV) — recoverable capital for the next deal without selling this one.
Negotiation context
- Only 1 days on market — expect competitive offers; lowballing is unlikely to land.
Risks & watch-outs
- Watch-outs: built in 1956 — expect roof / HVAC / electrical / plumbing capex.
- Climate carrying-cost: severe wind risk, 80% chance of damaging wind over 30y; extreme-heat days projected 7→18/yr by 2055 (HVAC capex compounding) — expect insurance premiums to compound above CPI over the hold.
Questions for the listing agent
- Built in 1956 — when were the roof, HVAC, electrical panel, plumbing, and water heater last replaced?
- Is there a deadline driving the sale (1031 exchange, divorce, estate, relocation)? That informs how much negotiation room exists.
- Schools are F-rated, which usually means shorter tenancies and higher turnover. Who's the typical renter profile here, and what's been the actual vacancy rate?
- What's the average days-on-market for RENTAL listings here right now (not sales)? A rising rental-DOM trend means longer vacancies and softer asking-rent achievability than the comps imply.
- What's the recent tenant-quality profile in this submarket — average credit score on applications, eviction rate, late-payment / NSF rate, and stable-employment percentage? A property-management company in the area should have these aggregated.
- How much new for-sale + rental construction is in the pipeline within 1–3 miles? Heavy new supply typically softens prices + rents 12–24 months out; constrained supply supports both.
Investment metrics
- 1% rule
- 4.11% ✓
- Cap rate
- 36.83%
- Cash-on-cash
- 109.08%
- DSCR
- 5.85
- GRM
- 2.0
CMA / ARV
- ARV (on-the-fly)
- $43,092
- Comps found
- 3
Show comp detail 3 sales within ~0.75 mi
| Address | Dist | Beds/Ba | Sqft | Sold | Price | $/sf | Match |
|---|---|---|---|---|---|---|---|
| 269 E Grady Ave | 0.00mi | 3/1.0 | 1,596 (0%) | 1mo | $32,000 | $20 | 100 |
| 148 148 East Gordon | 0.30mi | 4/2.0 (+1) | 1,732 (+8%) | 11mo | $46,000 | $27 | 54 |
| 175 Hilton Dr | 0.66mi | 3/1.5 | 1,378 (-14%) | 18mo | $146,000 | $106 | 29 |
Match score weights: distance 35% · size 25% · config 20% · recency 20%. Top-matched comps best support the ARV.
Projected returns pro-forma
10.0% appreciation · 3.0% rent growth · sell at horizon
- IRR
- —
- Equity multiple
- 8.74×
- Total profit
- $86,652
- Equity at exit
- $36,034
- IRR
- —
- Equity multiple
- 19.24×
- Total profit
- $204,241
- Equity at exit
- $77,709
Cash invested: $11,200 (down + closing). Projections, not guarantees.
Landlord ↔ Tenant lean methodology
- Overall (STATE)
- 90 Strongly Landlord-Friendly
- State Georgia
- 90 Strongly Landlord-Friendly · R+3
- County
- — inherits STATE
- City
- — inherits STATE
ZIP-level market 30436
- Home prices YoY
- 9.5%
- Active inventory
- 44
- Price-to-rent
- 2.0×
Monthly cashflow live
- Estimated rent
- $1,645 medium interval (Pro) →
- Mortgage (P&I)
- −$210
- Tax from tax record
- −$55 /mo · $661/yr
- Insurance
- −$17
- HOA
- −$0
- Vacancy / Maint / Mgmt
- −$345
- Net cashflow
- $1,018
Break-even live
UW: 25.0% down · 7.5% · 30yr · 1.5% tax · 5.0% vac · 8.0% maint · 8.0% mgmt
Financing live
Cash to close
- Down payment
- $10,000
- Closing costs
- $1,200
- Reserves months
- —
- Total cash needed
- —
Loan-product check · same deal, 3 products live
Conventional
25% down · 7.5% · 30yr
- Down + closing
- —
- Monthly P&I
- —
- Monthly cashflow
- —
- DSCR
- —
- Eligible?
- —
Personal DTI + credit; lowest rate.
DSCR
20% down · 8.5% · 30yr
- Down + closing
- —
- Monthly P&I
- —
- Monthly cashflow
- —
- DSCR
- —
- Eligible?
- —
No personal income docs; deal must DSCR.
Hard money
10% down · 12.0% · 12mo
- Down + closing
- —
- Monthly P&I
- —
- Monthly cashflow
- —
- DSCR
- —
- Eligible?
- —
Short-term bridge; refi at stabilization.
Listing history 2 events
-
2026-05-07status Under Contract
-
2026-03-27$39,999 New
ⓘ Source: listings_history table (triggers on properties + properties_extension) + one-shot
backfill from property_details.listing_events for pre-trigger history.
Tax reassessment forecast GA · Resets to sale price
- Current annual tax
- $661 · $55/mo
- Projected year-2 tax
- $661 · $55/mo
- Expected delta
- $0/yr ($0/mo · 0.0%)
ⓘ Screening estimate from a state-policy table — verify with the county assessor before closing.
Climate risk First Street
- Flood 4/10 Moderate FEMA zone X (unshaded) · 24% chance over 30 yrs
- Wildfire 4/10 Moderate
- Heat 8/10 Severe 7 d/yr ≥109°F today · 18 d/yr by 30 yrs out
- Wind 8/10 Severe 80% chance of damaging wind over 30 yrs
- Air quality 2/10 Low 1 unhealthy d/yr today · 1 by 30 yrs out
Nearby sold comps map
Loading sold comps map…
Walkable amenities ~0.75 mi
Loading nearby amenities…
Taxation est. · year 1
- Rental income
- $19,740
- − Mortgage interest
- −$2,241
- − Property taxes
- −$661
- − Insurance
- −$200
- − Repairs & maintenance
- −$1,579
- − Management
- −$1,579
- − Depreciation
- −$1,164
- Taxable income
- $12,316
- Est. tax owed @ 24.0%
- −$2,956
- After-tax cash flow
- $9,261/yr
For passive investors: Depreciation is non-cash, so a rental often shows a tax loss while cash-flowing — sheltering income. Rental losses are passive: they offset passive income freely, and up to $25,000/yr can offset ordinary (W-2) income if you actively participate and your MAGI is under $100k (phasing out to $0 by $150k); unused losses carry forward. On sale, claimed depreciation is recaptured at up to 25%, and gains may owe capital-gains tax (a 1031 exchange can defer both). Figures are a year-1 estimate at your 24.0% rate — not tax advice; consult a CPA.
Schools (NCES district)
- District
- Toombs County
- NCES district ID
- 1305040
- Math proficiency
- 36% ▼ -3.00%
- Reading proficiency
- 31% ▼ -5.00%
- Median HH income
- $34,288
- Composite
- 27.63/100
- National rank
- #6922
- State rank
- #77 of 174 in GA
Livability — Lyons
- Score
- 61/100
- State rank
- #330
- US rank
- #17443
Category grades
Schools grade is shown separately in the Schools card above.
Census & demographics
- Census place
- Lyons, GA
- Population (ZIP)
- 11,547
Population outlook (Toombs County) Hauer SSP2
- Today (2025)
- 26,784 people
- By 2030
- 26,312 · -1.8%
- By 2040
- 25,219 · -5.8%
- By 2050
- 23,733 · -11.4%
- By 2075
- 19,107 · -28.7%
- By 2100
- 12,922 · -51.8%
Race, ethnicity, and origin ACS 2023
- Neighborhood character
- Majority White (63%)
- Race & ethnicity
- White 63% Black 20% Hispanic / Latino 14% Two or more races 5%
- Hispanic origin (detail)
- Mexican 13%
- Common ancestry
- Slovak 1% Serbian 1% Italian 1%
- Foreign-born
- 6% · Canada
- Languages at home
- 89% English-only · Spanish 11%
Political lean MEDSL · Toombs
- 2024 margin
- Solid R (+50.7) · D 24.5% · R 75.2%
- 2008→2024 swing
- -12.6pp toward R · 2008: -38.1pp · 2024: -50.7pp
- All cycles
- 2024: R+50.7 2020: R+45.2 2016: R+46.9 2012: R+40.5 2008: R+38.1
Not yet ingested
- Civics
- —
Market trends
- HPI YoY
- ▲ 22.28%
- Current HPI
- 257.7921
- Rent YoY
- —
- Metro
- —
- State GDP YoY
- ▲ 2.66%
- F500 in state
- 28
Industry mix (Fortune 500 HQ in GA)
| Industry | F500 HQs | Revenue |
|---|---|---|
| Paper / Packaging | 2 | $29B |
|
||
| Retail | 1 | $160B |
|
||
| Transportation / Logistics | 1 | $91B |
|
||
| Airlines | 1 | $62B |
|
||
| Consumer Goods | 1 | $47B |
|
||
| Utilities | 1 | $25B |
|
||
Price history
2 events — show timeline
- 2026-05-07 Pending — GAMLS
- 2026-03-27 Listed $39,999 GAMLS
Property tax history
+6.4%/yrLatest (2025): $661 · +0.1% YoY. Source: county tax records.
Cash-flow waterfall
monthlySold comps — $/sqft
last 12 mo · ≤1 miLoading sold comps…