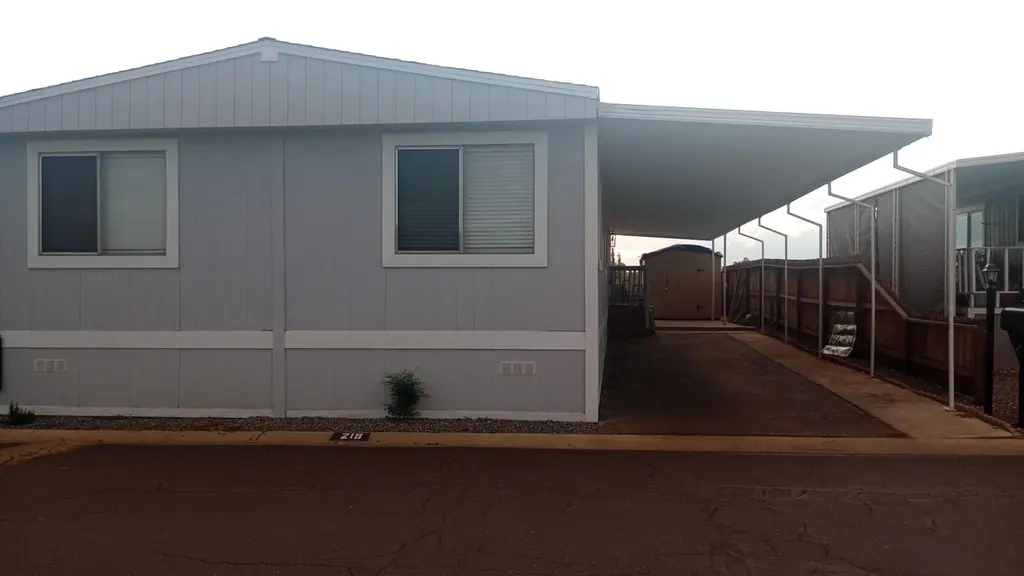
720 E Worth Ave #219 · Porterville, CA
Flood risk 1/10 · Minimal
- FEMA flood zone
- X (unshaded)
- Chance of flooding over 30 yrs
- 0.0%
- Est. flood insurance / yr
- $507 – $1,088
Fire risk 9/10 · Severe
- Est. fire insurance / yr
- $659 – $1,223
Heat risk 8/10 · Major
- Hot days now (above 105°F)
- 7 days/yr
- Hot days in 30 yrs
- 19 days/yr
Wind risk 1/10 · Minimal
- Chance of severe wind over 30 yrs
- —
Air-quality risk 10/10 · Severe
- Unhealthy air days now
- 38 days/yr
- Unhealthy air days in 30 yrs
- 42 days/yr
Risk factors via First Street. Map © Google.
Why this score? — see what drove the C+ grade
The composite is a weighted blend of 9 inputs, each scored 0–100. Each bar is that input's sub-score; the figure is the points it added to the 100-point composite (weight × sub-score).
- Cash flow +30.0/30.0
- 1% rule +10.0/10.0
- DSCR +10.0/10.0
- Rent growth +3.5/5.0
- Livability +3.0/5.0
- Schools +2.8/10.0
- Condition / age +2.5/5.0
- ARV discount +0.0/15.0
- Appreciation +0.0/10.0
$99,000
🖨 Deal sheet 📄 Offer letter ✓ Due diligence
Listing remarks MLS
Step into comfort and style with this beautifully updated double-wide mobile home. Featuring an extended front porch, this home welcomes you with a bright, open layout—spacious living and family rooms, and a stunning modern kitchen perfect for family meals and entertaining. The split floor plan offers a private master suite with a large walk-in closet, luxurious bathroom, soaking tub, and separate shower. Two additional bedrooms and a guest bath sit on the opposite side, ideal for family or guests. Enjoy the convenience of a covered driveway with ample parking. Don't miss this incredible opportunity—schedule your tour today!
Key facts
- Private master suite
- Extended front porch
- Soaking tub
Tags
Neighborhood map
What this means for you Summary
Snapshot
- This is a 3-bed/2.0-bath land listed at $99k.
Deal economics
- At list price, monthly cash flow is $556 ($7k/yr) — positive.
- The deal already cash-flows at list — no discount required.
- Meets the 1% rule at list price ($2k rent vs $99k).
- Recommended offer: $87k (12.0% below list) — sets the bar for market timing.
- Cap rate 13.0% vs local median 2.7% in Porterville — top-decile yield for the area; either an underpriced asset or a hidden risk that comps aren't pricing in. Stress-test before assuming the spread holds.
Location & tenants
- Location reads 60/100 on livability (#561 in CA) — a middle-class / working-renter tenant base. Strengths: housing A, commute A-; Watch: crime C-, cost of living D+, schools F.
- Porterville Unified (urban): math 18% / reading 50% proficiency, ranked #302 of 517 in CA (top 58%) — families likely to look elsewhere, expect single-tenant / working-renter base with shorter leases; 84% free/reduced lunch — lower-income household profile, screen leases tightly.
- Market conditions: Rents rising fast (+4.1%/yr); 320 active listings in the ZIP; 1 comparable units currently listed for rent nearby; 1,447 units permitted in Tulare County in 2024 (307 in 5+ unit buildings).
- This rent runs 32% of the median local income ($60k/yr) — at the standard rent-burdened threshold; future hikes will face affordability resistance.
Forward outlook
- Local home prices are declining (-3.0%/yr); year-one equity from $684 of loan paydown is wiped out by about $3k of value loss. Plan a longer hold.
- Tulare County population projected at +10% by 2050 — modest demand growth; plan on rents tracking national, not racing it.
- At projected returns (-3.0% appreciation + 4.1% rent growth), your $28k cash investment doubles in ~5 years — after that, you're playing with house money.
Negotiation context
- It's been on market 266 days — a 12% lower offer ($87k) is reasonable based on typical stale-listing flexibility.
Risks & watch-outs
- Climate carrying-cost: severe wildfire risk; extreme-heat days projected 7→19/yr by 2055 (HVAC capex compounding) — expect insurance premiums to compound above CPI over the hold.
Questions for the listing agent
- It's been on market 266 days. Have you received any prior offers? Is the seller open to a 12% concession, seller financing, or rate buy-down credit?
- Built in 1978 — when were the roof, HVAC, electrical panel, plumbing, and water heater last replaced?
- Why hasn't it sold? Are there any deal-killer items the seller is aware of (foundation, flood, title, zoning, code violations)?
- Is there a deadline driving the sale (1031 exchange, divorce, estate, relocation)? That informs how much negotiation room exists.
- Schools are F-rated, which usually means shorter tenancies and higher turnover. Who's the typical renter profile here, and what's been the actual vacancy rate?
- What's the average days-on-market for RENTAL listings here right now (not sales)? A rising rental-DOM trend means longer vacancies and softer asking-rent achievability than the comps imply.
- What's the recent tenant-quality profile in this submarket — average credit score on applications, eviction rate, late-payment / NSF rate, and stable-employment percentage? A property-management company in the area should have these aggregated.
- How much new for-sale + rental construction is in the pipeline within 1–3 miles? Heavy new supply typically softens prices + rents 12–24 months out; constrained supply supports both.
Investment metrics
- 1% rule
- 1.59% ✓
- Cap rate
- 13.04%
- Cash-on-cash
- 24.08%
- DSCR
- 2.07
- GRM
- 5.3
CMA / ARV
- ARV (median comp)
- $66,009
- List price
- $99,000
- Delta
- 49.98%
- Verdict
- OVERPRICED
- Comps
- 5 within 1.0 mi
Projected returns pro-forma
-3.0% appreciation · 4.07% rent growth · sell at horizon
- IRR
- 18.5%
- Equity multiple
- 1.76×
- Total profit
- $21,120
- Equity at exit
- $14,761
- IRR
- 27.7%
- Equity multiple
- 3.57×
- Total profit
- $71,275
- Equity at exit
- $8,560
Cash invested: $27,720 (down + closing). Projections, not guarantees.
Landlord ↔ Tenant lean methodology
- Overall (STATE)
- 18 Strongly Tenant-Friendly
- State California
- 18 Strongly Tenant-Friendly · D+13
- County
- — inherits STATE
- City
- — inherits STATE
ZIP-level market 93257
- Rents YoY
- 4.1%
- Active inventory
- 320
- Price-to-rent
- 5.3×
Monthly cashflow live
- Estimated rent
- $1,570 medium interval (Pro) →
- Mortgage (P&I)
- −$519
- Tax est. 1.5%
- −$124 /mo · $1,485/yr
- Insurance
- −$41
- HOA
- −$0
- Vacancy / Maint / Mgmt
- −$330
- Net cashflow
- $556
Break-even live
UW: 25.0% down · 7.5% · 30yr · 1.5% tax · 5.0% vac · 8.0% maint · 8.0% mgmt
Financing live
Cash to close
- Down payment
- $24,750
- Closing costs
- $2,970
- Reserves months
- —
- Total cash needed
- —
Loan-product check · same deal, 3 products live
Conventional
25% down · 7.5% · 30yr
- Down + closing
- —
- Monthly P&I
- —
- Monthly cashflow
- —
- DSCR
- —
- Eligible?
- —
Personal DTI + credit; lowest rate.
DSCR
20% down · 8.5% · 30yr
- Down + closing
- —
- Monthly P&I
- —
- Monthly cashflow
- —
- DSCR
- —
- Eligible?
- —
No personal income docs; deal must DSCR.
Hard money
10% down · 12.0% · 12mo
- Down + closing
- —
- Monthly P&I
- —
- Monthly cashflow
- —
- DSCR
- —
- Eligible?
- —
Short-term bridge; refi at stabilization.
Rent comps 1 comps
| Address | Beds | Baths | Sqft | Rent | $/sqft | DOM | Units | Dist |
|---|---|---|---|---|---|---|---|---|
| 195 E Mountain View Ave Porterville, CA | 2.0 | 1.0 | 1075 | $1,200 | $1.12 | 21d | 1 | 0.86mi |
Listing history 17 events
-
2026-06-18days on market $99,000 Active 266 DOM
-
2026-06-17days on market $99,000 Active 265 DOM
-
2026-06-16days on market $99,000 Active 264 DOM
-
2026-06-15days on market $99,000 Active 263 DOM
-
2026-06-14days on market $99,000 Active 261 DOM
-
2026-06-13days on market $99,000 Active 260 DOM
-
2026-06-10days on market $99,000 Active 258 DOM
-
2026-06-09days on market $99,000 Active 257 DOM
-
2026-06-08days on market $99,000 Active 256 DOM
-
2026-06-07days on market $99,000 Active 255 DOM
-
2026-06-05days on market $99,000 Active 252 DOM
-
2026-06-03days on market $99,000 Active 251 DOM
-
2026-06-02days on market $99,000 Active 250 DOM
-
2026-06-01days on market $99,000 Active 249 DOM
-
2026-05-31days on market $99,000 Active 248 DOM
-
2026-05-30days on market $99,000 Active 247 DOM
-
2025-09-26$99,000 Active 644-char remark
Show marketing remark (644 chars)
Step into comfort and style with this beautifully updated double-wide mobile home. Featuring an extended front porch, this home welcomes you with a bright, open layout—spacious living and family rooms, and a stunning modern kitchen perfect for family meals and entertaining. The split floor plan offers a private master suite with a large walk-in closet, luxurious bathroom, soaking tub, and separate shower. Two additional bedrooms and a guest bath sit on the opposite side, ideal for family or guests. Enjoy the convenience of a covered driveway with ample parking. Don't miss this incredible opportunity—schedule your tour today!
ⓘ Source: listings_history table (triggers on properties + properties_extension) + one-shot
backfill from property_details.listing_events for pre-trigger history.
Climate risk First Street
- Flood 1/10 Low FEMA zone X (unshaded) · 0% chance over 30 yrs
- Wildfire 9/10 Extreme
- Heat 8/10 Severe 7 d/yr ≥105°F today · 19 d/yr by 30 yrs out
- Wind 1/10 Low
- Air quality 10/10 Extreme 38 unhealthy d/yr today · 42 by 30 yrs out
Nearby sold comps map
Loading sold comps map…
Walkable amenities ~0.75 mi
Loading nearby amenities…
Taxation est. · year 1
- Rental income
- $18,842
- − Mortgage interest
- −$5,546
- − Property taxes
- −$1,485
- − Insurance
- −$495
- − Repairs & maintenance
- −$1,507
- − Management
- −$1,507
- − Depreciation
- −$2,880
- Taxable income
- $5,422
- Est. tax owed @ 24.0%
- −$1,301
- After-tax cash flow
- $5,374/yr
For passive investors: Depreciation is non-cash, so a rental often shows a tax loss while cash-flowing — sheltering income. Rental losses are passive: they offset passive income freely, and up to $25,000/yr can offset ordinary (W-2) income if you actively participate and your MAGI is under $100k (phasing out to $0 by $150k); unused losses carry forward. On sale, claimed depreciation is recaptured at up to 25%, and gains may owe capital-gains tax (a 1031 exchange can defer both). Figures are a year-1 estimate at your 24.0% rate — not tax advice; consult a CPA.
Schools (NCES district)
- District
- Porterville Unified
- NCES district ID
- 0600064
- Math proficiency
- 18% ▼ -10.00%
- Reading proficiency
- 50% ▲ 6.00%
- Median HH income
- $35,157
- Composite
- 27.97/100
- National rank
- #6855
- State rank
- #302 of 517 in CA
Livability — Porterville
- Score
- 60/100
- State rank
- #561
- US rank
- #18537
Category grades
Schools grade is shown separately in the Schools card above.
Census & demographics
- County
- Tulare County · 323,826 people
- City population
- 80,467
- Metro
- Visalia, CA
- Population (ZIP)
- 80,467
- Household income
- $59,704
- Rent vs Own
- Severe rent burden
- 3028.0
Population outlook (Tulare County) Hauer SSP2
- Today (2025)
- 484,681 people
- By 2030
- 496,241 · +2.4%
- By 2040
- 518,507 · +7.0%
- By 2050
- 534,920 · +10.4%
- By 2075
- 548,417 · +13.2%
- By 2100
- 513,085 · +5.9%
Race, ethnicity, and origin ACS 2023
- Neighborhood character
- Predominantly Hispanic (72%)
- Race & ethnicity
- Hispanic / Latino 72% Two or more races 23% White 21% Native American 3% Asian 2%
- Hispanic origin (detail)
- Mexican 69%
- Common ancestry
- Iranian 1%
- Foreign-born
- 26% · Canada
- Languages at home
- 45% English-only · Spanish 52% Tagalog/Filipino 1% Arabic 1%
Political lean MEDSL · Tulare
- 2024 margin
- Strong R (+20.7) · D 38.5% · R 59.2% · Other 2.3%
- 2008→2024 swing
- -5.4pp toward R · 2008: -15.3pp · 2024: -20.7pp
- All cycles
- 2024: R+20.7 2020: R+7.8 2016: R+12.1 2012: R+17.8 2008: R+15.3
Not yet ingested
- Civics
- —
Market trends
- HPI YoY
- ▼ -375.52%
- Current HPI
- 362.656
- Rent YoY
- ▲ 4.07%
- Metro
- Visalia, CA
- State GDP YoY
- ▲ 3.21%
- F500 in state
- 116
Industry mix (Fortune 500 HQ in CA)
| Industry | F500 HQs | Revenue |
|---|---|---|
| Technology | 27 | $1,492B |
|
||
| Financial Services | 3 | $174B |
|
||
| Retail | 3 | $44B |
|
||
| Insurance | 3 | $26B |
|
||
| Media / Entertainment | 2 | $115B |
|
||
| Pharmaceuticals / Biotech | 2 | $62B |
|
||
Price history
1 event — show timeline
- 2025-09-26 Listed $99,000 TCMLS
Property tax history
-1.6%/yrLatest (2021): $120 · -1.6% YoY. Source: county tax records.
Cash-flow waterfall
monthlySold comps — $/sqft
last 12 mo · ≤1 miLoading sold comps…