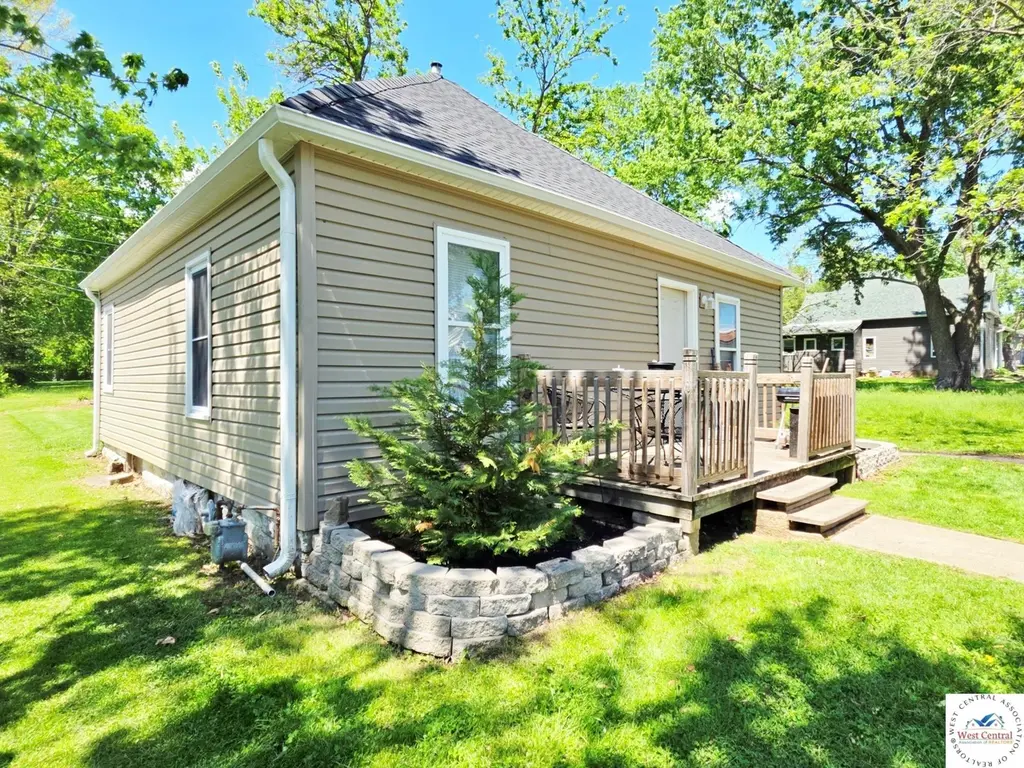
1612 S Montgomery Ave · Sedalia, MO
Flood risk 1/10 · Minimal
- FEMA flood zone
- X (unshaded)
- Chance of flooding over 30 yrs
- 0.0%
- Est. flood insurance / yr
- $473 – $860
Fire risk 3/10 · Minor
- Est. fire insurance / yr
- $1,054 – $1,958
Heat risk 4/10 · Minor
- Hot days now (above 106°F)
- 7 days/yr
- Hot days in 30 yrs
- 18 days/yr
Wind risk 2/10 · Minimal
- Chance of severe wind over 30 yrs
- —
Air-quality risk 2/10 · Minimal
- Unhealthy air days now
- 0 days/yr
- Unhealthy air days in 30 yrs
- 1 days/yr
Risk factors via First Street. Map © Google.
Why this score? — see what drove the B grade
The composite is a weighted blend of 9 inputs, each scored 0–100. Each bar is that input's sub-score; the figure is the points it added to the 100-point composite (weight × sub-score).
- Cash flow +27.6/30.0
- ARV discount +15.0/15.0
- DSCR +9.7/10.0
- 1% rule +6.3/10.0
- Schools +3.9/10.0
- Livability +3.6/5.0
- Rent growth +2.5/5.0
- Condition / age +2.5/5.0
- Appreciation +0.0/10.0
$97,900
🖨 Deal sheet 📄 Offer letter ✓ Due diligence
Listing remarks
Priced below appraisal! Cute, cozy, and full of potential! This charming 2 bed, 1 bath home is the perfect opportunity for investors or anyone looking to add to their portfolio. With its inviting layout and manageable size, it offers great rental potential or an easy-to-maintain starter property. Whether you’re looking for your next flip, rental, or affordable home, this one checks the boxes. Don’t miss your chance to turn this cozy space into something special!
Key facts
- 4,680 sq ft lot
- Built 1915
- Listed 22 days
Property features AI
Exterior
- Parking: No garage
- Utilities: Public water; Public sewer; Natural gas available
- Home design: Single family residence; Residential property
- Construction: Vinyl siding
- Exterior features: Front porch; Composition roof
Interior
- Kitchen: Gas oven; Gas range; Refrigerator
- Flooring: Carpet; Tile
- Bathrooms: 1 full bathroom
- Heating & cooling: Natural gas heating; Central electric air conditioning
- Interior features: Gas oven and gas range; Refrigerator; Electric water heater; Crawl space basement
- Laundry & utility: Washer; Dryer
Neighborhood map
What this means for you Summary
Snapshot
- This is a 2-bed/1.0-bath single-family listed at $98k.
Deal economics
- At list price, monthly cash flow is $291 ($3k/yr) — positive.
- The deal already cash-flows at list — no discount required.
- Meets the 1% rule at list price ($1k rent vs $98k).
- Recommended offer: $96k (1.5% below list) — sets the bar for market timing.
- Cap rate 9.9% vs local median 4.3% in Sedalia — top-decile yield for the area; either an underpriced asset or a hidden risk that comps aren't pricing in. Stress-test before assuming the spread holds.
Location & tenants
- Location reads 71/100 on livability (#107 in MO) — a middle-class / working-renter tenant base. Strengths: cost of living A+, housing A+, health & safety A+; Watch: amenities D, crime F, commute F.
- Sedalia 200 (town): math 47% / reading 46% proficiency, ranked #89 of 324 in MO (top 28%) — families likely to look elsewhere, expect single-tenant / working-renter base with shorter leases.
- Market conditions: 213 active listings in the ZIP; 1 comparable units currently listed for rent nearby; 109 units permitted in Pettis County in 2024 (46 in 5+ unit buildings).
Forward outlook
- Local home prices are declining (-3.0%/yr); year-one equity from $677 of loan paydown is wiped out by about $3k of value loss. Plan a longer hold.
- Pettis County population projected to shrink 7% by 2050 — rents likely to lag national; underwrite the cash flow, not the appreciation.
- At projected returns (-3.0% appreciation + 3.0% rent growth), your $27k cash investment doubles in ~9 years — after that, you're playing with house money.
Negotiation context
- It's been on market 22 days — a 2% lower offer ($96k) is reasonable based on typical stale-listing flexibility.
- 3 sale attempts since 4y ago; this cycle's ask has dropped $32k (25%) from the opening price — seller is motivated, your offer sets the floor, not the list.
Risks & watch-outs
- Watch-outs: built in 1915 — expect roof / HVAC / electrical / plumbing capex.
Questions for the listing agent
- Built in 1915 — when were the roof, HVAC, electrical panel, plumbing, and water heater last replaced?
- Is there a deadline driving the sale (1031 exchange, divorce, estate, relocation)? That informs how much negotiation room exists.
- Crime grade is F in this area — have there been break-ins, vandalism, or insurance claims at this property in the last 3 years? What carrier currently insures it and at what premium?
- What's the average days-on-market for RENTAL listings here right now (not sales)? A rising rental-DOM trend means longer vacancies and softer asking-rent achievability than the comps imply.
- What's the recent tenant-quality profile in this submarket — average credit score on applications, eviction rate, late-payment / NSF rate, and stable-employment percentage? A property-management company in the area should have these aggregated.
- How much new for-sale + rental construction is in the pipeline within 1–3 miles? Heavy new supply typically softens prices + rents 12–24 months out; constrained supply supports both.
Investment metrics
- 1% rule
- 1.13% ✓
- Cap rate
- 9.86%
- Cash-on-cash
- 12.75%
- DSCR
- 1.57
- GRM
- 7.4
CMA / ARV
- ARV (median comp)
- $120,426
- List price
- $97,900
- Delta
- -18.71%
- Verdict
- UNDERPRICED
- Comps
- 20 within 1.0 mi
Show comp detail 11 sales within ~0.75 mi
| Address | Dist | Beds/Ba | Sqft | Sold | Price | $/sf | Match |
|---|---|---|---|---|---|---|---|
| 640 E 11th St | 0.37mi | 2/1.0 | 936 (+1%) | 9mo | $79,000 | $84 | 73 |
| 1317 S Ohio Ave | 0.63mi | 2/1.0 | 960 (+4%) | 4mo | $130,000 | $135 | 61 |
| 648 E 11th St | 0.36mi | 3/1.0 (+1) | 962 (+4%) | 12mo | $115,000 | $120 | 61 |
| 901 E 14th St | 0.17mi | 2/1.0 | 1,028 (+11%) | 22mo | $85,000 | $83 | 55 |
| 1308 E 10th St | 0.47mi | 2/1.0 | 840 (-9%) | 12mo | $55,000 | $65 | 53 |
| 1000 E 9th St | 0.43mi | 3/1.0 (+1) | 960 (+4%) | 20mo | $115,000 | $120 | 52 |
| 909 E 11th St | 0.34mi | 1/1.0 (-1) | 836 (-10%) | 14mo | $116,000 | $139 | 52 |
| 726 E 4th St | 0.74mi | 2/1.0 | 994 (+8%) | 4mo | $120,000 | $121 | 49 |
| 1611 W Broadway Ave | 0.72mi | 2/1.0 | 996 (+8%) | 17mo | $109,000 | $109 | 39 |
| 608 S New York Ave | 0.74mi | 2/1.5 | 1,005 (+9%) | 20mo | $75,000 | $75 | 32 |
| 110 E 11th St | 0.66mi | 2/2.0 | 816 (-12%) | 19mo | $85,000 | $104 | 30 |
Match score weights: distance 35% · size 25% · config 20% · recency 20%. Top-matched comps best support the ARV.
Projected returns pro-forma
-3.0% appreciation · 3.0% rent growth · sell at horizon
- IRR
- 2.5%
- Equity multiple
- 1.10×
- Total profit
- $2,643
- Equity at exit
- $14,597
- IRR
- 12.1%
- Equity multiple
- 1.95×
- Total profit
- $26,024
- Equity at exit
- $8,465
Cash invested: $27,412 (down + closing). Projections, not guarantees.
Landlord ↔ Tenant lean methodology
- Overall (STATE)
- 81 Strongly Landlord-Friendly
- State Missouri
- 81 Strongly Landlord-Friendly · R+10
- County
- — inherits STATE
- City
- — inherits STATE
ZIP-level market 65301
- Home prices YoY
- -21.8%
- Active inventory
- 213
- Price-to-rent
- 7.4×
Monthly cashflow live
- Estimated rent
- $1,109 medium interval (Pro) →
- Mortgage (P&I)
- −$513
- Tax from tax record
- −$31 /mo · $372/yr
- Insurance
- −$41
- HOA
- −$0
- Vacancy / Maint / Mgmt
- −$233
- Net cashflow
- $291
Break-even live
UW: 25.0% down · 7.5% · 30yr · 1.5% tax · 5.0% vac · 8.0% maint · 8.0% mgmt
Financing live
Cash to close
- Down payment
- $24,475
- Closing costs
- $2,937
- Reserves months
- —
- Total cash needed
- —
Loan-product check · same deal, 3 products live
Conventional
25% down · 7.5% · 30yr
- Down + closing
- —
- Monthly P&I
- —
- Monthly cashflow
- —
- DSCR
- —
- Eligible?
- —
Personal DTI + credit; lowest rate.
DSCR
20% down · 8.5% · 30yr
- Down + closing
- —
- Monthly P&I
- —
- Monthly cashflow
- —
- DSCR
- —
- Eligible?
- —
No personal income docs; deal must DSCR.
Hard money
10% down · 12.0% · 12mo
- Down + closing
- —
- Monthly P&I
- —
- Monthly cashflow
- —
- DSCR
- —
- Eligible?
- —
Short-term bridge; refi at stabilization.
Rent comps 1 comps
| Address | Beds | Baths | Sqft | Rent | $/sqft | DOM | Units | Dist |
|---|---|---|---|---|---|---|---|---|
| 1108 E 10th St Sedalia, MO | 2.0 | 1.0 | 864 | $1,750 | $2.03 | 43d | 1 | 0.42mi |
Listing history 12 events
-
2026-05-13price $97,900 478-char remark
-
2026-05-12price $119,500 478-char remark
-
2026-04-28$129,900 Active 478-char remark
-
2023-07-28soldstatus
-
2022-12-06$65,000 Active
-
2022-11-17price $65,000
-
2022-10-15price $69,900
-
2022-09-26$75,000 Active
-
2019-09-27soldstatus
-
2005-09-15soldstatus
-
1995-08-18soldstatus
-
1995-05-30soldstatus
ⓘ Source: listings_history table (triggers on properties + properties_extension) + one-shot
backfill from property_details.listing_events for pre-trigger history.
Tax reassessment forecast MO · Resets to sale price
- Current annual tax
- $372 · $31/mo
- Projected year-2 tax
- $950 · $79/mo
- Expected delta
- +$578/yr (+$48/mo · 155.3%)
ⓘ Screening estimate from a state-policy table — verify with the county assessor before closing.
Climate risk First Street
- Flood 1/10 Low FEMA zone X (unshaded) · 0% chance over 30 yrs
- Wildfire 3/10 Moderate
- Heat 4/10 Moderate 7 d/yr ≥106°F today · 18 d/yr by 30 yrs out
- Wind 2/10 Low
- Air quality 2/10 Low 0 unhealthy d/yr today · 1 by 30 yrs out
Nearby sold comps map
Loading sold comps map…
Walkable amenities ~0.75 mi
Loading nearby amenities…
Taxation est. · year 1
- Rental income
- $13,312
- − Mortgage interest
- −$5,484
- − Property taxes
- −$372
- − Insurance
- −$490
- − Repairs & maintenance
- −$1,065
- − Management
- −$1,065
- − Depreciation
- −$2,848
- Taxable income
- $1,989
- Est. tax owed @ 24.0%
- −$477
- After-tax cash flow
- $3,017/yr
For passive investors: Depreciation is non-cash, so a rental often shows a tax loss while cash-flowing — sheltering income. Rental losses are passive: they offset passive income freely, and up to $25,000/yr can offset ordinary (W-2) income if you actively participate and your MAGI is under $100k (phasing out to $0 by $150k); unused losses carry forward. On sale, claimed depreciation is recaptured at up to 25%, and gains may owe capital-gains tax (a 1031 exchange can defer both). Figures are a year-1 estimate at your 24.0% rate — not tax advice; consult a CPA.
Schools (NCES district)
- District
- Sedalia 200
- NCES district ID
- 2927830
- Math proficiency
- 47% ▼ -1.00%
- Reading proficiency
- 46% ▼ -3.00%
- Median HH income
- $37,452
- Composite
- 38.7/100
- National rank
- #4141
- State rank
- #89 of 324 in MO
Livability — Sedalia
- Score
- 71/100
- State rank
- #107
- US rank
- #6990
Category grades
Schools grade is shown separately in the Schools card above.
Census & demographics
- Census place
- Sedalia, MO
- County
- Pettis County · 35,091 people
- City population
- 35,091
- Metro
- Sedalia, MO
- Population (ZIP)
- 35,091
- Household income
- $58,064
- Rent vs Own
- Severe rent burden
- 1021.0
Population outlook (Pettis County) Hauer SSP2
- Today (2025)
- 41,992 people
- By 2030
- 41,584 · -1.0%
- By 2040
- 40,483 · -3.6%
- By 2050
- 39,049 · -7.0%
- By 2075
- 35,413 · -15.7%
- By 2100
- 30,870 · -26.5%
Race, ethnicity, and origin ACS 2023
- Neighborhood character
- Predominantly White (81%)
- Race & ethnicity
- White 81% Hispanic / Latino 10% Two or more races 7% Black 3%
- Hispanic origin (detail)
- Mexican 8%
- Common ancestry
- Subsaharan African 3% Lithuanian 2% Italian 1%
- Foreign-born
- 7% · Canada
- Languages at home
- 87% English-only · Spanish 7% Russian/Polish/Slavic 4% German/W. Germanic 1%
Political lean MEDSL · Pettis
- 2024 margin
- Solid R (+48.8) · D 24.9% · R 73.7% · Other 1.4%
- 2008→2024 swing
- -26.3pp toward R · 2008: -22.4pp · 2024: -48.8pp
- All cycles
- 2024: R+48.8 2020: R+47.5 2016: R+46.9 2012: R+28.8 2008: R+22.4
Not yet ingested
- Civics
- —
Market trends
- HPI YoY
- ▼ -81.80%
- Current HPI
- 292.8224
- Rent YoY
- —
- Metro
- Sedalia, MO
- State GDP YoY
- ▲ 1.84%
- F500 in state
- 20
Industry mix (Fortune 500 HQ in MO)
| Industry | F500 HQs | Revenue |
|---|---|---|
| Healthcare | 1 | $163B |
|
||
| Insurance | 1 | $21B |
|
||
| Industrial Technology | 1 | $17B |
|
||
| Retail | 1 | $16B |
|
||
| Industrial Distribution | 1 | $10B |
|
||
| Utilities | 1 | $9B |
|
||
Price history
+30.5% since first listed13 events — show timeline
- 2026-05-20 Pending — WCAR
- 2026-05-13 Price Changed $97,900 WCAR
- 2026-05-12 Price Changed $119,500 WCAR
- 2026-04-28 Listed $129,900 WCAR
- 2023-07-28 Sold (Public Records) — Public Records
- 2022-12-06 Listed $65,000 WCAR
- 2022-11-17 Price Changed $65,000 WCAR
- 2022-10-15 Price Changed $69,900 WCAR
- 2022-09-26 Listed $75,000 WCAR
- 2019-09-27 Sold (Public Records) — Public Records
- 2005-09-15 Sold (Public Records) — Public Records
- 1995-08-18 Sold (Public Records) — Public Records
- 1995-05-30 Sold (Public Records) — Public Records
Property tax history
+0.0%/yrLatest (2025): $372 · +0.7% YoY. Source: county tax records.
Cash-flow waterfall
monthlySold comps — $/sqft
last 12 mo · ≤1 miLoading sold comps…