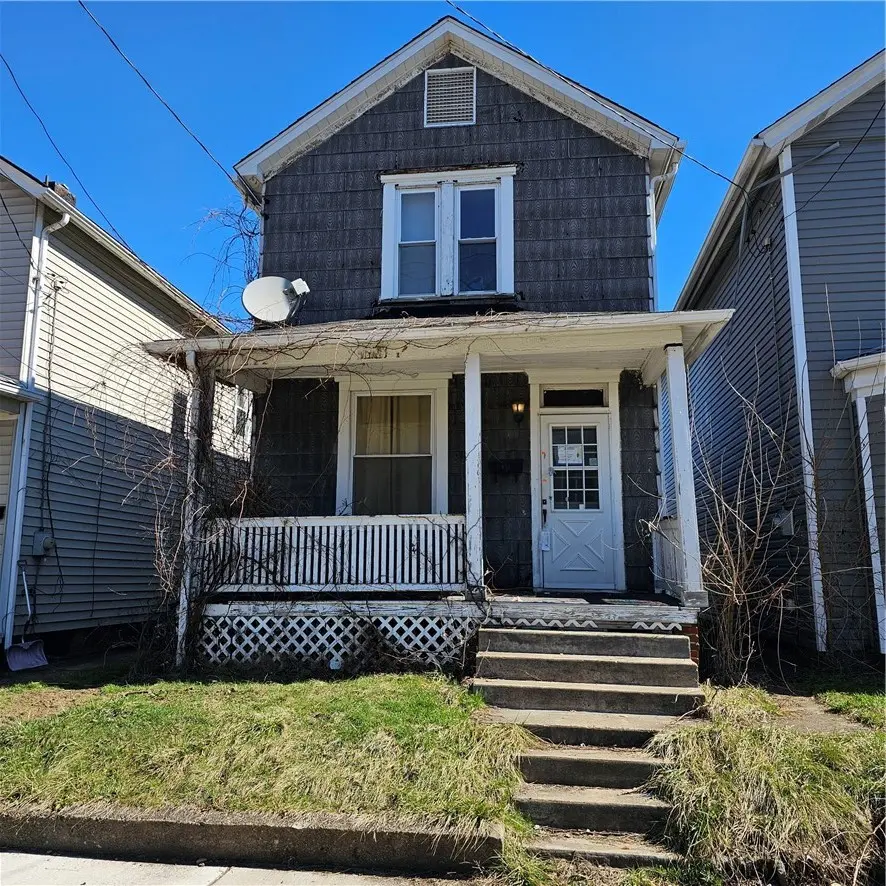
416 Beaver Ave · Aliquippa, PA
Flood risk 6/10 · Moderate
- FEMA flood zone
- X (unshaded)
- Chance of flooding over 30 yrs
- 0.27%
- Est. flood insurance / yr
- $473 – $860
Fire risk 1/10 · Minimal
- Est. fire insurance / yr
- $511 – $949
Heat risk 4/10 · Minor
- Hot days now (above 98°F)
- 8 days/yr
- Hot days in 30 yrs
- 19 days/yr
Wind risk 2/10 · Minimal
- Chance of severe wind over 30 yrs
- —
Air-quality risk 3/10 · Minor
- Unhealthy air days now
- 2 days/yr
- Unhealthy air days in 30 yrs
- 3 days/yr
Risk factors via First Street. Map © Google.
Why this score? — see what drove the B- grade
The composite is a weighted blend of 9 inputs, each scored 0–100. Each bar is that input's sub-score; the figure is the points it added to the 100-point composite (weight × sub-score).
- Cash flow +30.0/30.0
- 1% rule +10.0/10.0
- DSCR +10.0/10.0
- ARV discount +7.5/15.0
- Livability +4.0/5.0
- Rent growth +3.0/5.0
- Condition / age +2.5/5.0
- Schools +0.9/10.0
- Appreciation +0.0/10.0
$29,000
🖨 Deal sheet 📄 Offer letter ✓ Due diligence
Listing remarks
Investment or rental potential with this estate property. Off street parking from the alley.
Key facts
- Off street parking
- 2,613 sq ft lot
- 2 parking spots
Tags
Property features AI
Exterior
- Parking: Off-street parking for 2 vehicles
- Utilities: Public water; Public sewer
- Home design: Two-story residence; Resale property
- Exterior features: 25 x 110 lot dimensions
Interior
- Kitchen: Main-level kitchen
- Bedrooms: Two bedrooms located on the upper level
- Bathrooms: One full bathroom
- Interior features: Full basement with interior entry; Total of 4 rooms
Neighborhood map
What this means for you Summary
Snapshot
- This is a 2-bed/1.0-bath single-family listed at $29k.
Deal economics
- At list price, monthly cash flow is $608 ($7k/yr) — positive.
- The deal already cash-flows at list — no discount required.
- Meets the 1% rule at list price ($1k rent vs $29k).
- Recommended offer: $28k (3.0% below list) — sets the bar for market timing.
- Cap rate 31.4% vs local median 6.0% in Aliquippa — top-decile yield for the area; either an underpriced asset or a hidden risk that comps aren't pricing in. Stress-test before assuming the spread holds.
Location & tenants
- Location reads 80/100 on livability (#216 in PA, #1,891 nationally) — a professional / high-income tenant draw. Strengths: commute A+, cost of living A+, housing A+; Watch: amenities F, employment F.
- Aliquippa SD (suburban): math 4% / reading 19% proficiency, ranked #530 of 539 in PA (top 98%) — low school quality limits family demand, transient renter base, plan for 1-2y turnover; 81% free/reduced lunch — lower-income household profile, screen leases tightly.
- Market conditions: Rents rising (+2.0%/yr); 130 active listings in the ZIP; 3 comparable units currently listed for rent nearby; rentals leasing fast (median 2d on market — plan ~1-2 weeks tenant-placement turnaround); 272 units permitted in Beaver County in 2024 (80 in 5+ unit buildings).
- This rent is only 18% of the median local income ($71k/yr) — well below the 30% rent-burden line; pricing power to push rent on renewal without tenant pushback.
Forward outlook
- Local home prices are declining (-3.0%/yr); year-one equity from $200 of loan paydown is wiped out by about $870 of value loss. Plan a longer hold.
- Beaver County population projected at -14% by 2050 — secular population decline; favor cash flow + early exit over multi-decade hold.
- At projected returns (-3.0% appreciation + 2.0% rent growth), your $8k cash investment doubles in ~2 years — after that, you're playing with house money.
Negotiation context
- It's been on market 34 days — a 3% lower offer ($28k) is reasonable based on typical stale-listing flexibility.
- Current owner paid $12k; list at $29k implies a 142% gain — meaningful room to come down on a strong offer.
Risks & watch-outs
- Watch-outs: property tax is 2.7% of price; built in 1910 — expect roof / HVAC / electrical / plumbing capex.
- Climate carrying-cost: major flood risk — expect insurance premiums to compound above CPI over the hold.
Questions for the listing agent
- It's been on market 34 days. Have you received any prior offers? Is the seller open to a 3% concession, seller financing, or rate buy-down credit?
- Built in 1910 — when were the roof, HVAC, electrical panel, plumbing, and water heater last replaced?
- Property tax is high relative to price — has the assessment been appealed recently, and will the sale trigger a re-assessment?
- Is there a deadline driving the sale (1031 exchange, divorce, estate, relocation)? That informs how much negotiation room exists.
- What's the average days-on-market for RENTAL listings here right now (not sales)? A rising rental-DOM trend means longer vacancies and softer asking-rent achievability than the comps imply.
- What's the recent tenant-quality profile in this submarket — average credit score on applications, eviction rate, late-payment / NSF rate, and stable-employment percentage? A property-management company in the area should have these aggregated.
- How much new for-sale + rental construction is in the pipeline within 1–3 miles? Heavy new supply typically softens prices + rents 12–24 months out; constrained supply supports both.
Investment metrics
- 1% rule
- 3.65% ✓
- Cap rate
- 31.45%
- Cash-on-cash
- 89.84%
- DSCR
- 5.00
- GRM
- 2.3
CMA / ARV
- ARV (median comp)
- $65,463
- List price
- $29,000
- Delta
- -55.70%
- Verdict
- UNDERPRICED
- Comps
- 20 within 1.0 mi
Show comp detail 8 sales within ~0.75 mi
| Address | Dist | Beds/Ba | Sqft | Sold | Price | $/sf | Match |
|---|---|---|---|---|---|---|---|
| 510 Beaver Ave | 0.08mi | 2/1.0 | 1,036 (+3%) | 17mo | $78,500 | $76 | 78 |
| 402 Beaver Ave | 0.03mi | 2/1.5 | 1,152 (+14%) | 5mo | $129,900 | $113 | 68 |
| 503 5th St | 0.07mi | 2/1.0 | 1,080 (+7%) | 20mo | $43,000 | $40 | 68 |
| 326 1/2 Erie St | 0.14mi | 3/2.0 (+1) | 1,125 (+12%) | 7mo | $18,000 | $16 | 59 |
| 413 River Ave | 0.08mi | 3/1.5 (+1) | 858 (-15%) | 10mo | $92,700 | $108 | 57 |
| 509 Beaver Ave | 0.07mi | 2/2.0 | 1,152 (+14%) | 21mo | $35,780 | $31 | 51 |
| 536 Dippold Ave | 0.74mi | 3/1.0 (+1) | 1,120 (+11%) | 23mo | $180,000 | $161 | 23 |
| 259 Wayne St | 0.73mi | 3/2.0 (+1) | 864 (-14%) | 24mo | $162,500 | $188 | 13 |
Match score weights: distance 35% · size 25% · config 20% · recency 20%. Top-matched comps best support the ARV.
Projected returns pro-forma
-3.0% appreciation · 2.05% rent growth · sell at horizon
- IRR
- 89.4%
- Equity multiple
- 5.07×
- Total profit
- $33,050
- Equity at exit
- $4,324
- IRR
- 92.2%
- Equity multiple
- 10.20×
- Total profit
- $74,736
- Equity at exit
- $2,507
Cash invested: $8,120 (down + closing). Projections, not guarantees.
Landlord ↔ Tenant lean methodology
- Overall (STATE)
- 62 Landlord-Friendly
- State Pennsylvania
- 62 Landlord-Friendly · EVEN
- County
- — inherits STATE
- City
- — inherits STATE
ZIP-level market 15001
- Home prices YoY
- -20.8%
- Rents YoY
- 2.0%
- Active inventory
- 130
- Price-to-rent
- 2.3×
Monthly cashflow live
- Estimated rent
- $1,058 medium interval (Pro) →
- Mortgage (P&I)
- −$152
- Tax from tax record
- −$64 /mo · $769/yr
- Insurance
- −$12
- HOA
- −$0
- Vacancy / Maint / Mgmt
- −$222
- Net cashflow
- $608
Break-even live
UW: 25.0% down · 7.5% · 30yr · 1.5% tax · 5.0% vac · 8.0% maint · 8.0% mgmt
Financing live
Cash to close
- Down payment
- $7,250
- Closing costs
- $870
- Reserves months
- —
- Total cash needed
- —
Loan-product check · same deal, 3 products live
Conventional
25% down · 7.5% · 30yr
- Down + closing
- —
- Monthly P&I
- —
- Monthly cashflow
- —
- DSCR
- —
- Eligible?
- —
Personal DTI + credit; lowest rate.
DSCR
20% down · 8.5% · 30yr
- Down + closing
- —
- Monthly P&I
- —
- Monthly cashflow
- —
- DSCR
- —
- Eligible?
- —
No personal income docs; deal must DSCR.
Hard money
10% down · 12.0% · 12mo
- Down + closing
- —
- Monthly P&I
- —
- Monthly cashflow
- —
- DSCR
- —
- Eligible?
- —
Short-term bridge; refi at stabilization.
Rent comps 3 comps
| Address | Beds | Baths | Sqft | Rent | $/sqft | DOM | Units | Dist |
|---|---|---|---|---|---|---|---|---|
| 946 Carle St Unit 5 Baden, PA | 1.0 | 1.0 | 700 | $795 | $1.14 | 1d | 1 | 1.21mi |
| 25 Mount Vernon Dr Aliquippa, PA | 2.0 | 1.0 | 775 | $775 | $1.00 | 12d | 1 | 1.23mi |
| 190 Economy St Aliquippa, PA | 2.0 | 1.0 | 1285 | $1,200 | $0.93 | 1d | 1 | 1.33mi |
Listing history 14 events
-
2026-06-18days on market $29,000 Active 34 DOM
-
2026-06-17days on market $29,000 Active 33 DOM
-
2026-06-16days on market $29,000 Active 32 DOM
-
2026-06-15days on market $29,000 Active 31 DOM
-
2026-06-13pricedays on market $29,000 Active 29 DOM
-
2026-06-09days on market $33,000 Active 25 DOM
-
2026-06-08days on market $33,000 Active 24 DOM
-
2026-06-07days on market $33,000 Active 23 DOM
-
2026-06-03days on market $33,000 Active 19 DOM
-
2026-06-02days on market $33,000 Active 18 DOM
-
2026-06-01days on market $33,000 Active 17 DOM
-
2026-05-31days on market $33,000 Active 16 DOM
-
2026-05-15$33,000 Active 92-char remark
-
1980-12-01soldstatus $12,000
ⓘ Source: listings_history table (triggers on properties + properties_extension) + one-shot
backfill from property_details.listing_events for pre-trigger history.
Tax reassessment forecast PA · Partial reset (capped growth)
- Current annual tax
- $769 · $64/mo
- Projected year-2 tax
- $769 · $64/mo
- Expected delta
- $0/yr ($0/mo · 0.0%)
ⓘ Screening estimate from a state-policy table — verify with the county assessor before closing.
Climate risk First Street
- Flood 6/10 Major FEMA zone X (unshaded) · 27% chance over 30 yrs
- Wildfire 1/10 Low
- Heat 4/10 Moderate 8 d/yr ≥98°F today · 19 d/yr by 30 yrs out
- Wind 2/10 Low
- Air quality 3/10 Moderate 2 unhealthy d/yr today · 3 by 30 yrs out
Nearby sold comps map
Loading sold comps map…
Walkable amenities ~0.75 mi
Loading nearby amenities…
Taxation est. · year 1
- Rental income
- $12,701
- − Mortgage interest
- −$1,624
- − Property taxes
- −$769
- − Insurance
- −$145
- − Repairs & maintenance
- −$1,016
- − Management
- −$1,016
- − Depreciation
- −$844
- Taxable income
- $7,287
- Est. tax owed @ 24.0%
- −$1,749
- After-tax cash flow
- $5,546/yr
For passive investors: Depreciation is non-cash, so a rental often shows a tax loss while cash-flowing — sheltering income. Rental losses are passive: they offset passive income freely, and up to $25,000/yr can offset ordinary (W-2) income if you actively participate and your MAGI is under $100k (phasing out to $0 by $150k); unused losses carry forward. On sale, claimed depreciation is recaptured at up to 25%, and gains may owe capital-gains tax (a 1031 exchange can defer both). Figures are a year-1 estimate at your 24.0% rate — not tax advice; consult a CPA.
Schools (NCES district)
- District
- Aliquippa SD
- NCES district ID
- 4202130
- Math proficiency
- 4% ▼ -9.00%
- Reading proficiency
- 19% ▼ -10.00%
- Median HH income
- $31,613
- Composite
- 9.05/100
- National rank
- #9874
- State rank
- #530 of 539 in PA
Livability — Aliquippa
- Score
- 80/100
- State rank
- #216
- US rank
- #1891
Category grades
Schools grade is shown separately in the Schools card above.
Census & demographics
- Census place
- Aliquippa, PA
- County
- Beaver County · 116,001 people
- City population
- 31,976
- Metro
- Pittsburgh, PA
- Population (ZIP)
- 31,976
- Household income
- $70,985
- Rent vs Own
- Severe rent burden
- 720.0
Population outlook (Beaver County) Hauer SSP2
- Today (2025)
- 164,976 people
- By 2030
- 161,449 · -2.1%
- By 2040
- 151,752 · -8.0%
- By 2050
- 141,155 · -14.4%
- By 2075
- 118,142 · -28.4%
- By 2100
- 91,740 · -44.4%
Race, ethnicity, and origin ACS 2023
- Neighborhood character
- Predominantly White (80%)
- Race & ethnicity
- White 80% Black 13% Two or more races 5% Hispanic / Latino 2%
- Common ancestry
- Romanian 6% Serbian 2% Subsaharan African 2%
- Foreign-born
- 3% · Canada
- Languages at home
- 96% English-only · Other Indo-European 2% Spanish 1% German/W. Germanic 1%
Political lean MEDSL · Beaver
- 2024 margin
- Strong R (+20.7) · D 39.2% · R 59.9%
- 2008→2024 swing
- -17.9pp toward R · 2008: -2.8pp · 2024: -20.7pp
- All cycles
- 2024: R+20.7 2020: R+17.7 2016: R+20.1 2012: R+6.6 2008: R+2.8
Not yet ingested
- Civics
- —
Market trends
- HPI YoY
- ▼ -65.21%
- Current HPI
- 247.7251
- Rent YoY
- ▲ 2.05%
- Metro
- Pittsburgh, PA
- State GDP YoY
- ▲ 1.68%
- F500 in state
- 34
Industry mix (Fortune 500 HQ in PA)
| Industry | F500 HQs | Revenue |
|---|---|---|
| Healthcare | 2 | $309B |
|
||
| Insurance | 2 | $27B |
|
||
| Telecommunications / Media | 1 | $124B |
|
||
| Industrial Distribution | 1 | $22B |
|
||
| Financial Services | 1 | $20B |
|
||
| Chemicals / Materials | 1 | $18B |
|
||
Price history
+141.7% since first listed3 events — show timeline
- 2026-06-12 Price Changed $29,000 West Penn MLS
- 2026-05-15 Listed $33,000 West Penn MLS
- 1980-12-01 Sold (Public Records) $12,000 Public Records
Property tax history
+2.0%/yrLatest (2026): $769 · -1.0% YoY. Source: county tax records.
Cash-flow waterfall
monthlySold comps — $/sqft
last 12 mo · ≤1 miLoading sold comps…